Blahtech Daily Range
- インディケータ
- Blahtech Limited
- バージョン: 3.9
- アップデート済み: 2 7月 2024
- アクティベーション: 10
Was: $99 Now: $34
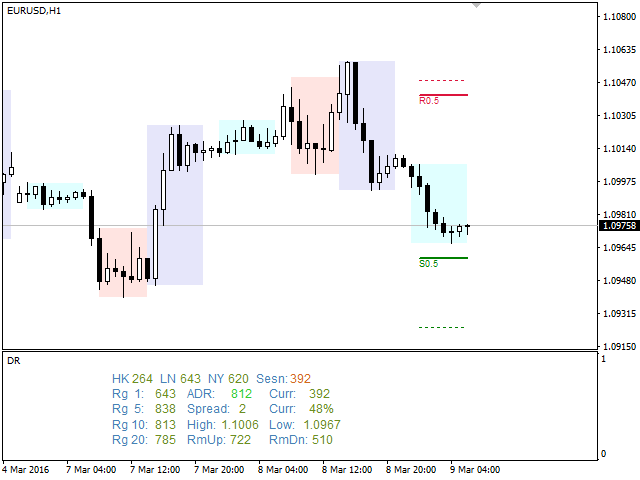
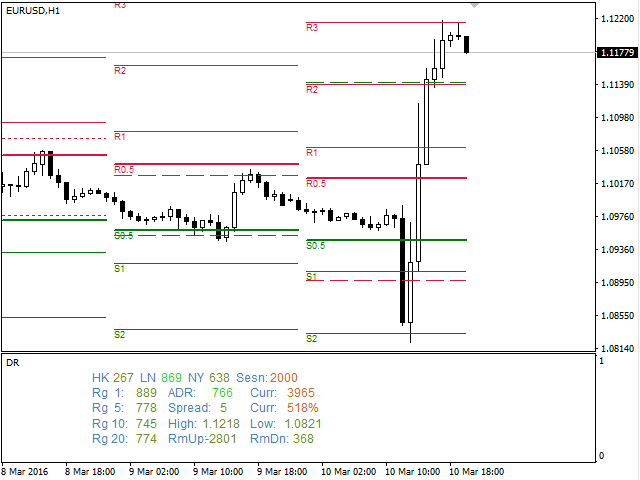
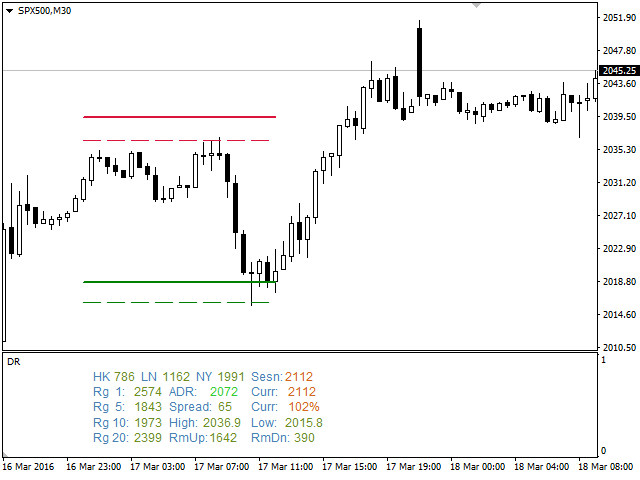
Blahtech Daily Range indicator displays the average daily range alongside the individual session ranges. Using the daily open price as a reference the indicator shows fixed range and dynamic range targets as lines on the charts. These lines clearly show when the average range has been exhausted. Daily and session ranges can be useful for confirming entries or setting targets and is an excellent odds enhancer for many trading systems.
Links [ Documentation | Install | Update | Training | All Products ]
Feature Highlights
- Daily Ranges
- Session Ranges
- Single or multiple ranges
- Fixed and dynamic exhaustion chart lines
- Highlighting of larger ranges
- Configurable targets and highlight values
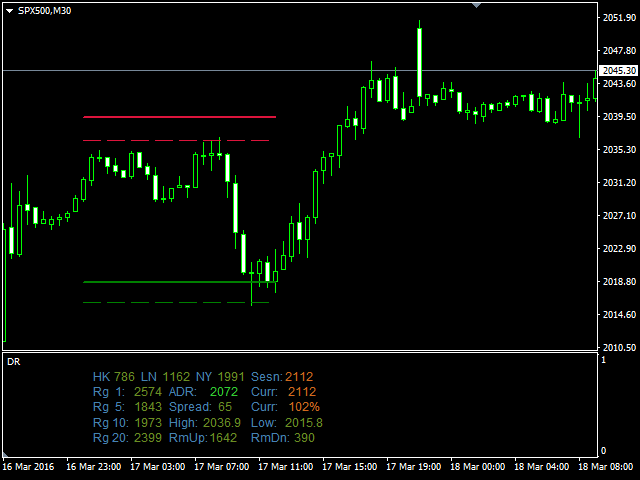
- Backtest directly on the chart
- Customisable alerts and messages
- Selectable period for higher timeframes
- Fast access hot-keys
Developers – iCustom Buffers
- Empty
- ADR
- Open
- Close
- High
- Low
- RoomUp
- RoomDown
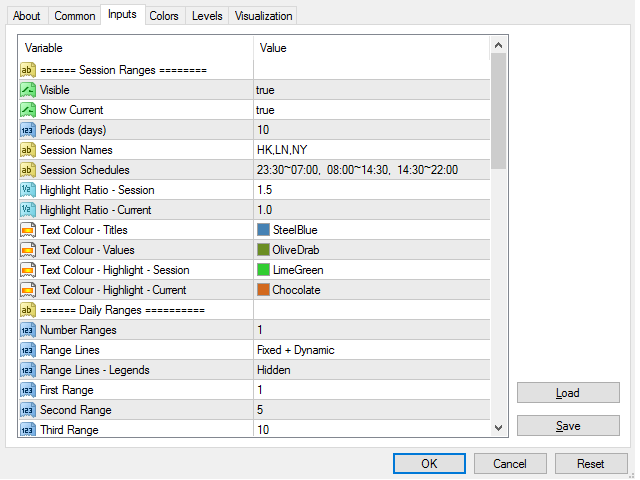
Inputs
Session Ranges
- Visible - Display the session ranges text
- Show Current – Display the current session range
- Periods (days) – Number of days for the average session size
- Session Names – Comma separated list of session names
- Session Schedules – Comma separated list of session times
- Highlight Ratio – Sessions - Relative percentage at which a session should be highlighted
- Highlight Ratio –Current - Percentage at which the current session should be highlighted
- Text Colour –Titles
- Text Colour - Values
- Text Colour - Highlight – Session
- Text Colour – Highlight – Current
- Zone Colour 1 – Colour for Session 1
- Zone Colour 2 – Colour for Session 2
- Zone Colour 3 – Colour for Session 3
- Zone Colour 4 – Colour for Session 4
- Number Ranges – Number of ranges to display on the chart
- Range Lines – Show / hide the fixed, exhaustion and projection lines on the chart. Hot-key “A”
- Range Lines – Legends - Text to display below the lines – Projections/Timeframes. Hot-key “\”
- First Range - Number of periods to use for first range
- Second Range
- Third Range
- Fourth Range
- Average Range Calc Type – Avg Range / Avg True Range
- Average Range Composition – Choose ranges that make up the Avg range calc
- Timeframe - Period to use for ranges (default Daily)
- Projections – Fixed – Size of the first fixed projection
- Projections – Levels – Comma separated list of the other projections
- Highlight Ratio –Current - Percentage at which the current range should be highlighted
- Text ADR Title – Text to be used for the ADR title
- Text Colour –Titles
- Text Colour - Values
- Text Colour - ADR Value
- Text Colour - Highlight – Current
- Lines Colour - High – Colour for high lines
- Lines Colour - Low - Colour for low lines
- Lines Prices – Show Prices at right side of lines on the chart. Hot-key “P”
- Line Style – Target – Line style for target line before exhaustion
- Line Style – Exhausted – Line style for target line after exhaustion
- Line Style – Projections – Fixed
- Line Style – Projections – Levels
- Lines Projections – Fixed Thickness
- Daily Range Start Hour (GMT) – Option to change the start hour of the day
- Roll Sunday Range – Option to move Sunday range into Monday or Friday
- Instance Id
- Text Font
- Text Size – Titles / Values
- Text Size – Line Legends
- Text Spaces
- Text Start Column
- Text Start Row
- Alerts – Popup
- Alerts – Email
- Alerts – Notification
- Alerts – Sound Wav File
- Alerts – Startup Delay Seconds
- Alert – Message Text
- Alert Email – Subject
- Alert Email – Body Text
- Hot Key Map – Allows the user to reassign the hot-keys
- “A” Show/hide the lines on the chart
- “B” Switches Backtest mode on/off
- “C” Clears all Blahtech indicator graphics from the chart. Pressing “C” again brings them back
- “R” Resets the indicator. (Backtest mode and any hot-key values are reset)
- “P” Shows Prices to the right of the chart lines
- “\” Show/hide the legend text under the lines
- Backtest Mode Expire Time (mins) - Set the number of minutes to wait before cancelling backtest mode (0 = no limit)
- GMT Offset - Use Daylight Savings - Adjust the time by 1 hour if your local computer has switched to daylight savings mode
- GMT Offset - Manual GMT offset in seconds. Set if your broker clock does not match expected session times


The best ADR indicator. Custom ADR time range. I use 8: 00- 22:00 CET. Blahtech suply demand + volume profile + ADR is the best combination. I still use pivot points. no delayed oscillators, no candle, only limit orders.