Smarter Trend Channel
- インディケータ
- Moegamat Luqmaan Titus
- バージョン: 1.1
- アクティベーション: 5
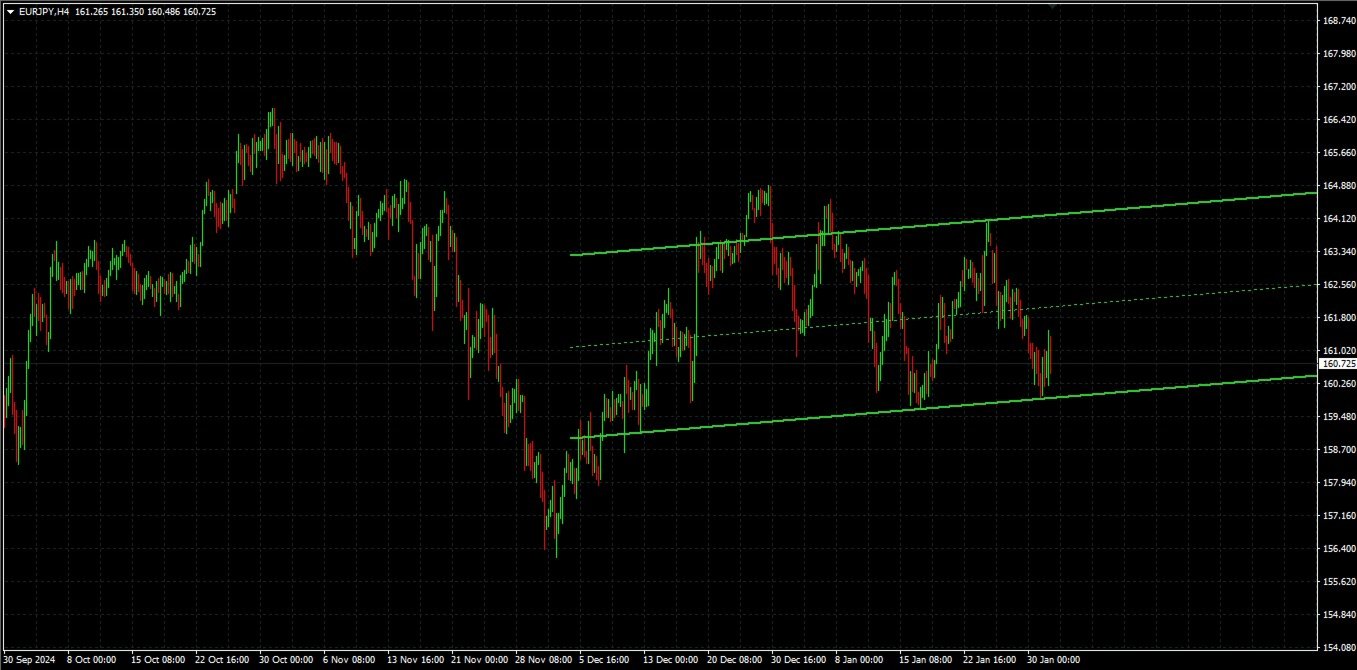
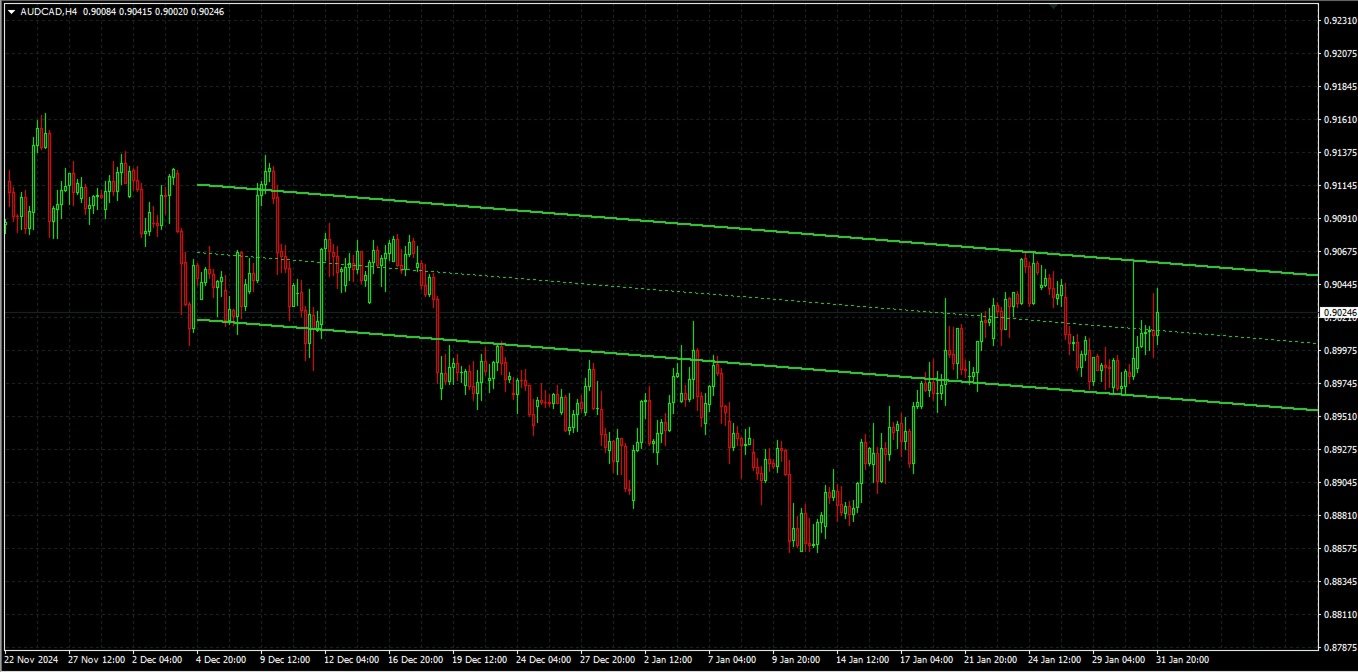
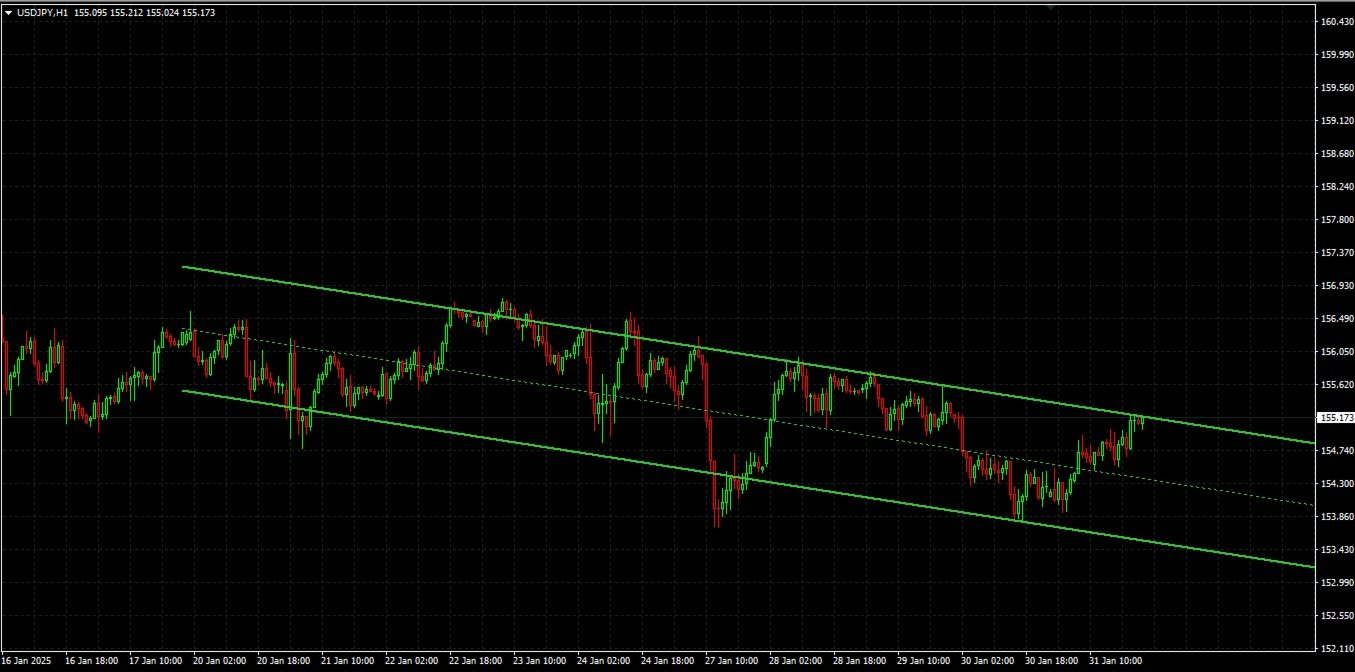
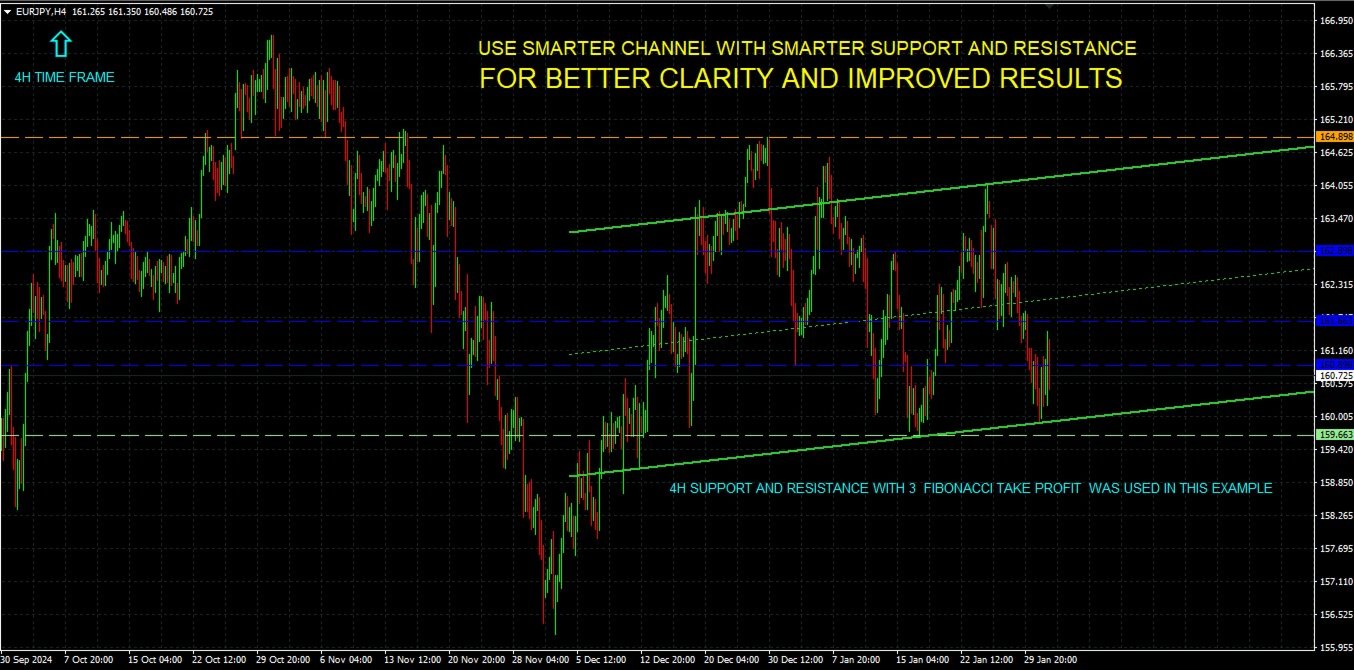
スマートトレンドチャンネルインジケーター
説明:
スマートトレンドチャンネルインジケーターは、価格チャート上に動的にサポートラインとレジスタンスラインを描画することによって、市場の主要なトレンドを視覚的に特定するための強力で柔軟なツールです。高度なフラクタル計算を使用して、インジケーターは市場の変動に応じてトレンドラインを自動的に調整し、トレーダーがブレイクアウトや反転ポイントを検出できるように支援します。
主な機能:
- チャネル表示の制御: トレンドチャネルの表示をオンまたはオフにするオプションがあります。
- 動的フラクタル計算: 時間枠やフラクタルパラメーターに基づいて自動的にトレンドラインが調整されます。
- 明確なトレンドの可視化: 上限線、下限線、中間線の3つのラインで市場のトレンドを明確に示し、取引の意思決定をサポートします。
- カスタマイズ可能なラインの色: 市場の重要なレベルを強調表示するために、ラインの色を個別に設定できます。
- 複数の時間枠に対応: 1分足から1ヶ月足まで、さまざまな時間枠に自動的に適応します。
利点:
- 市場の強いトレンドや反転ポイントを識別できます。
- 市場構造に関する情報を提供し、取引に対する自信を高めます。
- 自動的にトレンドラインを描画し、時間を節約します。
使用シナリオ:
- ブレイクアウト取引、トレンドフォロー、テクニカル分析を行うトレーダーに最適です。
- 短期スキャルピングと長期的な市場分析の両方に適しています。
スマートトレンドチャンネルインジケーターは、市場分析のためのインテリジェントでカスタマイズ可能なソリューションを提供し、トレーダーが市場の動向に遅れずについていき、情報に基づいた取引の意思決定を行うための支援をします。