Optimum Points MT4
- インディケータ
- Yuriy Lyachshenko
- バージョン: 1.0
- アクティベーション: 10
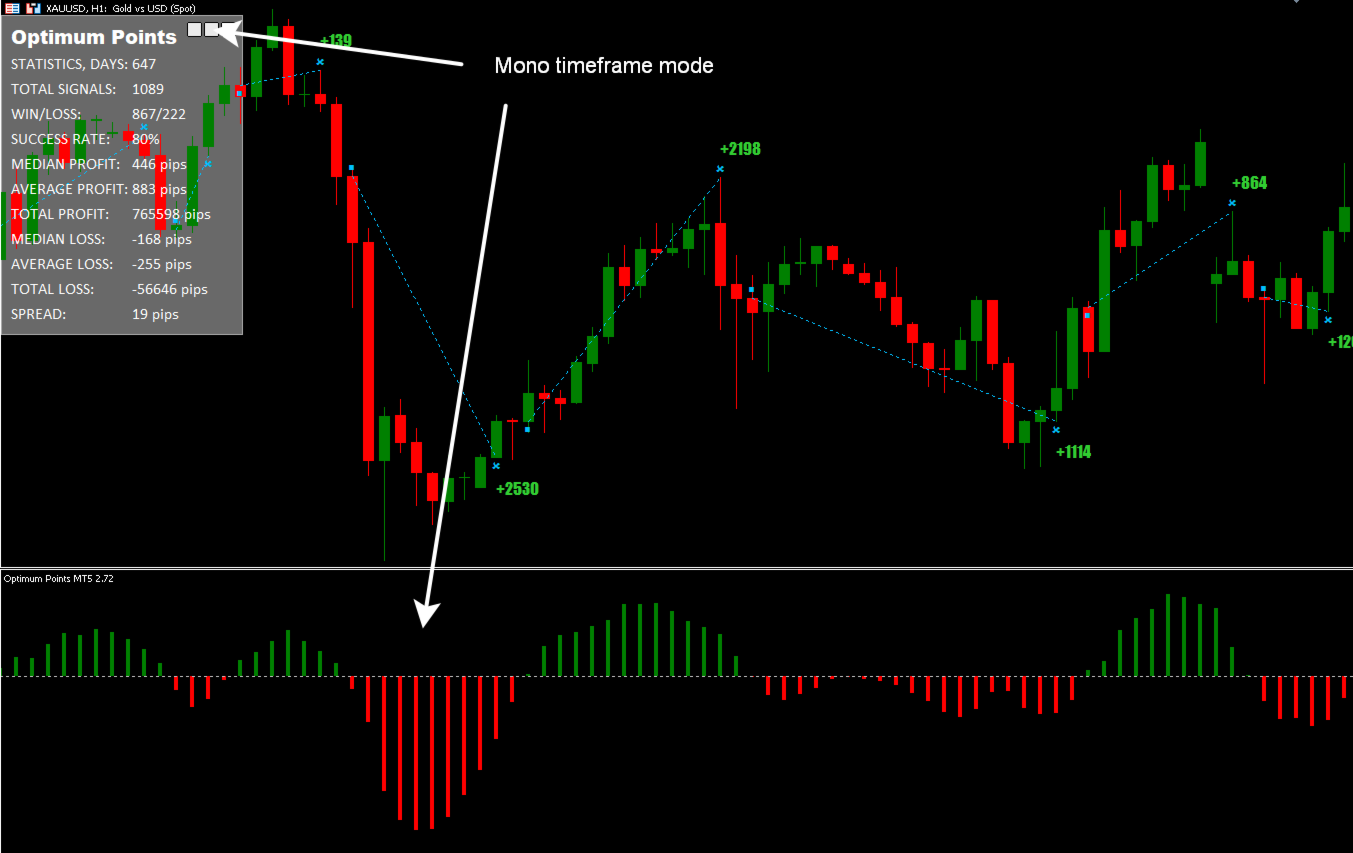
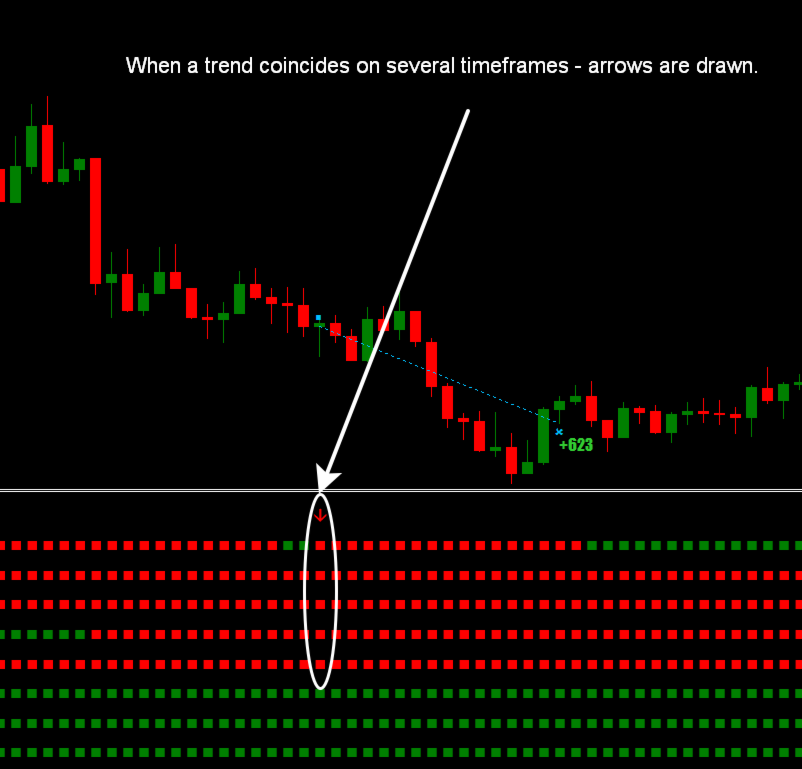
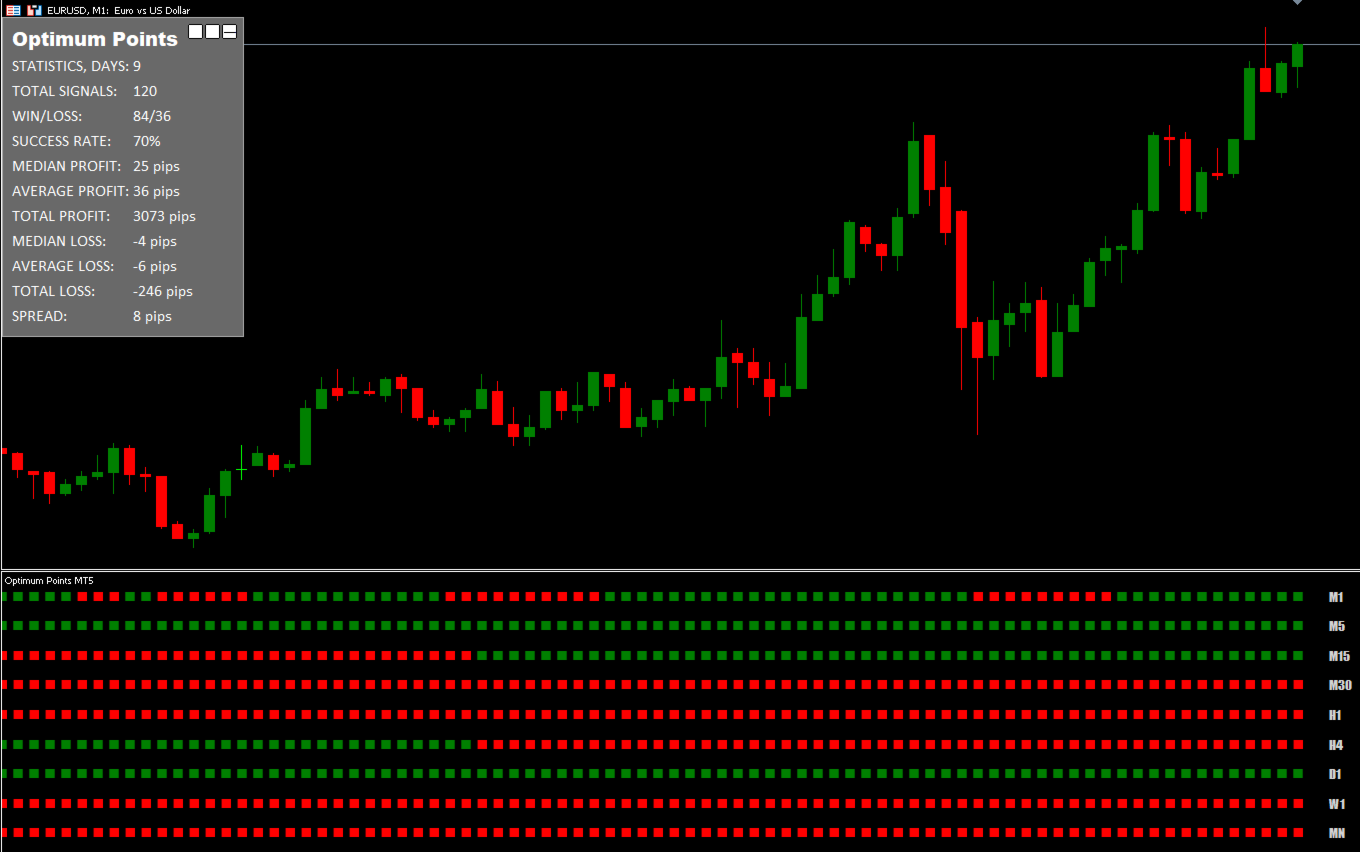
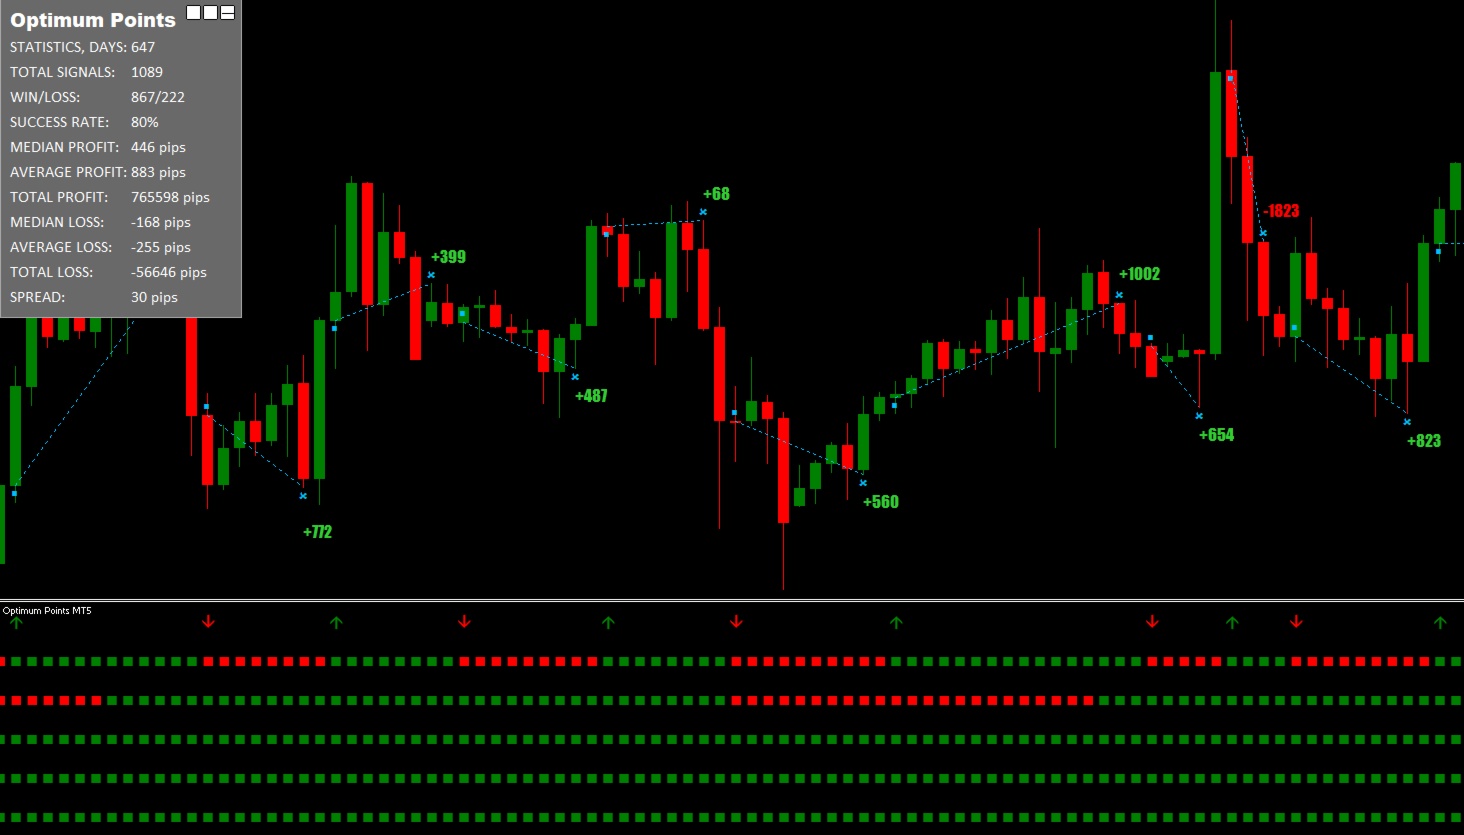
このインディケータは、1つのウィンドウで複数のタイムフレームのトレン ド方向を表示します。複数のタイムフレームのトレンドが一致する場合、矢印が描かれます。 また、ヒストグラムに切り替えて、現在のタイムフレームのトレンドを表示することもできます。
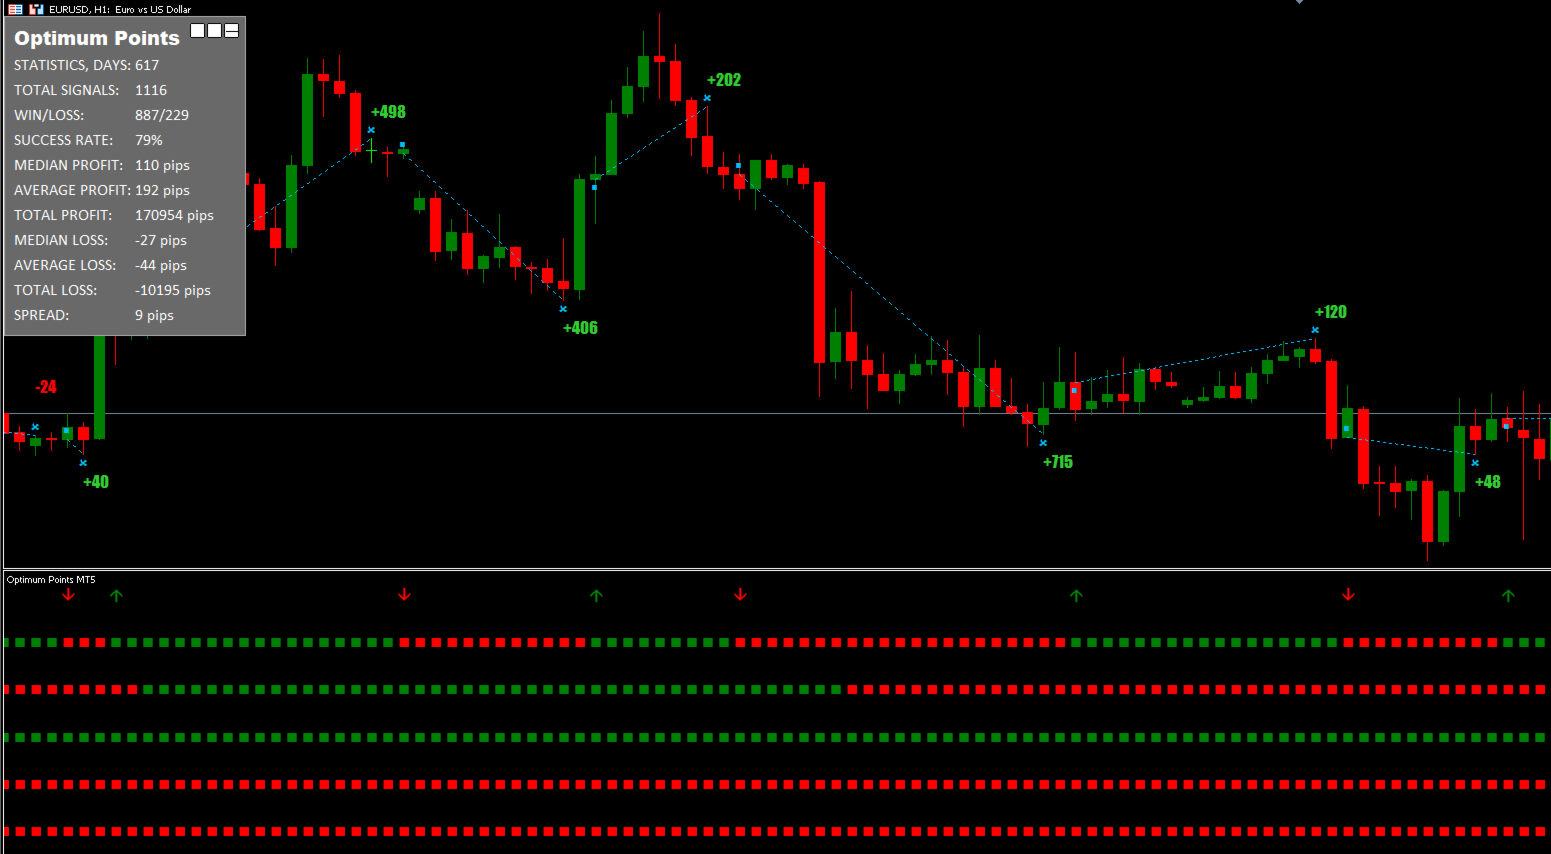
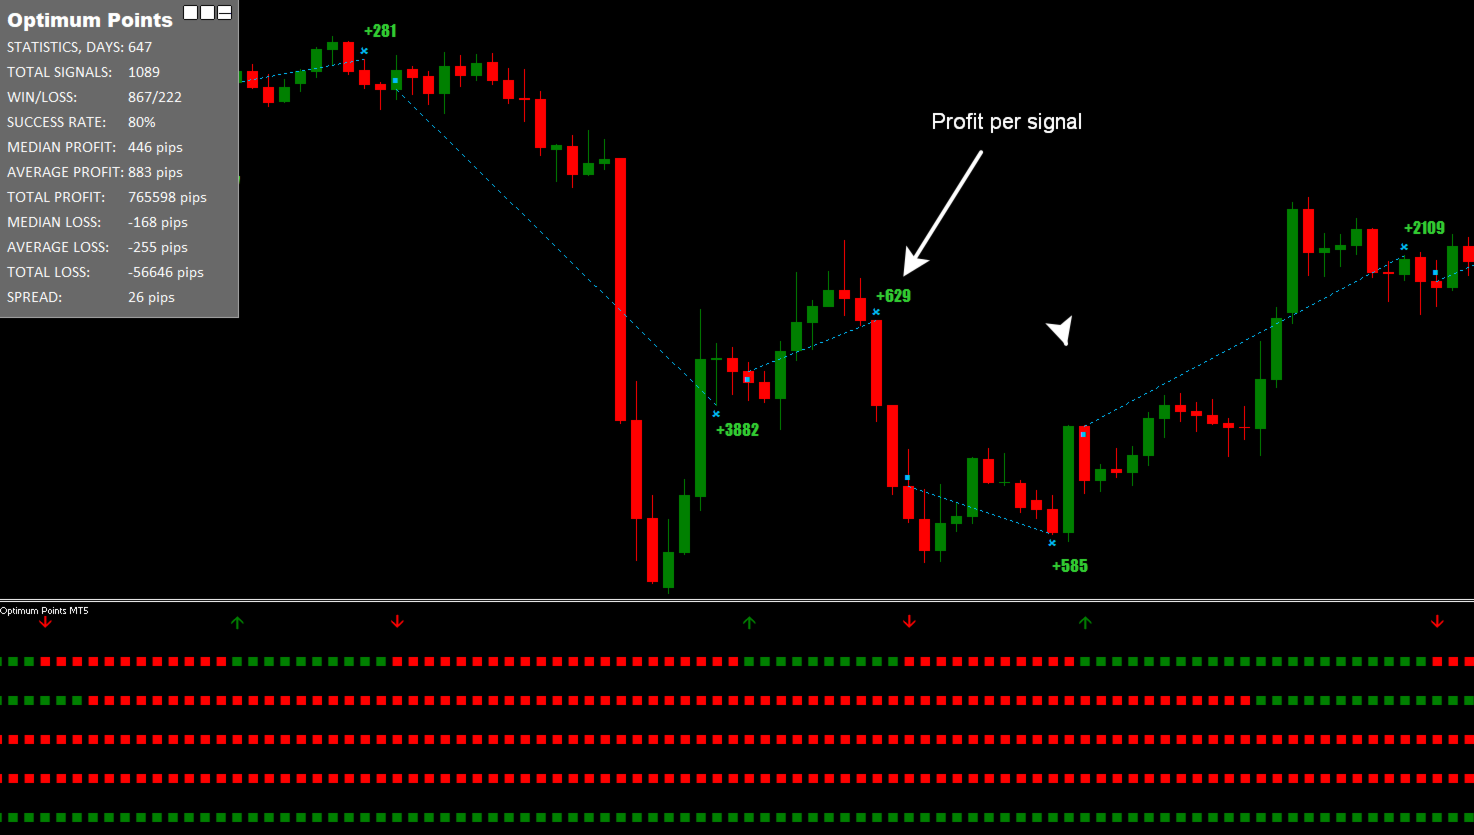
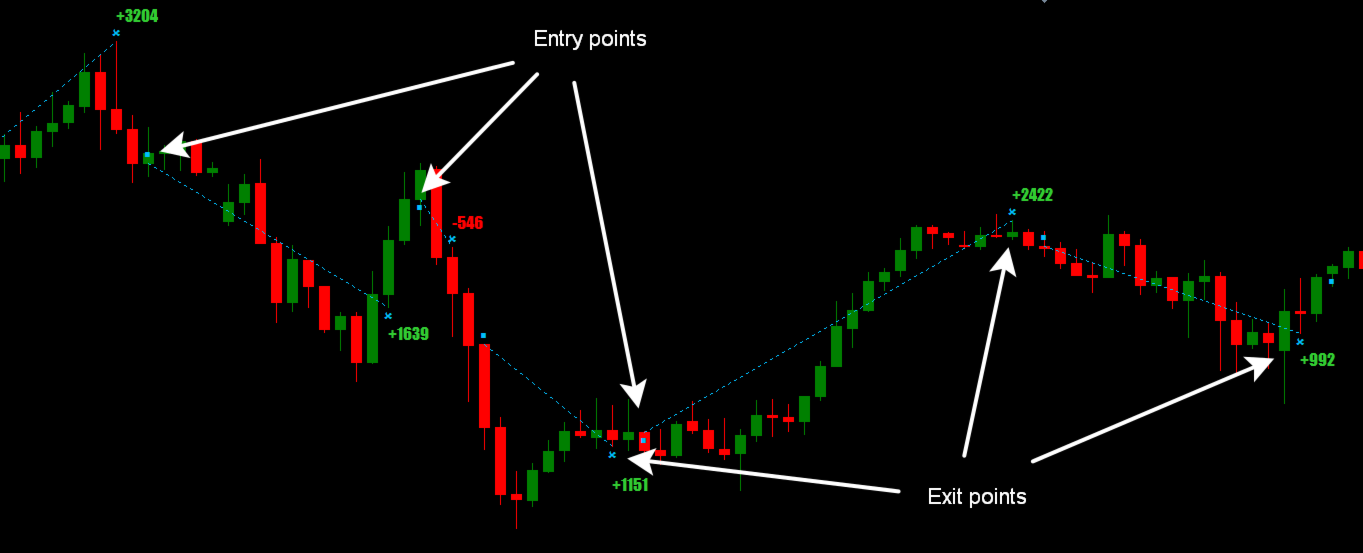
このインディケータは、チャート上にエントリーポイントとおおよそのエグジットポ イントを描画します。
警告:このインディケータはマルチタイムフレームであるため、ストラテジーテスターで使用する場合は、必要なすべてのタイムフレームの相場を事前にダウンロードしておく必要があります。テスターで長い間相場のダウンロードを待たずに済むように、開始日を2025.01.01とし、モデルを「オープンプライスのみ」または「コントロールポイント」とすることができます。
特徴
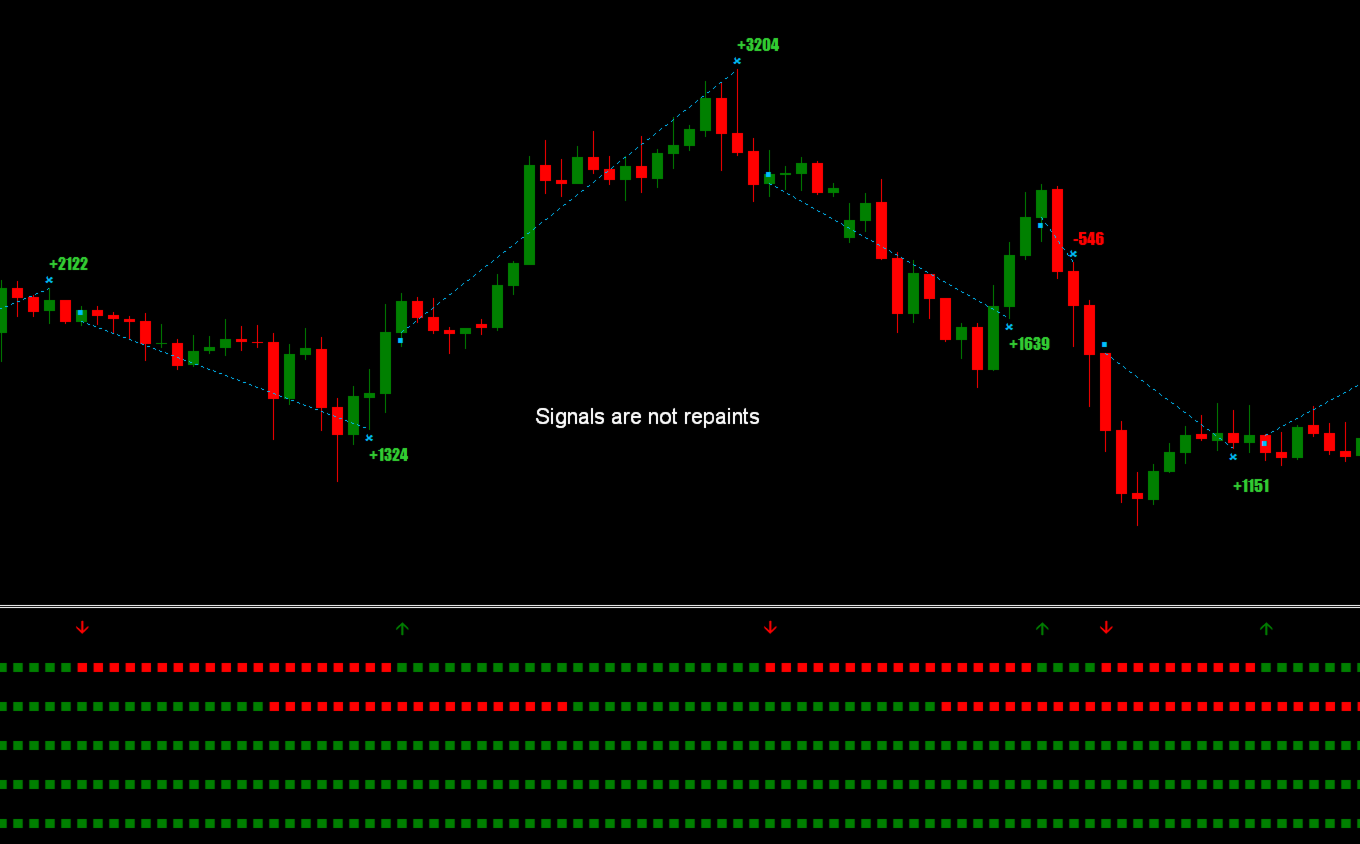
- このインディケータは再描画しません。ヒストリカルチャートに表示されているものがリアルタイムで表示されます。
- 暗号通貨、株式、金属、指数、商品、通貨など、あらゆる資産の取引に使用できます。
- すべてのタイムフレームに対応。
- エントリーのシグナルは新しいローソク足の始動時に表示され、再描画されません。
- 取引終了のシグナルは暫定的に表示されます。
- 左上には取引統計の詳細パネルがあり、最小化することができます。
- 移動平均の計算には特別な計算式を使用し、トレンドの方向を決定します。
- 取引開始のシグナルを見逃さないために、アラートウィンドウとプッシュ通知で通知を受け取ることができます。
- 初心者から上級者まで、あらゆるレベルのユーザー向けです。
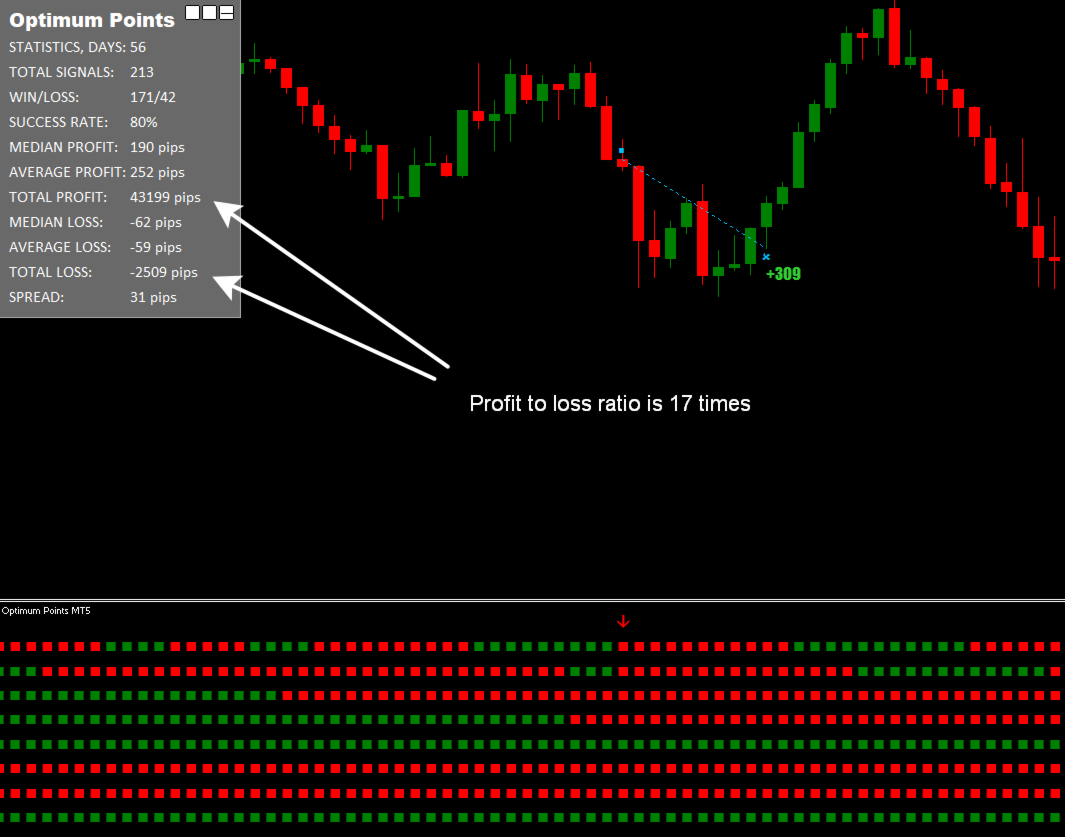
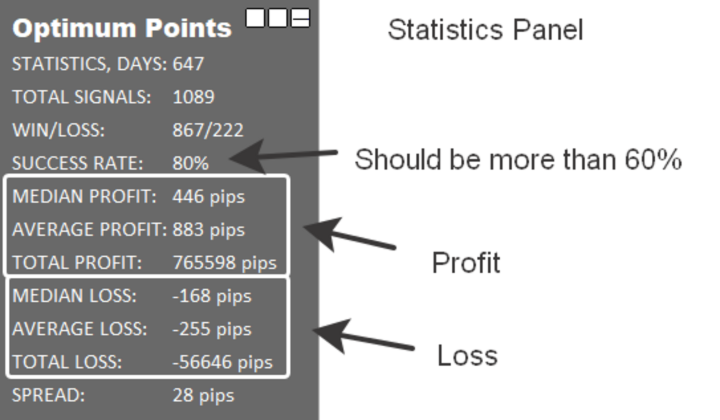
統計パネル
- シグナル履歴の取得日数
- 統計されたシグナル総数
- 収益性の高いシグナル数と収益性の低いシグナル数の比率。
- 全シグナル数からの収益性の高いシグナルの割合。
- シグナルごとの利益の中央値
- シグナル別の平均利益
- 全シグナルの合計利益
- シグナル別の損失の中央値
- シグナル別の平均損失
- 全シグナルの損失合計
- 現在のスプレッド
設定パラメータ
| Period | インジケータの感度、感度が高いほど多くのシグナル |
| M1-MN1 coincidences | トレンドが一致した時に矢印が描かれる時間枠の選択。 |
| Font size | 統計パネルの文字サイズ |
| Show entry/exit points | エントリー/エグジットポイントの表示オン/オフ |
| Use alert notification | 通知ポップアップウィンドウとサウンド通知のオン/オフ。 |
| Use push notification | プッシュ通知のオン/オフ |
ご質問やお困りのことがありましたら、お気軽に個人的にメッセージください。