Haven Volume Profile
- インディケータ
- Maksim Tarutin
- バージョン: 1.2
- アップデート済み: 19 1月 2025
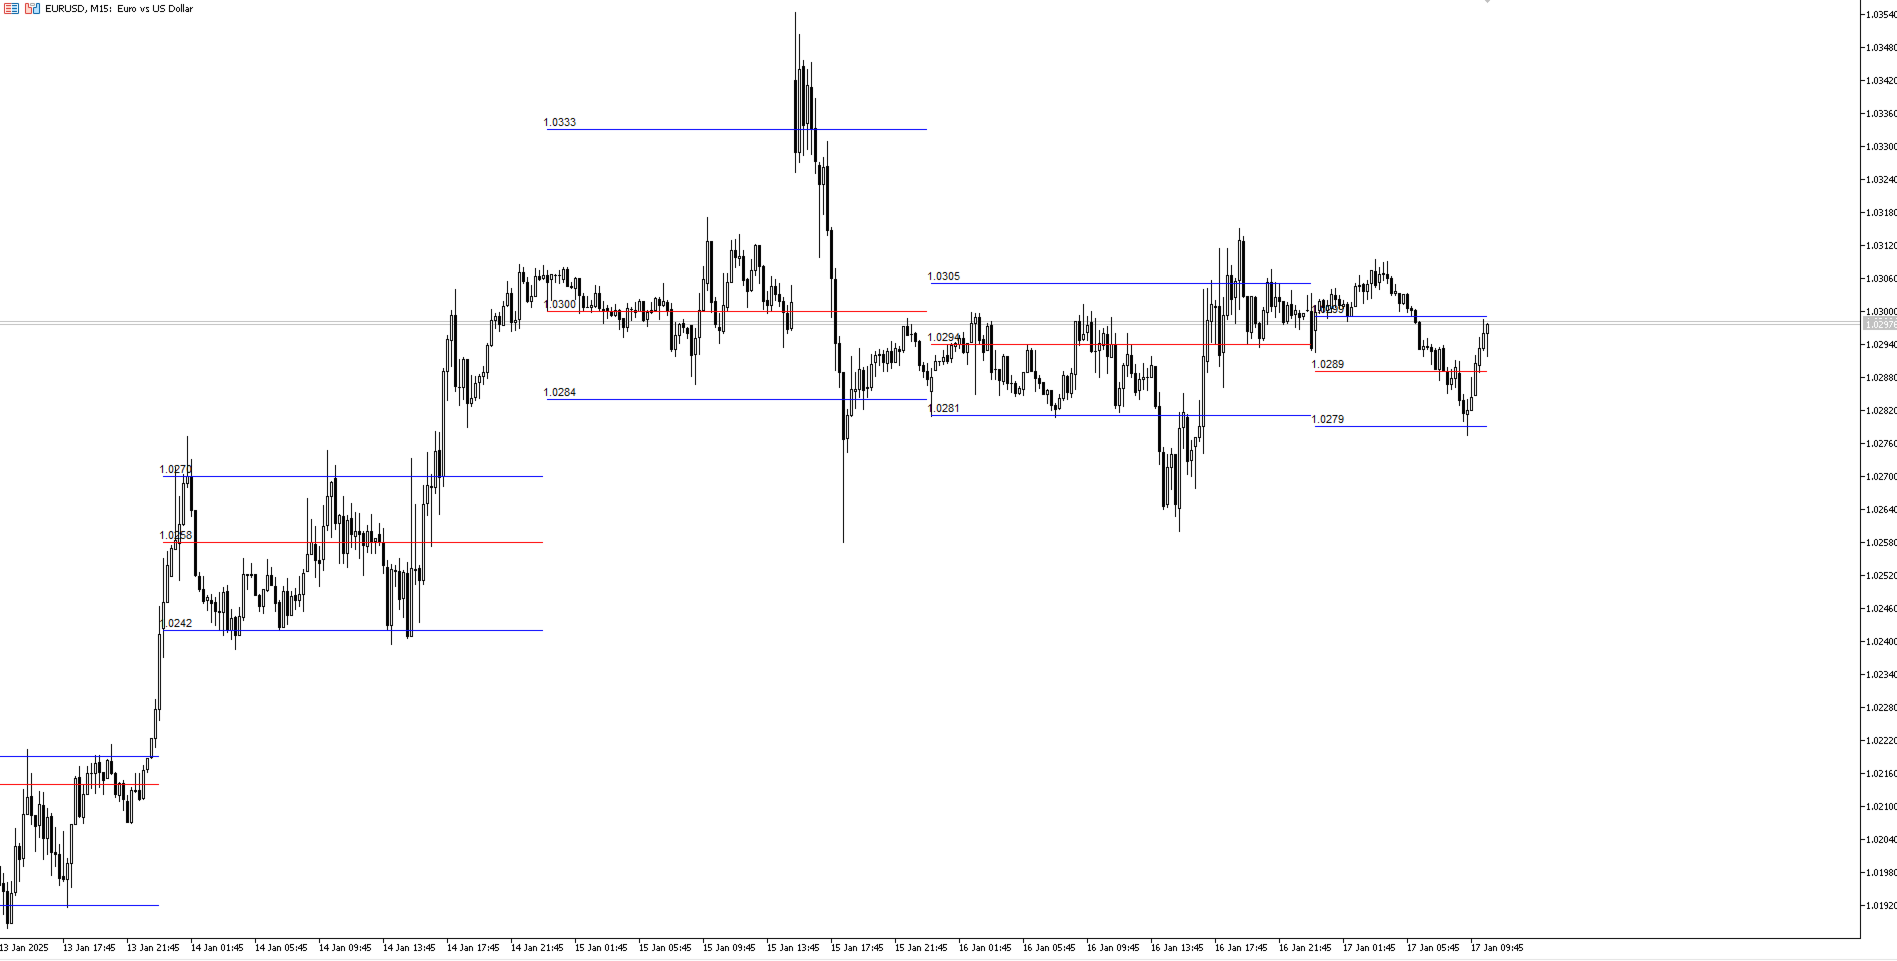
Haven Volume Profileは、取引量の分布に基づいて重要な価格レベルを識別するための多機能なボリュームプロファイル分析インジケーターです。市場をより深く理解し、重要なエントリーポイントとエグジットポイントを特定したいプロのトレーダー向けに設計されています。
その他の製品 -> こちら
主な機能:
- Point of Control (POC) 計算 - 最大の取引活動が行われるレベルで、最も流動性の高いレベルを特定するのに役立ちます
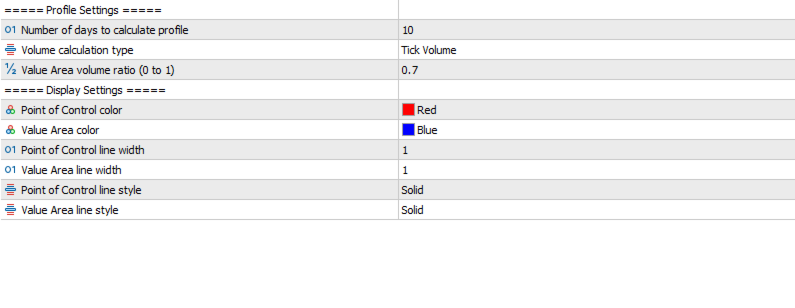
- Value Area(高い活動の領域)の定義とカスタマイズ可能な取引量の割合で、取引範囲をより正確に評価できます
- ティックボリュームと実際の取引量の両方に対応し、さまざまな市場タイプや取引戦略に対応しています
- 計算期間(日数)の柔軟な設定により、任意の時間枠にツールを適応させることができます
- ターミナルのライトテーマとダークテーマに自動的に適応し、ユーザーインターフェースの視覚的な体験を向上させます
- レベルの視覚化が明確で、スタイルや色をカスタマイズでき、グラフ分析と迅速な意思決定を支援します
このインジケーターは、重要な価格レベルや統合ゾーンを特定するのに最適で、トレーダーがより情報に基づいた取引決定を下すのをサポートします。Haven Volume Profileを使用することで、取引量と市場の動態をより正確に分析し、リスクを減らし利益を増加させることができます。


good