Zoom Candle
- インディケータ
- Sopheak Khlot
- バージョン: 1.0
- アクティベーション: 5
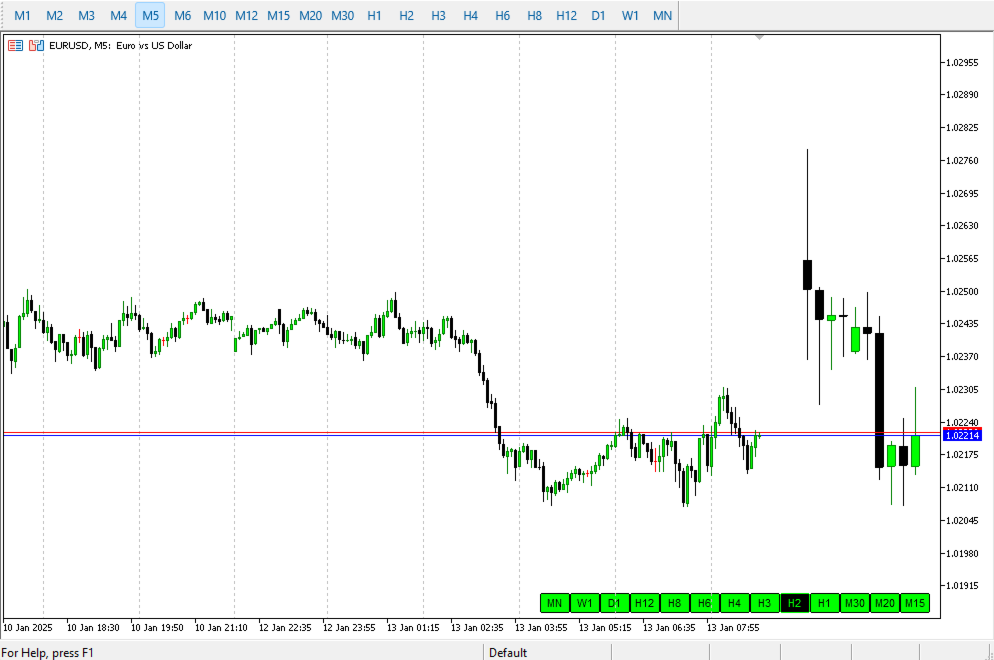
The Indicator is useful for professional trader, such as ICT , Smart Money Concept trader; who do the top-down analysis and want to display the candles of the Higher Timeframe on the Lower Timeframe.
It allows you to stay in your entry timeframe while following the narrative of the Higher timeframe.
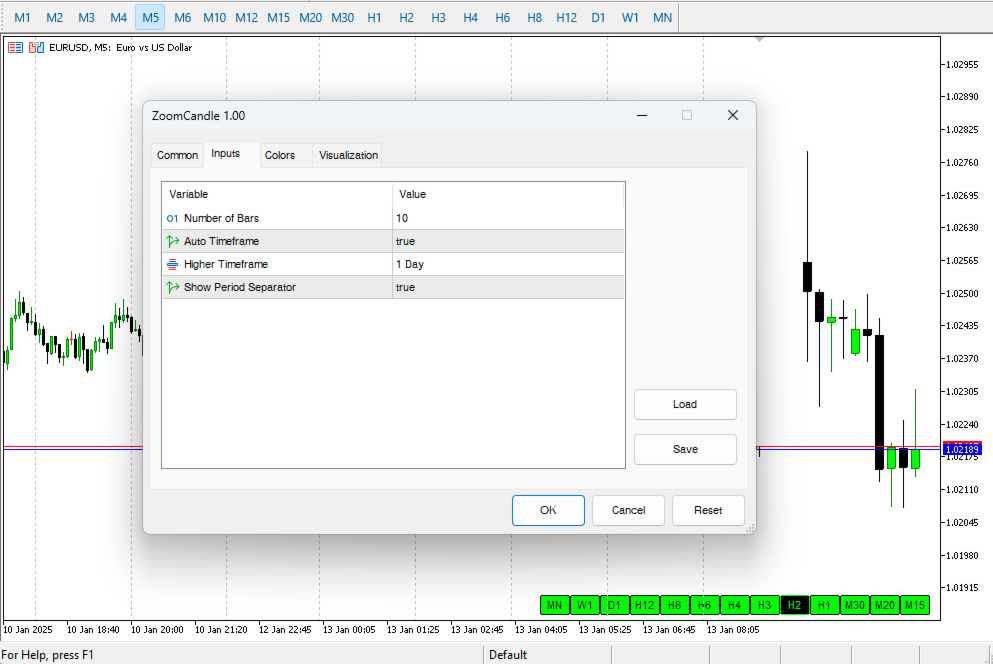
Here are some easy input:
Number Of Bars: The total of HTF's candle you want to display.
Auto Timeframe: If true, the indicator will recommend the Higher timeframe that suit the current timeframe you use on the chart.
Higher Timeframe: The default of Higher Timeframe which could be overwritten if you set Auto Timeframe to true.
Show Period Separator: If true, the indicator will print the separator line based on the Higher Timeframe.