Trade Forex Made Easy
- インディケータ
- Abdulrahman Abbas Kadhim Bedi
- バージョン: 1.0
- アクティベーション: 10
Summary:
This indicator calculates histograms representing bullish and bearish impulses relative to a moving average. The impulses are determined by the difference between the high/low prices and the MA, normalized by the point value. Higher values in the Bulls array indicate stronger bullish pressure, while higher values in the Bears array indicate stronger bearish pressure.
Key features:
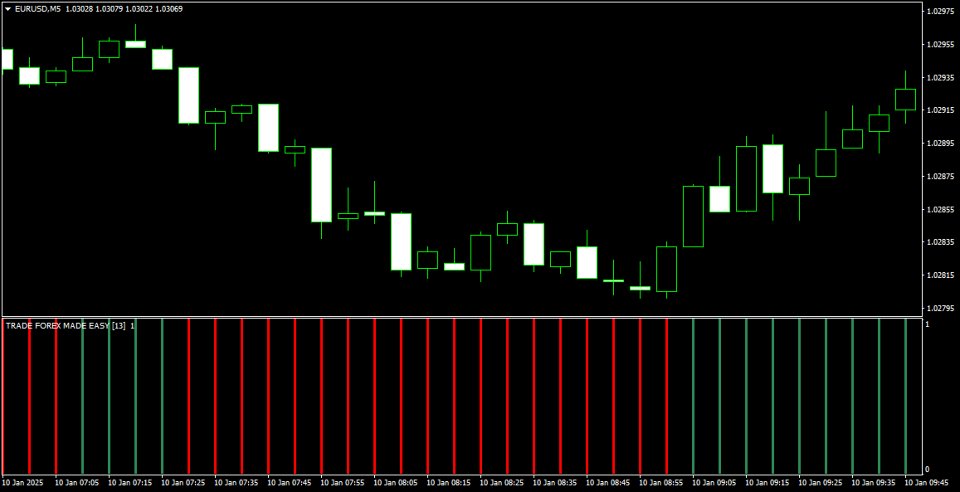
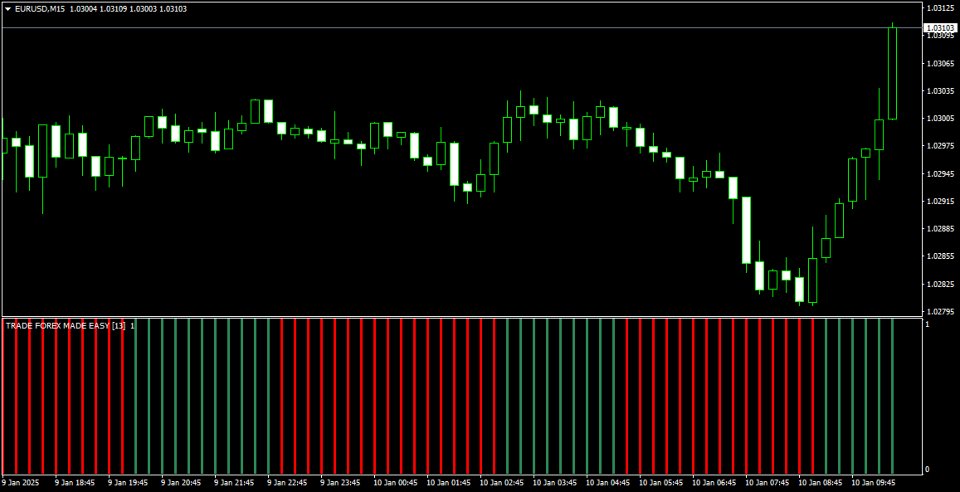
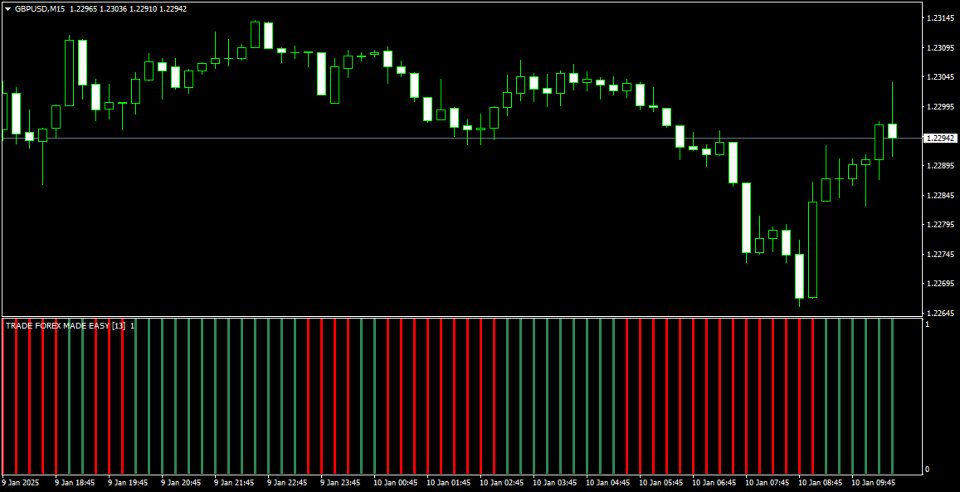
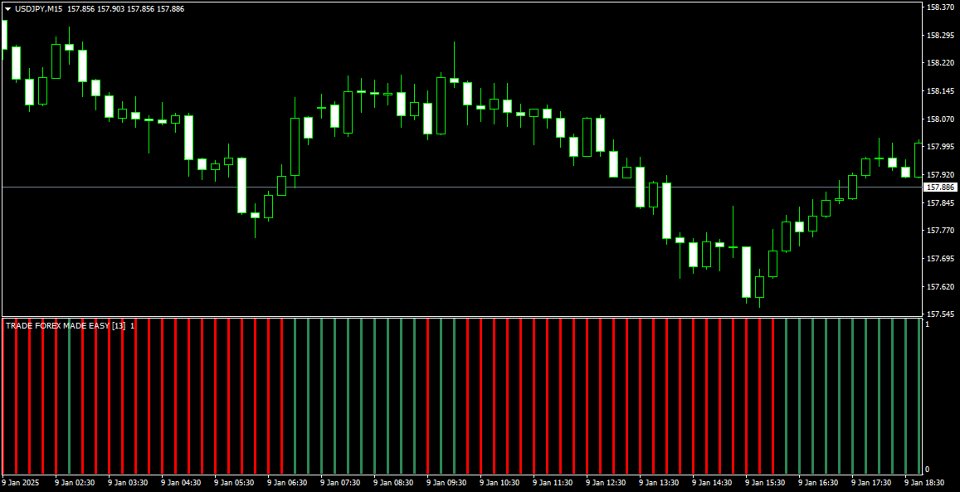
Colors: Uptrend chart is displayed in green and downtrend chart is displayed in red.
Automatic identification of trends and reversals.
Clear and easy-to-read visual signals.
Suitable for various financial markets and timeframes.
Customizable settings to match your trading strategy.
Try it and discover how TRADE FOREX MADE EASY can support your trading decisions with clear signals and advanced analysis.

