• 概要
  • レビュー
  • コメント

SimpleprobMT5

Indicator Name: Probability Indicator

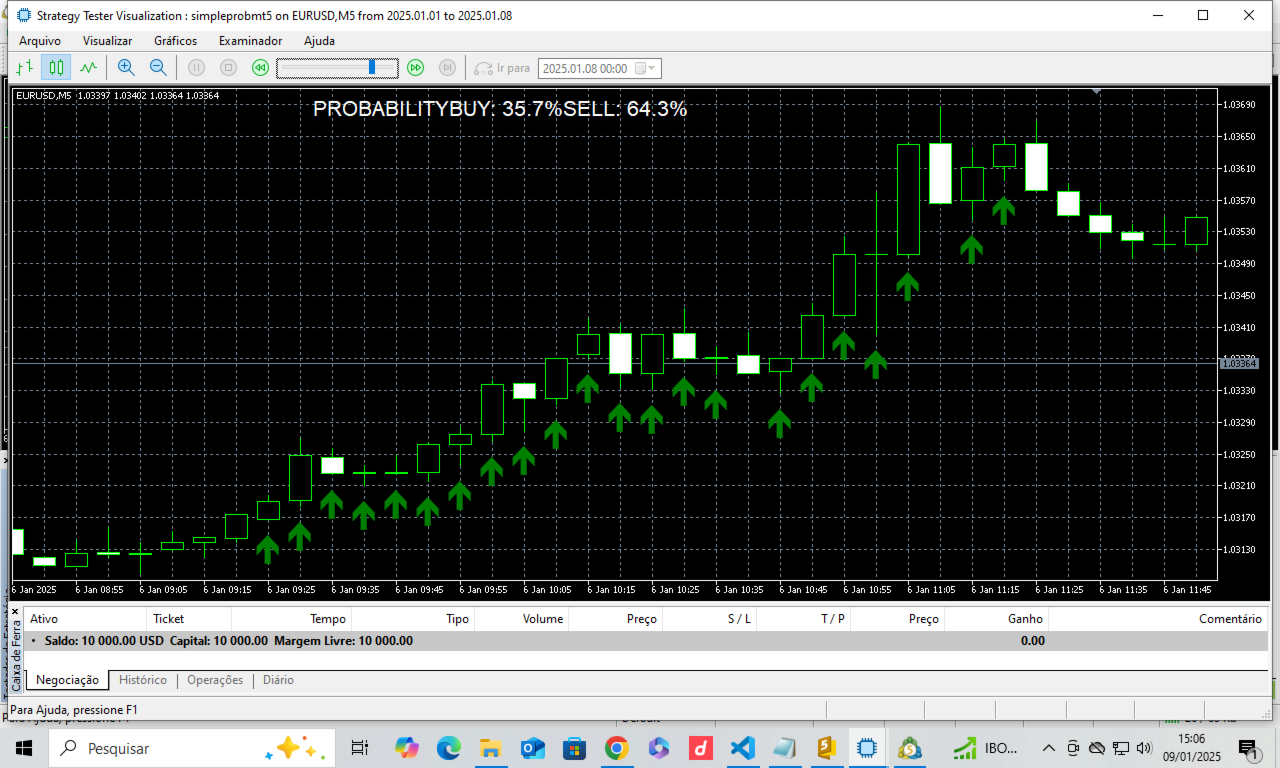
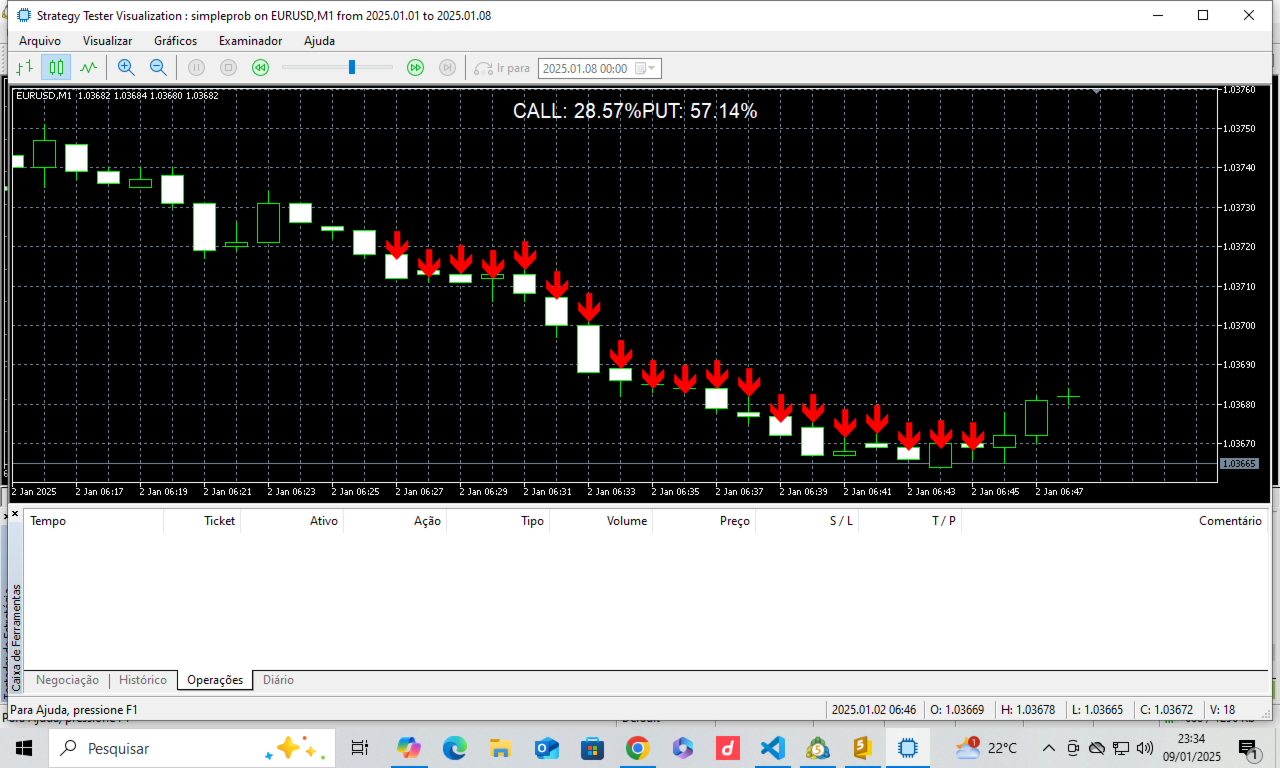
Description: The Probability Indicator is a powerful tool for traders who want to identify buying and selling opportunities based on the analysis of previous candles. This indicator calculates the probability of rise (CALL) and fall (PUT) based on the number of candles analyzed and displays arrows on the chart to signal possible entry points.

Features:

  • Candle Analysis: Analyzes a configurable number of candles to calculate the probability of rise and fall.

  • Visual Signals: Displays large, colored arrows on the chart to indicate buy (green) and sell (red) signals.

  • Sound Alerts: Emits configurable sound alerts for buy and sell signals.

  • Notifications: Sends notifications to your mobile device or email to keep you informed about trading signals.

  • Probability Box: Displays a box on the chart with real-time probabilities of rise and fall.

Input Parameters:

  • num_candles: Total number of candles for analysis.

  • call_threshold: Minimum percentage for CALL signal (green).

  • put_threshold: Minimum percentage for PUT signal (red).

  • sound_alert: Enable sound alert (true/false).

  • notifications: Enable notifications (true/false).

  • ProbabilityBoxColor: Color of the probability box.

  • call_sound1: Sound 1 for CALL signal.

  • call_sound2: Sound 2 for CALL signal.

  • put_sound1: Sound 1 for PUT signal.

  • put_sound2: Sound 2 for PUT signal.

  • call_sound_choice: Choice of sound for CALL (1 or 2).

  • put_sound_choice: Choice of sound for PUT (1 or 2).

How It Works:

  1. The indicator analyzes a configurable number of previous candles to calculate the probability of rise and fall.

  2. When the probability of rise or fall reaches the configured threshold, an arrow is displayed on the chart to signal a possible entry.

  3. Sound alerts and notifications are issued to keep you informed about trading signals.

  4. The probability box displays real-time probabilities of rise and fall on the chart.

Benefits:

  • Easy to Use: Intuitive and easy-to-configure interface.

  • Real-Time Alerts: Stay informed about trading opportunities with sound alerts and notifications.

  • Accurate Analysis: Based on candle analysis to provide highly accurate signals.

  • Customizable: Adjust input parameters to meet your trading needs.

Requirements:

  • MetaTrader 5 Platform

Note: This indicator is an auxiliary tool and does not guarantee profits. It is recommended to use it in conjunction with other technical analysis tools and trading strategies.


おすすめのプロダクト
It is very easy to use the Fibrillar indicator, since the simplest is to look at the chart and act according to the indications of the colored arrows. The algorithm takes into account the measurement of prices, and this method also focuses on measuring each of the price drops (H / C, H / O, LC, LO) - which gives more detailed information, but also more averaged. When calculating this indicator, logarithmic gains are first calculated at the closing price, which allows you to filter out the tren
This indicator plots in the candles the divergence found in the selected indicator and can also send a notification by email and / or to the cell phone. Works on all TIMEFRAMES. Meet Our Products   He identifies the divergences in the indicators: Relative Strength Index (RSI); Moving Average Convergence and Divergence (MACD); Volume Balance (OBV) and;. iStochastic Stochastic Oscillator  (STOCHASTIC). It is possible to choose the amplitude for checking the divergence and the indicator has to b
Auto Support and Resistances
Flavio Javier Jarabeck
4.56 (70)
Are you tired of drawing Support & Resistance levels for your Quotes? Are you learning how to spot Support & Resistances? No matter what is your case, Auto Support & Resistances will draw those levels for you! AND, it can draw them from other timeframes, right into you current chart, no matter what timeframe you are using... You can also Agglutinate regions/zones that are too much closer to each other and turning them into one single Support & Resistance Level. All configurable. SETTINGS Timefr
FREE
- Lifetime update free -   Real price is 80$   - 25% Discount ( It is 59$ now ) Contact me for instruction, any questions! Related Product:  Gold Trade Expert MT5 - Non-repaint - I just sell my products in Elif Kaya Profile, any other websites are stolen old versions, So no any new updates or support. Introduction The breakout and retest strategy is traded support and resistance levels. it involves price breaking through a previous level.  The break and retest strategy is designed to help trade
ゴールドターゲットは最良のトレンド指標です。 このインジケーターの独自のアルゴリズムは、テクニカル分析と数学的分析の要素を考慮して資産価格の動きを分析し、最も収益性の高いエントリーポイントを決定し、矢印の形でシグナルと価格レベル(買いエントリー/売りエントリー)を発行します。 注文を開きます。 このインジケーターには、ストップロスの価格レベルとテイクプロフィットの 5 つの価格レベルもすぐに表示されます。 注意:   このインジケーターは非常に使いやすいです。 ワンクリックでチャートにインジケーターをインストールし、そのシグナルと価格レベルに基づいて取引します。 インジケーターの利点: 1. インジケーターは高精度の信号を生成します。 2. インジケーター信号は再描画されません。 価格が各ラインを超えた場合に音声通知(アラート&メッセージ)を搭載しています。 3. どのブローカーの MetaTrader 5 取引プラットフォームでも取引できます。 4. あらゆる資産(通貨、金属、暗号通貨、株、指数など)を取引できます。 5. 任意の時間枠で取引できます (M15-M30 スキャ
The Rocket Trend indicator is trending. The indicator draws two-color points connected by lines along the chart. This is a trend indicator, it is an algorithmic indicator. It is easy to work and understand when a blue circle appears, you need to buy, when a red one appears, sell. The indicator is used for scalping and pipsing, and has proven itself well. Rocket Trend is available for analyzing the direction of the trend for a specific period of time. Ideal for novice traders learning the laws o
Functional in the Forex market. Functional on the B3 market - Bolsa Brasil Balcão. Motivation The Price Guide indicator is a tool that helps you insert support and resistance points at the chosen price and in the quantity you want, it depends on the agility of its configuration. This   FULL version   will work in   Meta Trader 5   on all accounts and   Strategy Tester . To test on the DEMO account , download the free version at: https://www.mql5.com/pt/market/product/111620 Operation The method
- This is the exact conversion from TradingView: "Support/Resistance" By "BarsStallone". - This indicator lets you read the buffers for R/S values. - This is a non-repaint and light processing load indicator. - This is not a multi time frame indicator If you want the multi time frame version you should create a personal order and I deliver two files that you need them both to have the multi time frame indicator running on your system. - The MT4 version of the indicator is not light load from pr
In MetaTrader, plotting multiple   horizontal lines   and then tracking their respective price levels can be a hassle. This indicator automatically plots multiple horizontal lines at equal intervals for setting price alerts, plotting support and resistance levels, and other manual purposes. This indicator is suitable for Forex traders who are new and looking for chances to make quick profits from buying and selling. Horizontal lines can help traders find possible areas to start trading when the
Adaptive Trend Lines
Henri Salvatore Bigatti
4.73 (22)
This indicator shows the TLH and TLL and some trendlines that allow us to estimate the trend of market.  It also shows the values of the angles of the lines in percentage in points (pip) , the standard deviation, and the trend of each line, and when it breaks the lines of support and resistance (TLH and TLL). And finally, it also shows the points identified as supports and resistances through the fractal algorithm in the graph. The high and low trend lines are supported by the highs and lows, th
FREE
Range Bar Pro
Antonio Molinaro
5 (1)
Range Bar Pro Indicator for MetaTrader 5 Visualize market trends, levels and other features with Range Bar Pro, an innovative indicator that draws a unique, standalone candle on the right side of any MT5 chart. This single candle is generated from an analysis of price over a specified range, providing you with a powerful snapshot of the market. Key Features: Single-Candle Visualization: Gain quick insights with a single, specially derived candle that reflects comprehensive price movement over a
FREE
Congestion Breakout MT5
CARLO FINANCIAL SOFTWARE TECHNOLOGY LLC
Introducing "Congestion Breakout MT5" - the indicator that helps you identify congestion zones in your chart and alerts you when the price breaks through them.   Traders know that congestion zones can be key areas of price action and can indicate potential turning points in the market. However, spotting these zones and anticipating breakouts can be a difficult and time-consuming task. That's where "Congestion Breakout" comes in. This powerful indicator uses advanced algorithms to analyze the pri
Candlestick patterns The candlestick Pattern Indicator and Scanner is designed to be a complete aid tool for discretionary traders to find and analyze charts from powerful candle patterns. Recognized Patterns: Hammer Shooting star Bearish Engulfing Bullish Engulfing Doji Marubozu Scanner Imagine if you could look at all the market assets in all timeframes looking for candlestick signals.
Range Directional Force Indicator – Designed for You to Optimize! The Range Directional Force Indicator is a cutting-edge tool designed to empower traders by visualizing market dynamics and directional strength. Built to offer insights into market trends and reversals, this indicator is an invaluable asset for traders seeking precision in their strategies. However, it is important to note that this indicator is not optimized , leaving room for you to tailor it to your unique trading preferenc
To download MT4 version please click here . This is the exact conversion from TradingView: "WaveTrend [LazyBear]" By "zeusuk3". One of the coolest indicators out there to detect overbought and oversold zones. It can be used as a part of more complicated strategy and for confirming a potential trade setup. There are buffers to use in EAs also. The indicator is loaded light and non-repaint. - You can message in private chat for further changes you need. Thanks for downloading 
Contact me after payment to send you the user manual PDF file. Download the MT4 version here. Unlocking Trading Insights Dive into the heart of market dynamics with Advance Divergence Scanner designed for traders seeking a competitive edge. The Divergence Indicator is your key to identifying crucial divergences across various charts, empowering you to make informed decisions in the dynamic world of financial markets. The Divergence A Divergence signals a potential reversal point because directi
Upper and Lower Reversal - 反転の瞬間を早期に予測するシステム。上限と下限の価格変動チャネルの境界にある価格の転換点を見つけることができます。 インジケーターの色が変わったり、信号矢印の位置が変更されることはありません。 赤い矢印は買いシグナル、青い矢印は売りシグナルです。 あらゆる時間枠と取引商品に調整します インジケーターは再描画されず、ローソク足が閉じるときにのみ機能します。 信号のアラートにはいくつかの種類があります このインジケーターは使いやすく、構成可能な外部パラメーターは 2 つだけです。 Channel Length - シグナルが構築される価格チャネルの長さを調整します。 Signal Normalization - シグナル矢印の品質レベルを変更します。パラメーターが高くなるほど、誤ったシグナルが減少します (BTC、ゴールド、および揮発性の高い商品では数桁変化します)。 Alerts play sound / Alerts display message / Alerts send notification / Send emai
A powerful oscillator that provide Buy and Sell signals by calculating the investor liquidity. The more liquidity the more buy possibilities. The less liquidity the more sell possibilities. Please download the demo and run a backtest! HOW IT WORKS: The oscillator will put buy and sell arrow on the chart in runtime only . Top value is 95 to 100 -> Investors are ready to buy and you should follow. Bottom value is 5 to 0 -> Investors are ready to sell and you should follow. Alert + sound will appe
Insight Pro is a comprehensive tool for market analysis. It offers various features such as trend analysis, resistance and support levels, and distribution analysis, suitable for both novice and experienced traders. Features Trend Analysis Detects and visualizes market trends. Suggests potential entry and exit points based on trends. Customizable trend lines for clear market direction. Displays extreme levels based on standard deviation. Positive slope indicates buy orders; negative slope indic
KT Pin Bar MT5
KEENBASE SOFTWARE SOLUTIONS
KT Pin Bar identifies the pin bar formation which is a type of price action pattern which depicts a sign of reversal or rejection of the trend. When combined with support and resistance, BRN and other significant levels, Pin Bar pattern proved to be a very strong sign of reversal. Basically, a pin bar is characterized by a small body relative to the bar length which is closed either in upper or lower 50% part of its length. They have very large wicks and small candle body. A pin bar candlestic
PipFinite Exit EDGE MT5
Karlo Wilson Vendiola
4.86 (29)
Did You Have A Profitable Trade But Suddenly Reversed? In a solid strategy, exiting a trade is equally important as entering. Exit EDGE helps maximize your current trade profit and avoid turning winning trades to losers. Never Miss An Exit Signal Again Monitor all pairs and timeframes in just 1 chart www.mql5.com/en/blogs/post/726558 How To Trade You can close your open trades as soon as you receive a signal Close your Buy orders if you receive an Exit Buy Signal. Close your Sell orders if
Trend Arrow Super The indicator does not redraw and does not change its data. Professional but very easy to use Forex system. The indicator gives accurate BUY\SELL signals. Trend Arrow Super is very easy to use, you just need to attach it to the chart and follow simple trading recommendations. Buy signal: Arrow + histogram in green color, enter immediately on the market to buy. Sell signal: Arrow + Histogram in red color, enter immediately on the market to sell.
Trend Follower   predicts the possible start of a trend, the indicator uses as a basis for the closing high possibility of the indicators to identify a possible entry or low possibility, the indicator just an entry parameter which can be the period . Input parameters Period : A positive integer that indicates the period for number Alert:   Sends an audible signal when a signal occurs Check out other products:   https://www.mql5.com/en/users/junioredj16/seller
DYJ BoS インジケーターは、次のような市場構造の変化の主な要素を自動的に識別してマークします。 構造のブレイクアウト (BoS): 価格が大きく変動し、構造の前のポイントを突破したときに発生します。 彼は上昇トレンドと下降トレンドの可能性のあるライン(UP と DN、つまり連続した新高値と新安値)をマークし、価格がこれらのラインを突破すると、赤(弱気)と緑(強気)の矢印でマークします。 BoS は通常、価格が以前の価格変動によって確立されたスイング安値または高値を決定的に突破したときに発生します。価格がスイング高値を上回ったりスイング安値を下回ったりすると、単に以前に形成された市場構造から抜け出すだけなので、「ブレイクアウト」構造と呼ばれます。これは多くの場合、市場センチメントとトレンドの方向の変化を示し、既存のトレンドの継続または新しいトレンドの始まりを示唆します。 ポジションのクローズの精度を高めるために、通常はストップロスとテイクプロフィットを設定しないことが推奨されます。最終ポジションは通常、同じ方向の次のブレイクスルー ポイント、または反対方向のブレイクスルー
This indicator uses the metaquotes ZigZag indicator as base to plot fibonacci extension and fibonacci retracement based in the Elliot waves. A fibonacci retracement will be plotted on every wave draw by the ZigZag. A fibonacci extension will be plotted only after the 2nd wave. Both fibonacci will be updated over the same wave tendency. Supporting until 9 consecutive elliot waves. Parameters: Depth: How much the algorithm will iterate to find the lowest and highest candles Deviation: Amount of
I just sell my products in Elif Kaya Profile , any other websites are stolen old versions, So no any new updates or support. - Lifetime update free -   Real price is 80$   - 25% Discount ( It is 59$ now ) Contact me for instruction, any questions! Related Product:  Gold Trade Expert MT5  ,  Professor EA - Non-repaint Introduction Flag patterns are an important tool for technical traders in the stock market. When interpreting a flag pattern, it is important to wait for the pattern to pick a d
Engulfing Pattern Indicator Introducing the Engulfing Pattern Indicator! Are you ready to take your trading strategy to the next level? The Engulfing Pattern Indicator is your ultimate tool to spot powerful market reversals and trends based on the time-tested Engulfing Candlestick Pattern. This indicator is crafted to provide you with actionable insights, but remember: it’s not optimized —you have the freedom to optimize it to suit your trading needs! Why the Engulfing Pattern? The E
This indicator finds Three Drives patterns. The Three Drives pattern is a 6-point reversal pattern characterised by a series of higher highs or lower lows that complete at a 127% or 161.8% Fibonacci extension. It signals that the market is exhausted and a reversal can happen. [ Installation Guide | Update Guide | Troubleshooting | FAQ | All Products ] Customizable pattern sizes Customizable colors and sizes Customizable breakout periods Customizable 1-2-3 and 0-A-B ratios It implements visual/s
One of the basic needs of every trader is to have a checklist to enter every position. Of course, using pen and paper may not be convenient forever. With this indicator, you can have a small checklist next to the screen for each of your charts and use it for better use in your trades. By pressing the r button, you can return everything to the original state. MT4 Version This indicator will have many updates and special settings will be added to it. You can contact us via Instagram, Telegram, Wh
Indicator for research and finding candle bars patterns real time. Options: Alerts - Enabling alerts Push - Enable push notifications BarInd - On which bar to look for patterns for notifications (1 - formed, 0 - forming) ID - Identifier. Appended to the names of graphic objects and to the message Formula - Formula. In the bar price formula: open1, high1, low1, close1, etc. (open0, high25... any number, 0 is also possible - low0, open0...). Counting bars from right to left from zero. You can use
このプロダクトを購入した人は以下も購入しています
Golden Trend Indicator MT5
Noha Mohamed Fathy Younes Badr
4.88 (16)
Golden Trend indicator  is The best indicator for predicting trend movement this indicator never lags and never repaints and never back paints    and give  arrow buy and sell    before the candle appear  and it will help you and  will make your trading decisions clearer its work on all currencies and  gold and crypto and all time frame This unique  indicator uses very secret algorithms to catch the  trends, so you can trade using this indicator and see the trend clear on charts  manual guide and
FX Levels: あらゆる市場における非常に高精度なサポート&レジスタンス 概要 通貨ペア、株式指数、個別銘柄やコモディティなど、どのような市場でも信頼できるサポートとレジスタンスを特定したいですか? FX Levels は伝統的な “Lighthouse” メソッドと先進的な動的アプローチを融合し、ほぼ汎用的な精度を実現します。ブローカーの実務経験を活かし、自動化されたデイリー更新とリアルタイム更新を組み合わせることで、 FX Levels は反転ポイントを見つけ、利益目標を設定し、自信をもってトレードを管理するための手助けをします。今すぐ試してみて、サポート/レジスタンス分析の正確性がどれほどトレードを向上させるかを実感してください! 1. FX Levels がトレーダーにとって非常に有用な理由 非常に正確なサポート&レジスタンスゾーン • FX Levels は異なるブローカー環境でもほぼ同一のゾーンを生成するよう設計されており、データフィードの差異や時刻設定のずれによる不一致を解消します。 • つまり、どのブローカーを利用していても一貫したレベルが得られるため、戦
FX Volume MT5
Daniel Stein
4.82 (17)
FX Volume:ブローカー視点で捉える本物の市場センチメント クイック概要 トレード手法をさらに高めたいとお考えですか? FX Volume は、リテールトレーダーやブローカーのポジション状況をリアルタイムで提供します。これは、COTのような遅延レポートよりもはるかに早く知ることができます。安定した利益を目指す方も、さらなる優位性を求める方も、 FX Volume は大きな不均衡を見極め、ブレイクアウトを確認し、リスク管理を洗練させるのに役立ちます。今すぐ始めて、実際の出来高データがどのように意思決定を変革するかを体感してください! 1. FX Volume がトレーダーにとって非常に有益な理由 高精度の早期警戒シグナル • 各通貨ペアを売買しているトレーダー数を、他者よりも早く、ほぼリアルタイムで把握できます。 • FX Volume は、複数のリテールブローカーから得られる本物の出来高データを収集し、分かりやすい形式で提供する 唯一 のツールです。 強力なリスク管理 • ロングやショートの大きな偏り(インバランス)を特定し、潜在的なトレンド転換を見逃しません。ストップ
FX Power: 通貨の強弱を分析して、より賢い取引を実現 概要 FX Power は主要通貨と金の実際の強弱をあらゆる市場状況で理解するための必須ツールです。強い通貨を買い、弱い通貨を売ることで、 FX Power は取引の意思決定を簡素化し、高い確率の取引機会を見出します。トレンドを追従する場合でも、極端なデルタ値を使用して反転を予測する場合でも、このツールはあなたの取引スタイルに完全に適応します。ただ取引するだけではなく、 FX Power で賢く取引をしましょう。 1. なぜ FX Power がトレーダーにとって非常に有益なのか 通貨と金のリアルタイム強弱分析 • FX Power は主要通貨と金の相対的な強弱を計算し、マーケットダイナミクスに関する明確な洞察を提供します。 • どの資産がリードしているか、または後れを取っているかを監視して、取引するペアを賢く選びましょう。 マルチタイムフレームの包括的なビュー • 短期、中期、長期のタイムフレームで通貨と金の強弱を追跡し、マーケットトレンドに基づいて取引戦略を調整できます。 • スキャルピングからスイングトレード
CBT Quantum Maverick 高効率バイナリーオプション取引システム CBT Quantum Maverickは、高いパフォーマンスとシンプルさを追求するトレーダー向けに設計されたバイナリーオプション取引システムです。カスタマイズの必要がなく、最適化された状態で使用を開始できます。シグナルに従うだけで、少しの練習でマスターできます。 主な特徴: シグナルの精度: 現在のローソク足を基に次のローソク足の取引シグナルを生成し、頻繁な再描画がありません。 多様な市場対応: バイナリーオプション取引に特化し、さまざまなブローカーや資産クラスに対応しています。 対応可能: Deriv Synthetic Charts :すべてのタイムフレームで使用可能。 OTCチャート :Quotex、PocketOption、Binomo、Stockity、IQOption、Exnova、OlympTrade、Deriv、Binolla、Homebrokerなどのブローカーに対応。MT5へのインポートは最初の1週間無料、その後は有料サービス。 FX、仮想通貨、商品市場 :幅広い資産利用が可能
TPSpro TREND PRO は 、市場を自動的に分析し、トレンドとその各変化に関する情報を提供し、再描画せずに取引にエントリーするためのシグナルを提供するトレンド指標です。 インジケーターは各ローソク足を使用し、個別に分析します。上向きまたは下向きのさまざまな衝撃を指します。通貨、仮想通貨、金属、株、指数の取引への正確なエントリーポイント! バージョンMT5                   インジケーターの完全な説明     RFI LEVELS インジケーター と併用することをお勧めします。 主な機能: レンダリングなしで正確な入力信号! シグナルが表示されると、それは関連性を維持します。これは、シグナルを提供してからそれを変更し、その結果、入金された資金が失われる可能性があるリドローインジケーターとの重要な違いです。より高い確率と精度で市場に参入できるようになりました。矢印が表示された後、ターゲットに到達する (利益確定) か反転シグナルが表示されるまで、ローソク足に色を付ける機能もあります。 STOP-LOSS/TAKE-PROFITゾーンの表示 エントリーポイントを
これはMT5のインジケーターで、再描画なしで取引に参入するための正確なシグナルを提供します。 外国為替、暗号通貨、金属、株式、インデックスなど、あらゆる金融資産に適用できます。かなり正確な見積もりを提供し、取引を開始して終了するのに最適な時期を教えてくれます。1つのシグナルを処理しただけでインジケーターの元が取れた例の 動画 (6:22)をご覧ください。Entry PointsPro インジケーターの助けを借りたほとんどのトレーダーの最初の1週間の結果が改善しています。 Telegramグループ に登録してください。Entry Points Proインジケーターのメリットは次の通りです。 再描画のないエントリーシグナル 再描画されるインジケーターでは一度表示されたシグナルが削除されて大きな金銭的損失につながることがありますが、これと異なり、表示されて確認されたシグナルは消えることがありません。 エラーなしの取引開始 インジケーターアルゴリズムによって取引を開始する(資産を売買する)理想的な瞬間を見つけることができます。それを使用するすべてのトレーダーの成功率が向上します。 あら
このダッシュボードは、選択されたシンボルの最新の利用可能なハーモニックパターンを表示するので、時間を節約し、より効率的に /   MT4バージョン 。 無料インジケーター:   Basic Harmonic Pattern インジケーター列 Symbol : 選択したシンボルが表示されます。 Trend :   強気または弱気 Pattern : パターンの種類(ガートレー、バタフライ、バット、カニ、サメ、サイファー、ABCD) Entry : エントリー価格 SL: ストップロス価格 TP1: 1回目の利食い価格 TP2: 2回目の利食い価格 TP3:   3回目の利食い価格 Current price :   現在値 Age (in bars):    最後に描画されたパターンの年齢 主な入力項目 Symbols:   "28 Major Currency Pairs "または "Selected Symbols "から選択。 Selected Symbols:   カンマで区切られた監視したいシンボル("EURUSD,GBPUSD,XAUUSD")。ブローカーがペアに接
Matrix Arrow Indicator MT5
Juvenille Emperor Limited
5 (13)
マトリックスアローインジケーターMT5は、すべてのシンボル/商品(外国為替、商品、暗号通貨、インデックス、株式)で使用できる100%再描画されていないマルチタイムフレームインジケーターに続くユニークな10in1トレンドです。マトリックスアローインジケーターMT5は、初期段階で現在のトレンドを判断し、最大10の標準インジケーターから情報とデータを収集します。 平均方向移動指数(ADX) 商品チャネルインデックス(CCI) クラシック平研アシキャンドル 移動平均 移動平均収束発散(MACD) 相対活力指数(RVI) 相対力指数(RSI) 放物線SAR ストキャスティクス ウィリアムズのパーセント範囲 すべてのインジケーターが有効な買いまたは売りシグナルを与えると、対応する矢印がチャートに印刷され、次のろうそく/バーの開始時に強い上昇トレンド/下降トレンドを示します。ユーザーは、使用するインジケーターを選択し、各インジケーターのパラメーターを個別に調整できます。マトリックスアローインジケーターMT5は選択されたインディケーターからのみ情報を収集し、それらのデータのみに基づいてアローを印刷
指示する     ロシア     -        utilizar con   el indicador の ESP 推奨事項 -   TPSpro トレンド プロフェッショナル版 -   MT5のバージョン 最も重要なことは、将来においても最も重要なことです。 機能のプリンシパル: ゾーンのほとんどは、ベンダーとコンプラドールによってアクティブ化されます。 状況を直感的に把握できるよう、初期の衝動を修正します。 LOGIC AI: MUESTRA zonas (círculos) parabuscar puntos de entrada cuando se activa una plantilla 視覚的に優れた視覚効果があり、最も重要な機能がすべて揃っていることに注意してください。 優れたニベレス/ゾーンの視覚化 (modo MTF) 世界で最も人気のある場所/ゾーンです。これを使用するのに最適な方法です (   TPSproTREND PRO   )。 アルゴリズム プロフェッショナル セパラド パソ ア パソ パラ オペラ それは、オペラハウスやコントラ・デ・エラの指導におい
Gartley Hunter Multi - An indicator for searching for harmonic patterns simultaneously on dozens of trading instruments and on all possible timeframes. Manual (Be sure to read before purchasing) | Version for MT4 Advantages 1. Patterns: Gartley, Butterfly, Shark, Crab. Bat, Alternate Bat, Deep Crab, Cypher 2. Simultaneous search for patterns on dozens of trading instruments and on all possible timeframes 3. Search for patterns of all possible sizes. From the smallest to the largest 4. All fou
Bill Williams Advanced is designed for automatic chart analysis using Bill Williams' "Profitunity" system. The indicator analyzes four timeframes at once. Manual (Be sure to read before purchasing) Advantages 1. Automatically analyzes the chart using the "Profitunity" system of Bill Williams. The found signals are placed in a table in the corner of the screen. 2. Equipped with a trend filter based on the Alligator indicator. Most of the system signals are recommended to be used only according t
今、147ドル(いくつかの更新後に499ドルに増加します) - 無制限のアカウント(PCSまたはMac) RelicusRoad ユーザー マニュアル + トレーニング ビデオ + プライベート Discord グループへのアクセス + VIP ステータス 市場の新しい見方 RelicusRoad は、外国為替、先物、暗号通貨、株式、および指数の世界で最も強力な取引インジケーターであり、トレーダーに収益を維持するために必要なすべての情報とツールを提供します。初心者から上級者まで、すべてのトレーダーが成功するためのテクニカル分析と取引計画を提供します。これは、将来の市場を予測するのに十分な情報を提供する重要な取引指標です。意味をなさないチャート上のいくつかの異なる指標ではなく、完全な解決策を信じています.これは、信号、矢印 + 価格アクション情報を表示するオールインワンのインジケーターで、他に類を見ない非常に正確です。 強力な AI に基づいて、RelicusRoad は不足している情報とツールを提供して、あなたを教育し、トレーディングのプロ、成功したトレーダーにします。 ほと
WHY IS OUR FXACCCURATE LS MT5 THE PROFITABLE ? PROTECT YOUR CAPITAL WITH RISK MANAGEMENT Gives entry, stop and target levels from time to time. It finds Trading opportunities by analyzing what the price is doing during established trends. POWERFUL INDICATOR FOR A RELIABLE STRATEGIES We have made these indicators with a lot of years of hard work. It is made at a very advanced level. Established trends provide dozens of trading opportunities, but most trend indicators completely ignore them! The
Quantum TrendPulse を ご紹介します。これは、   SuperTrend   、   RSI   、および Stochastic のパワーを 1 つの包括的なインジケーターに組み合わせて、取引の可能性を最大限に引き出す究極の取引ツールです。精度と効率を求めるトレーダー向けに設計されたこのインジケーターは、市場のトレンド、勢いの変化、最適なエントリー ポイントとエグジット ポイントを自信を持って特定するのに役立ちます。 主な特徴: SuperTrend 統合: 現在の市場動向に簡単に追従し、収益性の波に乗ることができます。 RSI精度: 買われすぎと売られすぎのレベルを検出し、市場の反転のタイミングに最適で、SuperTrendのフィルターとして使用されます。 確率的精度: 確率的振動を活用して、変動の激しい市場で隠れたチャンスを見つけます。SuperTrend のフィルターとして使用されます。 マルチタイムフレーム分析:   M5 から H1 または H4 まで、さまざまなタイムフレームで市場を常に把握します。 カスタマイズ可能なアラート: カスタム取引条件が満たされ
まず第一に、この取引インジケーターは再描画されず、再描画されず、遅延しないことを強調する価値があります。これにより、手動取引とロボット取引の両方に理想的なものになります。 ユーザーマニュアル:設定、入力、戦略。 アトミックアナリストは、価格の強さとモメンタムを利用して市場でより良いエッジを見つけるためのPA価格アクションインジケーターです。ノイズや誤ったシグナルを除去し、取引ポテンシャルを高めるための高度なフィルターを備えています。複雑なインジケーターの複数のレイヤーを使用して、アトミックアナリストはチャートをスキャンし、複雑な数学的計算をシンプルなシグナルと色に変換します。これにより、どのような初心者トレーダーでも理解して使用し、一貫した取引の決定を行うことができます。 「アトミックアナリスト」は、新規および経験豊富なトレーダー向けにカスタマイズされた包括的な取引ソリューションです。プレミアムインジケーターとトップノッチの機能を1つの取引戦略に組み合わせ、すべてのタイプのトレーダーにとって汎用性のある選択肢にします。 デイリートレーディングとスキャルピング戦略:高速で正確なデイ
TW Trend Scalper Indicator: TW Scalper Shootは、最新の取引戦略と人工知能技術を活用して、ユニークな取引体験を提供します。この製品は、スキャルパートレーダーの多様なニーズに応え、2つの異なる信号カテゴリを提供します。 今日、この優れた製品をテストして、トレンドスキャルパーになるためのユニークな体験を始めてください。 さらに、$37相当の製品をプレゼントとして受け取ります。 信号カテゴリ: 1. 長期および安全な信号:これらの信号は、プライスアクション戦略(スマートマネールール)、フィボナッチレベル、サポートおよびレジスタンスレベル、移動平均線を使用して特定されます。このカテゴリの信号は、赤と青の矢印および特定のターゲットで表示され、長期的で信頼性のある取引を求めるトレーダーに最適です。 2. スキャルピング信号(プロフェッショナルスキャルパー向け):前述の戦略に加えて、これらの信号は独自のTrade Wizards指標フォーミュラとAIノイズ除去方法も利用します。スキャルピング信号は、信頼できるトレンドの白い矢印で第一カテゴリの信
Gannスクエアインジケーターは、W.D. Gannによって執筆された「市場予測のための数学的な式」の記事に基づく強力な市場分析ツールです。このツールは、解析に数学的な概念を応用し、Gann理論に基づいています。それは、144、90、52のスクエアや9のスクエアなど、Gannの関連テクニックの要素を取り入れています。さらに、の方法を組み込んでおり、9のスクエアとその関連性についてのチャネルやスターパターンに焦点を当てています。 ユーザーマニュアルと使用方法: このインジケーターを使用する前に、ユーザーマニュアルを読んで疑問点を解決するためにお問い合わせいただくことをお勧めします。ユーザーマニュアルの完全版は、当社のウェブサイトで入手できます。 MT5の完全版は購入できますし、MT4の無料版も試すことができます。両方のバージョンへのリンクを提供していますので、ご利用ください。 主な機能と機能: Gannスクエアインジケーターは、市場分析のための完全なツールセットを提供し、幾何学的な概念とGann理論に基づいて的確な判断を行う手助けをします。以下に主な機能を示します。 9のスクエアの分析:
This Indicator creates a heatmap based on depth of market of the current symbol or another symbol. Other symbol is useful when you trade futures market and a contract has 'mini' and 'full' split. For example, in Brazil (B3 - BMF&Bovespa), WDO and DOL are future Forex contract of BRL/USD (where 1 DOL = 5 WDO) and big banks work mostly with DOL (where liquidity is important). Please use with M1 timeframe , objects are too small to be displayed at higher timeframes (MT5 limit). The number of level
Berma Bands
Muhammad Elbermawi
5 (3)
Berma Bands (BBs) インジケーターは、市場のトレンドを特定して活用したいトレーダーにとって貴重なツールです。価格と BBs の関係を分析することで、トレーダーは市場がトレンド段階にあるか、レンジ段階にあるかを判断できます。 詳細については、[ Berma Home Blog ] をご覧ください。 バーマ バンドは、上部バーマ バンド、中部バーマ バンド、下部バーマ バンドの 3 つの異なる線で構成されています。これらの線は価格の周りにプロットされ、全体的な傾向に対する価格の動きを視覚的に表します。これらのバンド間の距離から、ボラティリティや潜在的な傾向の反転についての洞察を得ることができます。 バーマ バンドの線がそれぞれ離れると、市場が横ばいまたはレンジ相場の期間に入っていることを示すことがよくあります。これは、明確な方向性の偏りがないことを示しています。トレーダーは、これらの期間中にトレンドを特定するのが難しいと感じる可能性があり、より明確なトレンドが出現するまで待つ場合があります。 バーマ バンドの線が 1 本の線に収束すると、強いトレンド環境の兆候となること
ご紹介     Quantum Breakout PRO は 、ブレイクアウト ゾーンの取引方法を変革する画期的な MQL5 インジケーターです。 13年以上の取引経験を持つ経験豊富なトレーダーのチームによって開発されました。     クォンタム ブレイクアウト プロ   は、革新的でダイナミックなブレイクアウト ゾーン戦略により、あなたのトレーディングの旅を新たな高みに押し上げるように設計されています。 クォンタム ブレイクアウト インジケーターは、5 つの利益ターゲット ゾーンを備えたブレイクアウト ゾーン上のシグナル矢印と、ブレイクアウト ボックスに基づいたストップロスの提案を提供します。 初心者トレーダーにもプロのトレーダーにも適しています。 量子EAチャネル:       ここをクリック 重要!購入後、インストールマニュアルを受け取るためにプライベートメッセージを送ってください。 推奨事項: 時間枠: M15 通貨ペア: GBPJPY、EURJPY、USDJPY、NZDUSD、XAUUSD アカウントの種類: ECN、Raw、またはスプレッドが非常に低い R
After your purchase, feel free to contact me for more details on how to receive a bonus indicator called VFI, which pairs perfectly with Easy Breakout for enhanced confluence!     Easy Breakout MT5   is a powerful price action trading system built on one of the most popular and widely trusted strategies among traders: the   Breakout strategy ! This indicator delivers crystal-clear Buy and Sell signals based on breakouts from key support and resistance zones. Unlike typical breakout indicators
Quantum平均足PRO のご紹介 市場のトレンドに対する明確な洞察を提供するように設計された平均足キャンドルは、ノイズを除去し、誤ったシグナルを排除する能力で知られています。混乱を招く価格変動に別れを告げ、よりスムーズで信頼性の高いチャート表現を導入しましょう。 Quantum Heiken Ashi PRO を真にユニークなものにしているのは、従来のローソク足データを読みやすい色のバーに変換する革新的なフォーミュラです。赤と緑のバーはそれぞれ弱気トレンドと強気トレンドをエレガントに強調し、潜在的なエントリーポイントとエグジットポイントを驚くほど正確に見つけることができます。 量子EAチャネル:       ここをクリック MT4のバージョン:       ここをクリック この注目すべき指標には、いくつかの重要な利点があります。 明確性の向上: 価格変動を平滑化することで、平均足バーは市場トレンドをより明確に表現し、有利な取引機会を特定しやすくします。 ノイズの削減: 誤ったシグナルを引き起こすことが多い不安定な価格変動に別れを告げます。 Quantum Heiken As
現在33%オフ 初心者にもエキスパートトレーダーにも最適なソリューション このインジケーターは独自の機能と新しい公式を多数内蔵しており、ユニークで高品質かつ手頃な取引ツールです。このアップデートでは、2つの時間枠ゾーンを表示できるようになります。より長いTFだけでなく、チャートTFとより長いTF(ネストゾーンを表示)の両方を表示できます。すべてのSupply Demandトレーダーの皆さんのお気に召すはずです。:) 重要情報の公開 Advanced Supply Demandの可能性を最大化するには、 https://www.mql5.com/ja/blogs/post/720245 にアクセスしてください。   エントリーまたはターゲットの正確なトリガーポイントを正確に特定できれば取引がどのように改善されるか想像してみてください。新しい基盤となるアルゴリズムに基づいて構築されているため、買い手と売り手の間の潜在的な不均衡をさらに簡単に特定できます。これは、最も強い需要と供給のゾーンと、過去のパフォーマンス(古いゾーンを表示)がグラフィカルに表現されるためです。これらの機能は、最適な
Extreme  Breakout Signal   is a trading strategy based on price breaking through key support or resistance levels. It indicates potential trend shifts, allowing traders to capture new upward or downward movements. Parameter extreme radius:   extreme radius( Different parameters can be set for different periods ) Key Principles Support & Resistance : Prices often reverse near these levels; breaking them may signal a new trend. Confirmation : Use volume or other indicators to verify the breakout's
Golden Spikes Detector
Batsirayi L Marango
3.25 (4)
Golden Spikes Detector This indicator is based on an advanced strategy primarily for trading spikes on Boom and Crash Indices. Complex algorithms were implemented to detect high probability entries only. It alerts on potential Buy and Sell entries. To trade spikes on the Deriv or Binary broker, only take Buy Boom and Sell Cash alerts. It was optimised to be loaded on 5-minute timeframe although multiple timeframe analysis is done in the background. Features ·             Desktop pop up and sound
KT Renko Patterns scans the Renko chart brick by brick to find some famous chart patterns that are frequently used by traders across the various financial markets. Compared to the time-based charts, patterns based trading is easier and more evident on Renko charts due to their uncluttered appearance. KT Renko Patterns features multiple Renko patterns, and many of these patterns are extensively explained in the book titled Profitable Trading with Renko Charts by Prashant Shah. A 100% automated
BUY INDICATOR AND GET EA FOR FREE AS A BONUS + SOME OTHER GIFTS! ITALO VOLUME INDICATOR  is the best volume indicator ever created, and why is that? The Indicator works on all time-frames and assets, indicator built after 7 years of experience on forex and many other markets. You know many volume indicators around the internet are not complete, does not help, and it's difficult to trade, but the Italo Volume Indicator is different , the Italo Volume Indicator shows the wave volume, when market
まず第一に、このトレーディングシステムがノンリペイント、ノンリドロー、ノンラグのインジケーターであることを強調する価値がある。これにより、手動取引とロボット取引の両方に理想的なものになっています。 オンラインコース、マニュアル、プリセットのダウンロード。 「スマートトレンドトレーディングシステム MT5」は、新規および経験豊富なトレーダー向けにカスタマイズされた包括的なトレーディングソリューションです。10以上のプレミアムインジケーターを組み合わせ、7つ以上の堅実なトレーディング戦略を備えており、多様な市場状況に対応する多目的な選択肢となっています。 トレンドフォロー戦略:トレンドを効果的に乗り越えるための正確なエントリーとストップロス管理を提供します。 リバーサル戦略:潜在的なトレンドの反転を特定し、トレーダーがレンジ相場を活用できるようにします。 スキャルピング戦略:高速で正確なデイトレードおよび短期取引のために設計されています。 安定性:すべてのインジケーターはノンリペイント、ノンリドロー、ノンラグであり、信頼性の高いシグナルを保証します。 カスタマイズ:個々の取引の嗜好に合わせ
Royal Scalping Indicator is an advanced price adaptive indicator designed to generate high-quality trading signals. Built-in multi-timeframe and multi-currency capabilities make it even more powerful to have configurations based on different symbols and timeframes. This indicator is perfect for scalp trades as well as swing trades. Royal Scalping is not just an indicator, but a trading strategy itself. Features Price Adaptive Trend Detector Algorithm Multi-Timeframe and Multi-Currency Trend Low
作者のその他のプロダクト
SimpleProb
Augusto Martins Lopes
SimpleProb: Your New Ally in the Financial Market! Are you tired of complicated indicators that confuse more than they help? Introducing SimpleProb, the indicator that brings simplicity and efficiency to your operations on MetaTrader 4!Are you tired of complicated indicators that confuse more than they help? Introducing SimpleProb, the indicator that brings simplicity and efficiency to your operations on MetaTrader 4! What is SimpleProb? SimpleProb is a technical analysis indicator developed f
Transform Your Trading with the Ultimate Bollinger Bands Expert Advisor! Are you tired of trading strategies that don't deliver consistent results? Introducing the   Ultimate Bollinger Bands Expert Advisor   – the ultimate tool for traders looking to maximize profits and minimize risks. Key Features: Accurate Signals:   Utilizes the renowned Bollinger Bands strategy to identify high-probability trading opportunities. Intelligent Risk Management:   Protect your capital with advanced risk manageme
Volume Traders
Augusto Martins Lopes
VolumeTrader - MetaTrader 4用の高度なエキスパートアドバイザー ボリュームとRSI分析で利益を最大化! パターンを手動で探して市場のチャンスを逃していませんか?VolumeTraderはあなたが探している解決策です!この高度なエキスパートアドバイザー(EA)は、取引量と相対力指数(RSI)の2つの最も強力な市場指標に基づいて取引機会を特定するために設計されています。 主な特徴: ボリューム分析:   EAは各バーの買いと売りのボリュームを監視し、トレンドを特定し、より正確な取引を行います。 インテリジェントなRSI戦略:   極端な市場状況での取引を避け、RSIが良い機会を示すときにのみポジションを開きます(買われすぎと売られすぎ)。 動的リスク管理:   EAはATRを使用してストップロスを動的かつ調整可能に計算し、取引の精度と安全性を高めます。 カスタマイズ可能な設定:   パラメータを簡単に調整して、取引スタイルに合わせることができます(ロットサイズ、スリッページ、RSIレベルなど)。 ボリュームトレンドに従うか逆らうかのオプション:   ボリュームトレ
New Support and Resistance Indicator with Probabilities and Alerts Description:  Maximize your profits with the newest Support and Resistance indicator! Our indicator automatically calculates support and resistance levels based on 24-hour analysis periods and provides detailed probabilities for each level. Additionally, you can set up custom alerts to be notified when the price touches specific levels, directly on your mobile device. Features: Support and resistance analysis based on hourly data
Here's the English version of the marketing content for the Heat Map Indicator: # Heat Map Indicator - Advanced Volume Analysis **Introducing the Heat Map Indicator - A Professional Tool for Market Volume Analysis!** ### Key Features 1. **Visual Heat Map** - Instant volume intensity visualization through colors - Blue: Low volume - Green: Medium volume - Yellow/Orange: Increasing volume - Red: Intense volume 2. **Intuitive Interface** - Dynamic color scale - Real-time percentage indicat
Heat Map Indicator - Advanced Volume Analysis Introducing the Heat Map Indicator - A Professional Tool for Market Volume Analysis! **Key Features** **Visual Heat Map** - Instant volume intensity visualization through colors - Blue: Low volume - Green: Medium volume - Yellow/Orange: Increasing volume - Red: High volume **Intuitive Interface** - Dynamic color scale - Real-time percentage indicator - Current level indicator - Customizable colors and transparency **Smart Alert System** - Custo
フィルタ:
レビューなし
レビューに返信