• 概要
  • レビュー
  • コメント

High Low Predict

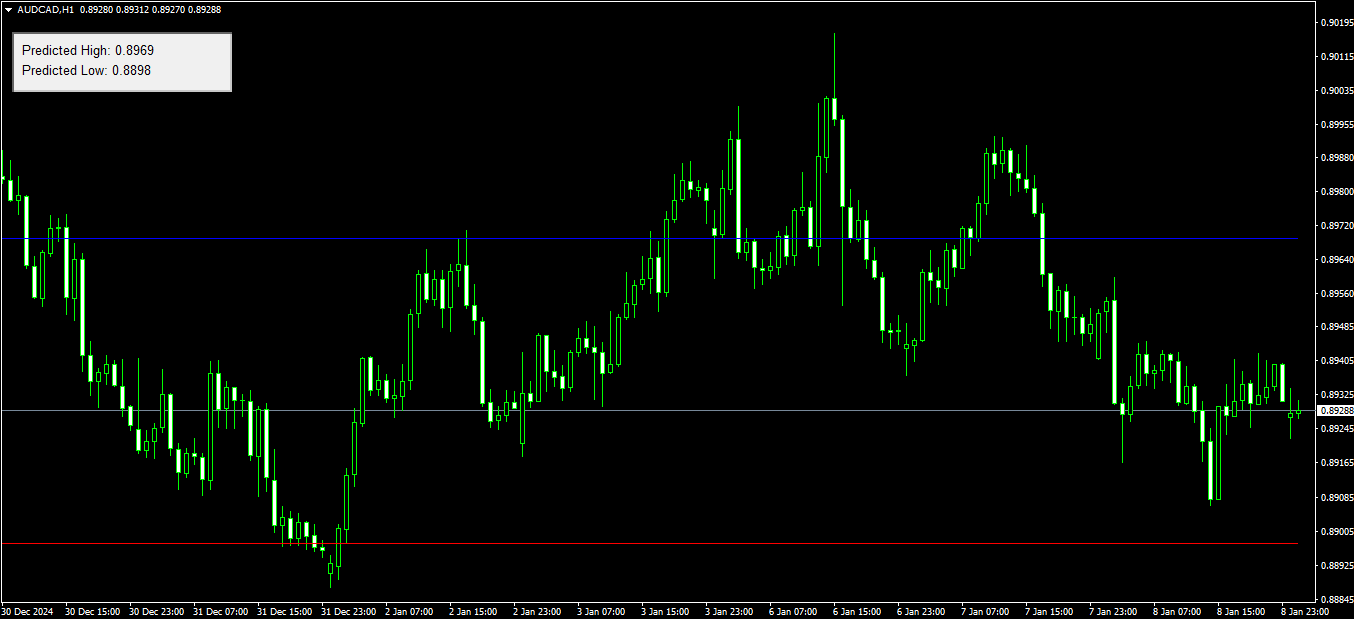
This indicator is designed to help you forecast the potential high and low prices for the current trading day, based on the high and low of the previous day. It does this by applying a customizable percentage increase or decrease to those levels.

How It Works:

The idea is simple: It looks at the previous day's high and low prices and then adjusts them by a percentage you choose. Here's what that means:

  • Predicted High: This is calculated by taking the high price of the previous day and adding a percentage increase to it.
  • Predicted Low: This is calculated by taking the low price of the previous day and subtracting a percentage decrease from it.

Let's say the high of the previous day was 1.2000, and the low was 1.1800. If you set the Predicted High Percentage and Predicted Low Percentage both to 0.1%:

  • The Predicted High will be calculated as:
    • 1.2000 + (1.2000 * 0.1%) = 1.2000 + 0.0012 = 1.2012.
  • The Predicted Low will be calculated as:
    • 1.1800 - (1.1800 * 0.1%) = 1.1800 - 0.0012 = 1.1788.

These levels are what the indicator shows you for the current day, and they serve as possible boundaries for price movement.

How to Use the Indicator:

  1. Set the Percentages: The key part is setting the right percentage for the predicted high and low. Typically, if the market is calm, you'd use smaller percentages. For a more volatile market, you might go higher.

  2. Apply the Indicator: Once the indicator is applied, it will display the predicted high and low levels for the day. You’ll use these levels to anticipate where the price might go.

  3. Monitor Price Action:

    • If the price approaches the predicted high, it might suggest the price is trending upwards, and you might see more bullish movement.
    • If the price is near the predicted low, it could indicate a bearish move.
  4. Adjust for Market Conditions: If there’s big news or market volatility, you may need to tweak the percentage values. More news-driven days usually mean larger price swings, so increasing the percentages would help.

Example Use:

  • Range Trading: If you think the price is going to stay within a certain range, use the predicted high and low levels as your guide. For instance, if the price reaches the predicted high, it might be a good point to sell, expecting the price to fall back down. Similarly, if the price hits the predicted low, it could be a good time to buy.

  • Breakout Trading: If the price breaks above the predicted high, you might enter a buy trade, expecting the price to keep going up. If the price breaks below the predicted low, it might be time to sell.

Stop Loss and Take Profit:

You can also use the predicted high and low to set your Stop Loss and Take Profit levels:

  • For a buy order, set your Stop Loss just below the predicted low and your Take Profit near the predicted high.
  • For a sell order, set your Stop Loss just above the predicted high and your Take Profit near the predicted low.

How to Choose the Right Percentage:

Choosing the right percentage depends on how volatile you think the market will be. You want the percentages to reflect expected market behavior:

  • If you’re trading in a calm market, keep the percentages low.
  • If you’re expecting higher volatility (e.g., during major news events), increase the percentage.

Why Use It?

This indicator can be useful for predicting price levels based on recent price action. It gives you a clear range to work within, helping you make informed decisions about where to place trades. You can use it for a variety of strategies, whether you're range trading, breakout trading, or setting your risk levels.

But remember, like any tool, it's not perfect. It’s based on past price data, so it doesn't account for sudden market shifts. Always use this indicator alongside other analysis tools to increase your chances of success


おすすめのプロダクト
Signal Eskiya, in addition to channel lines, reflects entry signals in the form of arrows. Trading strategies using the channel indicator belong to the classic methods of technical analysis, are easy to execute, and therefore available even to beginners. Price ranges work equally well on any trading assets and timeframes, they can be used both independently and with additional confirmation from oscillators and market volumes. American traders say: “Trend is your friend”, which means “Trend is
The indicator allows you to instantly determine the current trend by color and FIBO levels. Higher Timeframe the panel shows the current trend of higher periods, helping to determine the strength of the trend Trade according to the trend when changing the color of candles or trade against the trend when the price hit the extreme levels of the   FIBO Trend PRO  indicator     Advantages of the FIBO Trend PRO Indicator never repaint and does not change their values Very easy to use and intuitive
FREE
Introduction In the fast-paced world of financial market trading, success often hinges on the ability to spot and leverage trends. Among the various strategies available, momentum trading stands out as a powerful tool for traders seeking to capitalize on market movements. In this article, we will delve into the concept of momentum, its significance in trading, and the numerous benefits it offers to traders. What is Momentum? Momentum in trading refers to the tendency of assets to continue moving
Trend Divergence Indicator: Your Essential Tool for Market Analysis The Trend Divergence Indicator is a powerful tool designed to assist traders in identifying market trends and pinpointing entry points with precision. By leveraging price divergence, this indicator enhances your trading strategy, offering reliable insights and filtering unnecessary signals. Key Features and Benefits of the Trend Divergence Indicator Accurate Trend Analysis: The Trend Divergence Indicator uses price divergence t
Pivot Points is used by traders to objectively determine potential support and resistance levels. Pivots can be extremely useful in Forex since many currency pairs usually fluctuate between these levels. Most of the time, price ranges between R1 and S1. Pivot points can be used by range, breakout, and trend traders. Range-bound Forex traders will enter a buy order near identified levels of support and a sell order when the pair nears resistance. But there are more one method to determine Pivot p
OBTE = Order Block Type I OBTI Indicator MT4 is the most accurate and customizable indicator on the market. It was developed to facilitate the analysis of operations based on candlestick patterns and supply-demand zones. These zones are possible movement reversal points. For this indicator is generated by the order block of smart money concept. Input parameters: 1. Multiple timeframes : M1 M5 M15 M30 H1 H4 D1 W1 MN1 2. Default input: H1 H4 D1 W1 MN1 3. Notifications / Send Emails / Notification
I recommend you to read the   product's blog  (manual) from start to end so that it is clear from the beginning what the indicactor offers. This multi time frame and multi symbol supply and demand zone dashboard indicator sends alerts when the price has reached a supply/demand zone. It is also possible to use it to be alerted about regular double tops/bottoms instead of zones. It can be used with all time frames from M1 to MN. It is possible to use RSI, divergence (MACD, OsMA, RSI or Awesome) a
The Transition Trend indicator shows the points of potential market reversal. The indicator's smart algorithm detects the trend, filters out market noise and generates entry signals and exit levels. Simple, visual and efficient trend detection. Uses just one parameter for settings. The indicator does not redraw and does not lag. You can set up message alerts as sound or email. Works on all currency pairs and all timeframes. Ready-made trading system.
The indicator draws trend lines based on Thomas Demark algorithm. It draws lines from different timeframes on one chart. The timeframes can be higher than or equal to the timeframe of the chart, on which the indicator is used. The indicator considers breakthrough qualifiers (if the conditions are met, an additional symbol appears in the place of the breakthrough) and draws approximate targets (target line above/below the current prices) according to Demark algorithm. Recommended timeframes for t
Colored indicator of the linear channel based on the Fibonacci sequence. It is used for making trading decisions and analyzing market sentiment. The channel boundaries represent strong support/resistance levels, as they are the Fibonacci proportion levels. Users can select the number of displayed lines of channel boundaries on the chart by means of the input parameters. Attaching multiple instances of the indicator to the chart with different calculation periods leads to displaying a system of c
Precision Channel Indicator: Master the Market with Ease! Description : The Precision Channel Indicator is a powerful tool designed to help you better understand market trends and identify the optimal entry and exit points. With its intuitive channel visualization, you can easily spot price ranges and make smarter trading decisions. Key Features : Clear Channel Visualization: Instantly identify key support and resistance areas in the market. Efficient Trading Signals: Pinpoint critical buy and s
FREE
Master Phi is an indicator based on Fibonacci numbers. It analyzes the percentage values returning the proportion of the Golden Section. You can customize values and set custom levels so you will create your personal Trading. The attention on the minimums and the maximums of timeframes allows accurate analysis in order to intercept very precisely the trading levels after the various impulse movements. Input Values Time_Frame to analyze LEVELS SETTINGS 9 levels (in percentage) 9 colors LINE SETT
The Multi MA Trend Change MT4 indicator is designed to help traders identify and capitalize on trend shifts with precision. By monitoring multiple moving averages, it highlights areas where trends are either gaining strength or beginning to reverse. This makes it an excellent tool for spotting early trend changes and anticipating market movements before they become apparent. The indicator excels in identifying potential retracement entries, ensuring that traders can catch pullbacks during establ
My Point MT4
Claudia Ramona Angerer
4 (1)
Diagnosis of major and minor pivot Trend detection with many signals Can be used in all symbols Can be used in all time frames Settings: Back Show: The number of candles it displays If you need any adjustments, or have any questions or suggestions, message me How to trade: Blue: sell signal Red: buy signal Blue and red at the same time: no signal Exit signal: Opposite signal
This is a simple and efficient indicator based on market logic. The indicator creates a range chosen by a trader. Trader selects only two parameters. The first one is the number of candles that define the frame. The second one is the number of candles needed for confirmation frame. The indicator shows all situations in history and works with the actual movement of the market. The indicator works on all timeframes . You are not limited by use of different timeframes, the indicator is able to adap
Description Better version of RSI indicator which offer a complete visual trading strategy and realize an auto-optimization Support:   We create great tools for the entire trading community. Most of them are free. If you believe in what we do  Support Us Here.   KEY LINKS:   How to Install  –  Frequent Questions  -  All Products  How is this indicator useful? NEVER repaints. Detect best parameters of RSI indicator, based on profit factor during the specified period. This indicator can be used as
Moving pivot Average Fibonacci The  indicator compares the selected period with its counterpart from the previous period. The indicator determines the moving Fibonacci levels for the day or any time interval to assess the price movement range from the time average. The indicator helps predict the expected high or low for the day based on historical time data. The pivot line can be considered an average trend line and use it in a variety of trading strategies. If you have any question about the
Description ABC Trend Levels is an indicator that identifies market trends and important trend support and resistance levels. Recommendations You can use this indicator to determine the trend and, accordingly, to determine the direction of opening a position or closing an opposite position. Parameters ===== _INDICATOR_SETTINGS_ ===== - indicator settings Maximum History Bars - maximum number of history bars for calculating the indicator. Average True Range Period - ATR indicator period (us
TitanVision indicator is a versatile technical analysis tool that helps traders identify market trends and potential entry and exit points. It features a dynamic Trend Catcher Strategy, adapting to market conditions for a clear visual representation of trend direction and various trend reversal points. Traders can customize the parameters according to their preferences. The indicator helps in identifying trends, signals possible reversals, acts as a trailing stop mechanism and provides real-tim
TRENDIEST TREND LINE   ️️️️️ Do you want to become a constantly profitable 5-star forex trader? ️️️️️ Trendiest Trend Line is a one of a kind trend line indicator, Trend lines work until the market reverses or consolidates. Easily stay out of the chop and stay in the long trends! Key Features of Trendiest Trend Line Stay in strong trends longer with confidence Clearly shows you when the market is ranging to save you money Entry signals help you get in at a good price 100% reliable re
Description of Using the Dynamic HL Breakouts Indicator The Dynamic HL Breakouts indicator is a technical tool designed for trading trend-following assets. Its main purpose is to help traders identify key entry and exit points during strong trending periods of an asset. Components of the Dynamic HL Breakouts Indicator Highs and Lows This indicator calculates and displays the High and Low values for a specified period (e.g., the past 20 days) to create a price movement range for the asset. These
The Wamek Support and Resistant (WSR) Indicator is a remarkable tool that stands out in the world of technical analysis. It sets itself apart by cleverly combining price action and leading indicators to delineate support and resistance levels with a high degree of accuracy. Its unique feature is its adaptability; users can fine-tune the indicator by adjusting input parameters, enabling them to create customized support and resistance levels that suit their trading strategies. Notably, one of WSR
Mini FFMV Dashboard and CSM
Opengates Success International
1 (1)
Mini Forex Market-View Dashboard and Mini-CSM Mini Full Forex Market View Dashboard is a miniature creation of FULL FOREX MARKET_VIEW Custom indicator created to give the Traders a full view of what is going on in the market but in a partial matter to make it conscise. It is useful most especially for those who don't like bogus indicators or those who have a PC with limited screen size. It uses a real time data to access the market and display every bit of information needed to make a successful
This system never paints.   This system created by using Envolpes bands and reverse bar count.   This indicator is only working in M5 period.   This system is for long term and profitable.   Signals are shown as arrows. as an optional limit orders.   You can set a voice alarm or email notification.   You can fins our other products from link : https://www.mql5.com/en/users/drbastem/seller   Also, you can ask all your questins from email : haskayafx@gmail.com or mobile : +90 530 867 5076 or @Meh
Wave Synchronizer は、波動分析の視覚的なインジケーターです。ローソク足の動きのシーケンスを組み合わせて方向性のある波を構築し、市場と同期した動きを生み出します。 各波の始まりはシグナル矢印で始まり、アラートもあります。 インジケーターは、以前の履歴の矢印を再描画したり移動したりすることはありません。 シグナル矢印は、ローソク足の終値に表示されます。 あらゆる取引商品や時間枠で動作するように適応します。 使いやすく設定も簡単で、入力パラメーターは 2 つだけです。選択したパラメーターで使用する時間枠の選択と、MA ラインの計算方法です。 推奨パラメーターは 1 ~ 2 期間シフトできます。 取引資産を購入する場合は矢印の方向が赤になります。 取引資産を売却する場合は矢印の方向が青になります。
This indicator is meant for Harmonic Traders, it helps them in identifying the formed patterns by analyzing the market past data, looking for Harmonic Patterns. The Patterns that this indicator can detect are: AB=CD Butterfly Gartely Crab Bat The indicator shows the following: The completed pattern, with the critical zone highlighted in Gray box The suggested 3 take profit levels (in green) The Suggested Stop Loss level (in Red) The formed pattern ratios can be checked by hovering the mouse on t
このインジケーターは実践的なトレードに最適な自動波動分析のインジケーターです! 場合... 注:   Tang Lun (Tang Zhong Shuo Zen) の命名規則の影響で、私は波のグレーディングに西洋の名前を使用することに慣れていません。基本的な波を ペン 、二次波のバンドを セグメント と名付けました。同時に、 セグメント にはトレンドの方向が指定されます (この命名方法は将来のノートで使用されます。最初に言っておきます)。ただし、アルゴリズムは曲がりくねった理論とはほとんど関係がないため、付けるべきではありません。これは、私の市場分析 によって要約された、絶えず変化する複雑な運用ルール を反映しています。 バンドは標準化され、人によって異なることがないよう定義されており、市場参入を厳密に分析する上で重要な役割を果たす人為的な干渉の描画方法が排除されています。 このインジケーターを使用することは、取引インターフェイスの美しさを改善することと同等であり、元の K ライン取引を放棄し、取引の新しいレベルに連れて行きます。また、宣伝の観点から顧客の認識も向上します。 イ
This product shows you a different view of the market by examining the performance of volume and continuous patterns in the market, then by calculating the behavior of traders and market patterns, calculates the probability of the next movement of the market by calculations. Function. How to receive the signal: If the candlestick is currently a bullish candlestick, according to a market scan, if the next bullish candlestick is below 5%, you can open a free trade by hitting the wisdom areas.
Indicador de Fibonacci Semanal para MT4 Maximize suas operações no mercado financeiro com o Indicador de Fibonacci Semanal para MetaTrader 4 (MT4) , a ferramenta essencial para traders que buscam identificar pontos estratégicos de suporte e resistência com base na ação do preço da última semana. Principais Recursos: Atualização Automática : O indicador recalcula os níveis de Fibonacci automaticamente a cada novo candle semanal. Níveis Personalizados : Traça apenas os níveis essenciais de Fibonac
For this set of indicators 1. General information     - Calculates with high performance mathematical algorithms.     - Calculated from the price of candles     - The entry point of this order is filtered by the train EMA and the oscillator.     - Calculate the integrity of the candle 2. How does it work?     - You can see two types of order entry points: the notification on the monitor and the arrow.     - You can trust 75-95 percent of this entry point. 3. Settings     - A complete candle i
このプロダクトを購入した人は以下も購入しています
Gann Made Easy は、ミスター・ギャンの理論を使用した取引の最良の原則に基づいた、プロフェッショナルで使いやすい外国為替取引システムです。 W・D・ガン。このインジケーターは、ストップロスとテイクプロフィットレベルを含む正確な買いと売りのシグナルを提供します。 PUSH通知を利用して外出先でも取引可能です。 購入後はご連絡ください!私の取引のヒントと素晴らしいボーナスインジケーターを無料で共有します! おそらく、ギャンの取引手法についてはすでに何度も聞いたことがあるでしょう。通常、ギャンの理論は初心者のトレーダーだけでなく、すでにある程度の取引経験がある人にとっても非常に複雑なものです。なぜなら、ギャンの取引手法は理論的にはそれほど簡単に適用できるものではないからです。私はその知識を磨き、最良の原則を私の外国為替インジケーターに組み込むために数年を費やしました。 このインジケーターは非常に簡単に適用できます。必要なのは、それをチャートに添付し、簡単な取引推奨事項に従うだけです。このインジケーターは常に市場分析の仕事を行い、取引の機会を探します。適切なエントリーポイントを検出
NOTE: CYCLEMAESTRO is distributed only on this website, there are no other distributors. Demo version is for reference only and is not supported. Full versione is perfectly functional and it is supported CYCLEMAESTRO , the first and only indicator of Cyclic Analysis, useful for giving signals of TRADING, BUY, SELL, STOP LOSS, ADDING. Created on the logic of Serghei Istrati and programmed by Stefano Frisetti ; CYCLEMAESTRO is not an indicator like the others, the challenge was to interpret only t
Gold Stuff
Vasiliy Strukov
4.87 (262)
Gold Stuff は、金専用に設計されたトレンド指標であり、あらゆる金融商品にも使用できます。 インジケーターは再描画せず、遅れません。 推奨時間枠 H1. それインディケータでフルオートExpert Advisor EA Gold Stuffが動作します。 あなたは私のプロフィールでそれを見つけることができます. 設定と個人的なボーナスを得るために、購入後すぐに私に連絡してください! トレンド スキャナーの強力なサポートを利用して、無料のインジケーターを入手し、プライバシーを守ります。あーみー!   設定 矢印を描く - オンオフ。 チャートに矢印を描く。 アラート - 可聴アラートのオンオフ。 メール通知 - オンオフ。 電子メール通知。 プチ通知 - オンオフ。 プッシュ通知。 次に、色域を調整します。 Gold Stuff は、金専用に設計されたトレンド指標であり、あらゆる金融商品にも使用できます。 インジケーターは再描画せず、遅れません。 推奨時間枠 H1. それインディケータでフルオートExpert Advisor EA Gold Stuffが動作します。
Pairs Trading Dashboard - Spearman Correlation and Stationary Z-Score : Your Ultimate Trading Dashboard for Precision Pairs Trading Pairs Trading Dashboard - Spearman Correlation and Stationary Z-Score is a state-of-the-art MetaTrader 4 (MT4) dashboard indicator crafted to revolutionize pairs trading. This powerful tool combines Spearman Rank Correlation, Z-Score analysis, and stationarity testing into an intuitive dashboard, empowering traders to identify and act on high-probability trading opp
!SPECIAL SALE! An exclusive indicator that utilizes an innovative algorithm to swiftly and accurately determine the market trend. The indicator automatically calculates opening, closing, and profit levels, providing detailed trading statistics. With these features, you can choose the most appropriate trading instrument for the current market conditions. Additionally, you can easily integrate your own arrow indicators into Scalper Inside Pro to quickly evaluate their statistics and profitability
Trend Screener
STE S.S.COMPANY
4.78 (93)
トレンドインジケーター、1つのツールに組み込まれたすべての重要なトレンド機能を備えたトレンドトレーディングとフィルタリングのための画期的なユニークなソリューション! これは、すべてのシンボル/商品(外国為替、商品、暗号通貨、インデックス、株式)で使用できる100%再描画されていないマルチタイムフレームおよびマルチ通貨インジケーターです。 期間限定オファー: サポートおよびレジスタンス スクリーナー インジケーターは、たった 50 ドルで永久的にご利用いただけます。(元の価格 250 ドル) (オファー延長) トレンドスクリーナーは、チャート内のドットで矢印トレンドシグナルを提供するインジケーターに続く効率的なインジケーターです。 トレンド分析インジケーターで使用できる機能: 1.トレンドスキャナー。 2.最大利益分析を備えたトレンドライン。 3.トレンド通貨強度メーター。 4.アラート付きのトレンド反転ドット。 5.アラート付きの強いトレンドドット。 6.トレンド矢印 毎日の分析例、毎日のシグナルパフォーマンス...など、トレンドスクリーナーインジケーターを使用して、ここで見つけること
Enigmera
Ivan Stefanov
5 (7)
ENIGMERA: 市場の中心 重要:MQL5.comのデモはStrategy Testerで実行されており、Enigmeraの機能を完全には反映していない場合があります。詳細については、説明、スクリーンショット、ビデオをご確認ください。質問があれば、遠慮なくメッセージを送ってください! インジケーターのコードは完全に書き直されました。バージョン3.0は新機能を追加し、インジケーターの開始以来蓄積されたバグを修正しました。 紹介 このインジケーターとトレーディングシステムは、金融市場への注目すべきアプローチです。ENIGMERAはフラクタルサイクルを使用して、サポートとレジスタンスのレベルを正確に計算します。真の蓄積フェーズを示し、方向と目標を提供します。トレンドでも修正でも機能するシステムです。 動作方法 インジケーターのほとんどの機能は、チャートの左側にあるボタンで制御され、市場の状況に迅速に対応できるようになっています。 ボタン ON/OFF – インジケーター全体を表示または非表示にします。 Channel – サポートチャネルを有効にし、許容範囲の偏差を示します。 Dev
VERSION MT5        —        ИНСТРУКЦИЯ RUS           —        INSTRUCTIONS  ENG 主な機能: レンダリングなしで正確な入力信号! シグナルが表示された場合、それは関連性を維持します。これは、シグナルを提供してからそれを変更する可能性があり、入金時の資金の損失につながる可能性があるリドローインジケーターとの重要な違いです。より高い確率と精度で市場に参入できるようになりました。矢印が表示された後、ターゲットに達する (利益確定) か反転シグナルが表示されるまで、ローソク足を色付けする機能もあります。 STOP LOSS / TAKE PROFITゾーンの表示 エントリーポイントを検索する際の視覚的な明瞭さを改善するために、市場に参入するための最適なポイントが検索される買い/売りゾーンを最初に表示するモジュールが作成されました。ストップロスレベルを操作するための追加のインテリジェントロジックは、時間の経過とともにそのサイズを縮小するのに役立ち、その結果、取引を開始するとき(move sl)の初期リスクを軽減しま
PUMPING STATION – あなた専用の「オールインワン」戦略 PUMPING STATIONは、あなたのトレードをより楽しく、そして効果的に変えてくれる革新的なFXインジケーターです。ただの補助ツールではなく、強力なアルゴリズムを備えた本格的なトレーディングシステムで、より安定したトレードのスタートをサポートします。 この商品をご購入いただくと、以下の特典を無料でお付けします: 専用セットファイル:自動設定による最大パフォーマンスを実現。 ステップバイステップのビデオマニュアル:PUMPING STATION戦略の使い方を学べます。 Pumping Utility:PUMPING STATION専用の半自動トレードボットで、より快適かつシンプルな運用を可能にします。 ※ご購入後すぐにご連絡ください。追加リソースへのアクセスを提供いたします。 PUMPING STATIONの仕組み: トレンド管理:市場のトレンド方向を即座に判断。トレンドはあなたの最高の味方です。 エントリーサイン:チャート上の矢印で、取引のタイミングと方向を明確に示します。 明確な目標設定:インジケーターが自
Automated Trendlines
Georgios Kalomoiropoulos
5 (17)
トレンドラインは、外国為替取引におけるテクニカル分析の最も重要なツールです。残念ながら、ほとんどのトレーダーはそれらを正しく描画していません。自動トレンドラインインジケーターは、市場のトレンドの動きを視覚化するのに役立つ本格的なトレーダー向けのプロフェッショナルツールです。 トレンドラインには、強気トレンドラインと弱気トレンドラインの2種類があります。 上昇トレンドでは、外国為替トレンドラインは価格変動の最低スイングポイントを介して描画されます。 少なくとも2つの「最低安値」を接続すると、トレンドラインが作成されます。 下降トレンドでは、トレンドラインは価格変動の最も高いスイングポイントを介して描画されます。 少なくとも2つの「最高値」を接続すると、トレンドラインが作成されます。 トレンドラインが壊れたとき? 弱気のろうそくが強気のトレンドラインの下で閉じ、ろうそくの高さがトレンドラインの上にあるとき、強気のトレンドラインは壊れます。 強気のろうそくが弱気のトレンドラインの上で閉じ、ろうそくの安値がトレンドラインの下にあるとき、弱気のトレンドラインは壊れます。 トレ
Pair Trading Strategy Based on Spearman Correlation and Stationary Z-Score : A Revolutionary Trading Indicator for Precision and Profit Pair Trading Strategy Based on Spearman Correlation and Stationary Z-Score is a cutting-edge MetaTrader 4 (MT4) indicator designed to empower traders with advanced pairs trading strategies. Built with precision, this tool leverages Spearman Rank Correlation, Z-Score analysis, and stationarity testing to uncover profitable trading opportunities in correlated cur
Dynamic Forex28 Navigator - 次世代の Forex 取引ツール。 現在 49% オフ。 Dynamic Forex28 Navigator は、長年人気のインジケーターを進化させたもので、3 つの機能を 1 つにまとめています。 Advanced Currency Strength28 インジケーター (レビュー 695 件)  + Advanced Currency IMPULSE with ALERT (レビュー 520 件) + CS28 コンボ シグナル (ボーナス)。 インジケーターの詳細 https://www.mql5.com/en/blogs/post/758844 次世代の Strength インジケーターが提供するもの  オリジナルで気に入っていたすべての機能が、新機能と精度の向上によって強化されました。 主な機能: 独自の通貨強度計算式。 すべての時間枠でスムーズかつ正確な強度ライン。 トレンドの特定と正確なエントリーに最適です。 ダイナミックマーケットフィボナッチレベル (マーケットフィボナッチ)。 このインジケーターに固有
市場の2つの基本原則に基づく日中戦略。 このアルゴリズムは、追加のフィルターを使用したボリュームと価格の波の分析に基づいています。インディケータのインテリジェントアルゴリズムは、2つの市場要因が1つに結合した場合にのみシグナルを出します。インディケータは、より高い時間枠のデータを使用して、M1チャート上の特定の範囲の波を計算します。そして波を確認するために、インジケーターはボリュームによる分析を使用します。 このインディケータはレディトレーディングシステムです。トレーダーが必要とするのは、信号に従うことだけです。また、インジケーターはあなた自身の取引システムの基礎になることができます。取引はミニッツチャートでのみ行われます。 インジケーターがMTFの原則を使用しているという事実にもかかわらず、インジケーターのアルゴリズムは可能な限り安定しています。 購入後、必ず私に書いてください!私の取引設定と推奨事項をあなたと共有します!
反転ゾーン / ピークボリューム / 主要プレーヤーのアクティブゾーン =       TS TPSプロシステム 説明書 RUS       /       説明書     英語     /       Version MT5 このインジケーターを購入したすべての購入者は、さらに以下を無料で受け取ります: RFI SIGNALS サービスからの取引シグナルへの 6 か月間のアクセス - TPSproSYSTEM アルゴリズムに従った既製のエントリ ポイント。 定期的に更新されるトレーニング資料 - 戦略に没頭し、プロフェッショナル レベルを高めます。 平日は 24 時間 365 日サポート、非公開のトレーダー チャットへのアクセス - コミュニケーション、サポート、市場状況の分析。 著者の設定ファイル - 余分な労力をかけずに最大の結果を達成するための自動インジケーター設定。 主な機能: 売り手と買い手のアクティブなゾーンを表示します。 このインジケーターは、購入と販売の正しい最初のインパルス レベル/ゾーンをすべて表示します。これらのレベル/ゾーンがアクティブになると、エントリ
FX Volume
Daniel Stein
4.6 (35)
FX Volume:ブローカー視点で捉える本物の市場センチメント クイック概要 トレード手法をさらに高めたいとお考えですか? FX Volume は、リテールトレーダーやブローカーのポジション状況をリアルタイムで提供します。これは、COTのような遅延レポートよりもはるかに早く知ることができます。安定した利益を目指す方も、さらなる優位性を求める方も、 FX Volume は大きな不均衡を見極め、ブレイクアウトを確認し、リスク管理を洗練させるのに役立ちます。今すぐ始めて、実際の出来高データがどのように意思決定を変革するかを体感してください! 1. FX Volume がトレーダーにとって非常に有益な理由 高精度の早期警戒シグナル • 各通貨ペアを売買しているトレーダー数を、他者よりも早く、ほぼリアルタイムで把握できます。 • FX Volume は、複数のリテールブローカーから得られる本物の出来高データを収集し、分かりやすい形式で提供する 唯一 のツールです。 強力なリスク管理 • ロングやショートの大きな偏り(インバランス)を特定し、潜在的なトレンド転換を見逃しません。ストップ
このインディケータは、当社の2つの製品 Advanced Currency IMPULSE with ALERT  +   Currency Strength Exotics . のスーパーコンビネーションです。 このインジケーターは全ての時間枠で作動し、8つの主要通貨と1つのシンボルの強弱のインパルスをグラフで表示します。 このインジケータは、金、エキゾチックペア、商品、インデックス、先物など、あらゆるシンボルの通貨強度の加速度を表示することに特化されています。金、銀、原油、DAX、US30、MXN、TRY、CNHなどの通貨強度の加速度(インパルスまたは速度)を表示するために、任意のシンボルを9行目に追加できる、この種の最初のものです。 新しいアルゴリズムに基づいて構築され、潜在的な取引の特定と確認がさらに容易になりました。これは、通貨の強さや弱さが加速しているかどうかをグラフィカルに表示し、その加速の速度を測定するためです。加速すると物事は明らかに速く進みますが、これはFX市場でも同じです。つまり、反対方向に加速している通貨をペアリングすれば、潜在的に利益を生む取引を特定
TPA True Price Action indicator reveals the true price action of the market makers through 100% non-repainting signals (except early signals mode) strictly at the close of a candle! TPA shows entries and re-entries, every time the bulls are definitely stronger than the bears and vice versa. Not to confuse with red/green candles. The shift of power gets confirmed at the earliest stage and is ONE exit strategy of several. There are available now two free parts of the TPA User Guide for our custom
現在20%OFF! 初心者やエキスパートトレーダーに最適なソリューションです。 このインディケータは、エキゾチックペア・コモディティ・インデックス・先物など、あらゆるシンボルの通貨の強さを表示することに特化したインディケータです。金、銀、原油、DAX、US30、MXN、TRY、CNHなどの通貨の強さを表示するために、9行目にどのシンボルでも追加することができます。独自の機能を多数搭載し、新しい計算式を採用したため、ユニークで高品質、かつ手頃な価格のトレーディングツールとなっています。新しいトレンドやスキャルピングチャンスのトリガーポイントを正確に把握することができるため、あなたのトレードがどのように改善されるか想像してみてください。 ユーザーマニュアル:ここをクリック   https://www.mql5.com/en/blogs/post/708876 すべての時間枠に対応します。あなたはすぐにトレンドを見ることができるようになります! 新しいアルゴリズムに基づいて設計されているため、潜在的な取引の特定と確認がより簡単になります。これは、8つの主要通貨と1つのシンボルの強弱
これはほぼ間違いなく、MetaTraderプラットフォームで見つけることができる最も完全な調和価格形成自動認識インジケーターです。 19種類のパターンを検出し、フィボナッチプロジェクションをあなたと同じように真剣に受け止め、潜在的逆転ゾーン(PRZ)を表示し、適切なストップロスとテイクプロフィットレベルを見つけます。 [ インストールガイド | 更新ガイド | トラブルシューティング | よくある質問 | すべての製品 ] 19の異なる調和価格形成を検出します プライマリ、派生および補完フィボナッチ投影(PRZ)をプロットします 過去の価格行動を評価し、過去のすべてのパターンを表示します この指標は、独自の品質とパフォーマンスを分析します 適切なストップロスとテイクプロフィットのレベルを表示します ブレイクアウトを使用して適切な取引を通知します すべてのパターン比をグラフにプロットします 電子メール/音声/視覚アラートを実装します スコット・M・カーニーの本に着想を得て、この指標は最も純粋で急を要するトレーダーのニーズを満たすように設計されています。ただし、トレードを容易にする
Chart Patterns All in One」をデモモードでお試しいただき、ボーナスを獲得してください。デモモードで試した後、メッセージを送っていただければボーナスをお渡しします。 購入後にコメントを残すと、高品質なインジケーター8つをボーナスとして受け取れます。 Chart Patterns All-in-One インジケーターは、トレーダーがテクニカル分析で一般的に使用されるさまざまなチャートパターンを視覚化するのに役立ちます。このインジケーターは市場の潜在的な動きを特定するのに役立ちますが、収益性を保証するものではありません。購入前にデモモードでテストすることをお勧めします。 現在のオファー : 「Chart Patterns All in One」インジケーターが50%割引。 含まれるパターン : 1-2-3 パターン : 3つの主要なポイント(高値または安値)を使用して市場の反転を検出します。 買い : 2つの連続する安値の後に、前の高値よりも低い高値が出現。 売り : 2つの連続する高値の後に、前の安値よりも高い安値が出現。 可視化 : 特定されたポイントを線と矢印
Golden Trend Indicator
Noha Mohamed Fathy Younes Badr
5 (11)
Golden Trend indicator  is The best indicator for predicting trend movement this indicator never lags and never repaints and never back paints    and give  arrow buy and sell    before the candle appear  and it will help you and  will make your trading decisions clearer its work on all currencies and  gold and crypto and all time frame This unique  indicator uses very secret algorithms to catch the  trends, so you can trade using this indicator and see the trend clear on charts  manual guide and
通貨強さウィザードは、取引を成功させるためのオールインワン ソリューションを提供する非常に強力な指標です。このインジケーターは、複数の時間枠のすべての通貨のデータを使用して、このまたはその外国為替ペアのパワーを計算します。このデータは、使いやすい通貨インデックスと通貨パワーラインの形式で表され、特定の通貨のパワーを確認するために使用できます。 必要なのは、取引したいチャートにインジケーターを接続することだけです。インジケーターは、取引する通貨の実際の強さを示します。このインジケーターは、トレンドに合わせて取引するときに有利に利用できる売買高の圧力の極値も示します。このインジケーターには、フィボナッチに基づく可能なターゲットも表示されます。 このインジケーターは、PUSH 通知を含むあらゆるタイプのアラートを提供します。 購入後ご連絡下さい。私の取引のヒントをあなたと共有し、素晴らしいボーナスインジケーターを無料で提供します! 幸せで有益な取引をお祈りします。
!SPECIAL SALE! The Reversal Master is an indicator for determining the current direction of price movement and reversal points. The indicator will be useful for those who want to see the current market situation better. The indicator can be used as an add-on for ready-made trading systems, or as an independent tool, or to develop your own trading systems. The Reversal Master indicator, to determine the reversal points,  analyzes a lot of conditions since the combined analysis gives a more accura
現在20%OFF! このダッシュボードは、複数のシンボルと最大9つのタイムフレームで動作するソフトウェアの非常に強力な部分です。 このソフトは、弊社のメインインジケーター(ベストレビュー:Advanced Supply Demand)をベースにしています。    Advanced Supply Demand ダッシュボードは、素晴らしい概要を提供します。それは示しています。  ゾーン強度評価を含むフィルタリングされた需給値。 ゾーン内/ゾーンへのPips距離。 ネストされたゾーンがハイライトされます。 選択されたシンボルの4種類のアラートを全ての(9)時間枠で提供します。 それはあなたの個人的なニーズに合わせて高度に設定可能です。 あなたの利益! すべてのトレーダーにとって最も重要な質問です。 市場に参入するのに最適なレベルはどこか? 成功のチャンスとリスク/リターンを得るために、強力な供給/需要ゾーン内またはその近くで取引を開始します。 損切りの最適な位置はどこですか? 最も安全なのは、強力な供給/需要ゾーンの下/上にストップを置くことです。 最適な利益
Special offer! https://www.mql5.com/ru/users/bossik2810 System Trend Pro - This is the best trend trading indicator!!! The indicator no repaint!!!  The indicator has   MTF   mode, which adds confidence to trading on the trend (   no repaint   ). How to trade? Everything is very simple, we wait for the first signal (big arrow), then wait for the second signal (small arrow) and enter the market in the direction of the arrow. (See screens 1 and 2.) Exit on the opposite signal or take 20-30 pips,
Volatility Trend System - a trading system that gives signals for entries. The volatility system gives linear and point signals in the direction of the trend, as well as signals to exit it, without redrawing and delays. The trend indicator monitors the direction of the medium-term trend, shows the direction and its change. The signal indicator is based on changes in volatility and shows market entries. The indicator is equipped with several types of alerts. Can be applied to various trading ins
FX Power: 通貨の強弱を分析して、より賢い取引を実現 概要 FX Power は主要通貨と金の実際の強弱をあらゆる市場状況で理解するための必須ツールです。強い通貨を買い、弱い通貨を売ることで、 FX Power は取引の意思決定を簡素化し、高い確率の取引機会を見出します。トレンドを追従する場合でも、極端なデルタ値を使用して反転を予測する場合でも、このツールはあなたの取引スタイルに完全に適応します。ただ取引するだけではなく、 FX Power で賢く取引をしましょう。 1. なぜ FX Power がトレーダーにとって非常に有益なのか 通貨と金のリアルタイム強弱分析 • FX Power は主要通貨と金の相対的な強弱を計算し、マーケットダイナミクスに関する明確な洞察を提供します。 • どの資産がリードしているか、または後れを取っているかを監視して、取引するペアを賢く選びましょう。 マルチタイムフレームの包括的なビュー • 短期、中期、長期のタイムフレームで通貨と金の強弱を追跡し、マーケットトレンドに基づいて取引戦略を調整できます。 • スキャルピングからスイングトレード
**Market Structure Break Out(MSB)**は、 MT4およびMT5 向けに設計された高度なツールで、市場の動きを構造としてとらえ、 トレンド方向および逆方向の矢印とアラート によって優れたトレードシグナルを発見するのに役立ちます。 この製品のもう一つの重要な機能は、 持続的な供給と需要ゾーンの描画 です。トレーダーは重要な価格レベルを簡単に把握できます。さらに、 リアルタイムのバックテスト機能 により、過去におけるインジケーターのパフォーマンスをチャート上で確認でき、透明性と信頼性が向上します。 商品の現在価格は69ドル、期間限定です。次回のMarket Structureの価格は99ドルとなります。 この商品のMT5バージョンはこちら: https ://www .mql5 .com /en /market /product /124690 このインジケーターは継続的に更新されています。 私たちは、マーケット構造に基づいた非常に正確なエントリーおよびエグジットポイントを提供することに努めています。現在バージョン1.6であり、今すぐ参加すると以下の最新の変
Stratos Pali Indicator   is a revolutionary tool designed to enhance your trading strategy by accurately identifying market trends. This sophisticated indicator uses a unique algorithm to generate a complete histogram, which records when the trend is Long or Short. When a trend reversal occurs, an arrow appears, indicating the new direction of the trend. Important Information Revealed Leave a review and contact me via mql5 message to receive My Top 5 set files for Stratos Pali at no cost! Dow
Special offer! https://www.mql5.com/ru/users/bossik2810 Trend Arrow Super The indicator not repaint or change its data. A professional, yet very easy to use Forex system. The indicator gives accurate BUY\SELL signals. Trend Arrow Super is very easy to use, you just need to attach it to the chart and follow simple trading recommendations. Buy signal: Arrow + Histogram in green color, enter immediately on the market to buy. Sell signal: Arrow + Histogram of red color, enter immediately on the m
作者のその他のプロダクト
NeuroScalper
Thomas Bradley Butler
5 (1)
アップデート!矢印が100レベルと200レベルに追加されました。 このインディケータは極値にアクセスするために正確であり、主に1分間の買いポジションをサポートします。他の時間枠を使用することもできますが、レベルは異なります。これは優れた発振器であり、他の発振器と比較して違いを確認します。 ニューロネットワークの概念を使用したデイトレード。このインジケーターは、基本的な形式のニューロネットワークを使用して売買するシグナルを生成します。 1分足チャートのインジケーターを使用します。インジケーターは再描画されません。 1分間のチャートまたはさまざまなレベルを使用する他のチャートを使用してテスターでダウンロードして実行し、取引を分析して自分で確認します。市場を頭皮にする多くの機会。より高い時間枠で使用できますが、レベルはあなたの裁量に応じて変更する必要があります。時間枠が長いほど、範囲が広くなります。 このモデルで考慮すべき概念と事項: 複数のインジケーターが使用され、重みが適用され、最大値と最小値に2つのデータポイントがあります。この指標は主に上昇トレンドを取引するためのものですオシレ
ForexReversal
Thomas Bradley Butler
4 (1)
忍耐はストレスのないスキャルピングの鍵です。 200の移動平均を通過するのを確認したら、矢印をトレードし、移動平均フィルターを使用せずに、最後のスイングポイントから拡大またはトレンドを作成します。 1分間の時間枠に最適で、日中の動きの勢いを捉えます。 トレーリングストップを使用して、簡単に20ピップを取るか、より大きなトレンドのために長く滞在します。 この指標からの本当に大きな取引の写真の例を見てください。 1分の時間枠が最適です。 ズームアウトしてトレンドを確認します。 矢印は再描画または再計算されません。 1分の時間枠に添付して取引を調査し、それが戦略に使用できるかどうかを確認します。 私 ルール: 購入のための青 販売のための赤 横向きの期間を避けてください 大量の取引と勢いの取引 ストップロスを使用する
株式(CFD)のみのデイトレード。 取引には手間がかかります。 すべてのエントリと終了を通知するショートカットやインジケータはありません。 利益は心の状態から来ます。 指標は、お金の管理と成功の心理学と組み合わせて使用されるツールです。 ボリュームプロファイルの不均衡を見つけます。 取引価格のボリュームの不均衡。 多くの不均衡は、クローズとオープンおよびニュースで発生します。 株の買い手と売り手を参照してください。 5分から1時間使用して、誰が価格を管理できるかを確認し、価格の不均衡を見つけます。 より大きな在庫は15分以上です。 カラーボリュームバーの上にマウスを置くと、過去のバーの数が表示されます。 現在のバーの音量は上隅に書かれています。 ボリュームの不均衡を見つけて、しばらくの間価格がどの方向に進むかを確認します。 最良の結果を得るために支配的な傾向に従ってください トレンドが発生した場合は、トレンドをトレードするようにしてください。 トレーリングストップを使用し、大量の反転の不均衡に注意してください。
GoldBuyBackScalper
Thomas Bradley Butler
4 (1)
このインジケーターはXAU / USD、1分足チャートのみを対象としています。 すべてのペアには、独自の特性と価格変動があります。 このインジケーターでV字型の反転をトレードします。 頭皮はトレーリングストップを使用して購入し、ニュースはより極端で突然の売りを引き起こす可能性があるため、ニュースを避けます。 バックテストで1分の時間枠にアタッチし、反転購入を確認します。 インジケーターが再描画または再計算されることはありません。 活動時間中のみの取引 このインジケーターはXAU / USD、1分足チャートのみを対象としています。 すべてのペアには、独自の特性と価格変動があります。 このインジケーターでV字型の反転をトレードします。 頭皮はトレーリングストップを使用して購入し、ニュースはより極端で突然の売りを引き起こす可能性があるため、ニュースを避けます。 バックテストで1分の時間枠にアタッチし、反転購入を確認します。 インジケーターが再描画または再計算されることはありません。 活動時間中のみの取引
This is based on short term strength or weakness and not on moving averages.  Moving averages are used for filter only. Trade supply and demand with arrows. Supply and demand breakouts and strength of the buyers or sellers .  Don't trade buy arrow to sell arrow.  Trade the strength with trendlines or moving averages and use stops.  The arrow can have some strong moves.  Trade on all time frames.  Try it out in the back tester. The pips can be made with this indicator, follow the arrows and make
Master scalping with this indicator.  Trade on any time frame for scalps on buy or sells.  Follow trends using a 200 moving average and stops and targets.  Use with your own system.  This indicator can give pips if following it correctly.  Stick to rules and pick up pips daily.  Use as entries in a trend, scalp for a few pips or exit on opposite signal.  Best to follow higher time frame trends. Indicator doesn't repaint or recalculate. Rules: Don't trade overnight, only trade during active sessi
This indicator is good for small time frames like 1 and 5 minutes and made for day trading. The indicator never repaints or recalculates. The indicator works is for trading swing points in day trading, following bulls or bears.  Its a simple to use, non cluttered indicator with a high success rate.  This indicator works well to capture ranges.  All indicators come with limitations and no indicator or system is always accurate. Use money management for long term trading success.   Place in backte
DTKGold
Thomas Bradley Butler
This is the DayTradeKing for gold on a 1 minute time frame.  It is a different calculation for the range. Use a 200 period moving average as a filter.  Always use stops and avoid news, wait for more conformation.  This looks to capture intraday ranges. Put it in the back tester on 1 minute to see the price action and how it works. Trade with trend Use filter Use stops Alerts are added for pop ups and sound. 
Trade trends with the Super Scalper Use on all time frames and assets it is  designed for scalping trends. Works good on small time frames for day trading.  The arrows are easy to follow.  This is a simple no repaint/no recalculate arrow indicator to follow trends with.  Use in conjunction with your own system or use moving averages.  Always use stops just below or above the last swing point or your own money management system The indicator comes with push notifications, sound alerts and email
This indicator is a simple stripped down version of any advanced support and resistance indicator.  All the support and resistance indicators work from a number of bars that have developed over time. Get rid of clutter and confusing levels.  Find levels according to a number of bars. Look at days, session, numbers of hours, periods of consolidation.  Watch levels develop and use as breakout points, or areas of buyers and sellers.  Features and things to consider This indicator is for a frame of
https://www.mql5.com/en/market/product/57345 このEAは、外国為替反転インジケーターに基づいています。 システムを手動で取引したい場合は、インジケーターをダウンロードして試してみてください。 EAはトレンドに従い、それに応じてポジションをオープンします。 結果は、より低いドローダウンで安定したゲインを示していますが、バックテスター、オプティマイザー、および時間枠でそれを試して、何が機能するかを確認してください。 示されているすべての結果は架空のものです。 注:これはマーチンゲールやグリッドではありません。 インジケーターにはヘッジ機能があります このEAには以下の機能があり、リスクに応じて変更してください。 EAは自由証拠金に従って追加し、パラメーターに従って売買します。 入力を通じてリスクを管理します。 inp5は売りです inp7は購入です ストップロットを修正 固定テイクプロフィット   フリーマージンの%
HFTHacker
Thomas Bradley Butler
最適化における複雑さとユーザーの混乱のため、これは回復することなくシンプル バージョンに戻っています テストおよび使用前に EA を最適化してください。最適化した場合にのみ購入してください。これは、最適化の方法を知っており、自分の実力で利益を上げたいトレーダー向けです。リスク パラメータは自分で設定します。勝率が高く、うまくいかないトレードにはストップをかけます。リスクを減らして長く使い続けましょう。これはすべてのアカウントで機能し、リスク管理ツールです。すべてのコメント、説明、および MT5 バージョン: https://www.mql5.com/en/market/product/74421 このエキスパート アドバイザー (EA) は、トレーダーのアカウント残高に基づいてポジション サイズをスケーリングしながら、売買トレードを自動化します。そのコア機能は、取引サイズを動的に調整し、口座が拡大または縮小しても、リスクが利用可能な資本に比例するようにすることです。これにより、特定の取引で過剰なレバレッジをかけたり、リスクが少なすぎたりすることなく、一貫した取引戦略を維持できま
MarketMaker
Thomas Bradley Butler
需要と供給の取引を自動化します。市場を作る。 このEAは、誰もが販売および模倣する人気のある需要と供給の指標に触発されて作成されました。 EAは取引とヘッジを続け、市場を作ります。非ヘッジ口座でも取引できます。リスクを評価し、時間枠、ロットサイズ、ヘッジ機能を使用する必要があります。一度に複数のペアをオンとオフで合計約1か月間取引しました。 システムの概念: EAは需要と供給のレベルを交換します。レベルが変わるので、EAは新しいレベルを交換し続けます。より低いロットの多くのペアに分散することは、システムの機能です。安定したゲインを維持しながら、大きなドローダウンを回避する必要があります。 SLは使用できますが、これをオプションにするために説明したヘッジされた側面。私が多くのペアで小ロットで得ているドローダウンは4%であり、これはSLなしです。より大きなロットは6%を示しています。したがって、小さいサイズは控えめで、大きいサイズはより積極的です。これらは、残高と比較して取引されるロットを低く保つ理由です。貿易は発展する余地が必要です。 特徴: 取引数 固定ロット ボリュ
Top Trader
Thomas Bradley Butler
Top Trader Indicator This is an arrow reversal indicator. This is with deviations and arrows.  Trade a blue arrow for buy and trade a red arrow for sell.  Change the time period and the deviations of the bands.  This is similar to others but these arrows don't repaint.  Load in back tester and study which periods and deviations work the best.  It works on all time frames.  15 min to 1 hr would give good results for take profits.  Try according to your own risk management.
Quant Bot
Thomas Bradley Butler
Quant Botは、EUR / USDの1時間の時間枠でのトレンド取引用です。 セットファイルはありませんが、他のペアを使用する場合は、最適化が必要になる場合があります。 ボットについて: 遺伝子生成を使用し、ATRを使用して取引します。 カーブフィットを防ぐためにウォークフォワード期間が使用されました EAはすべての取引でストップを使用します。 お金の管理は、バランスの%でスケールアップします バックセット期間は2003年から2020年までであり、前進は2020年から2022年まででした(写真を参照)。 Quant Botは、EUR / USDの1時間の時間枠でのトレンド取引用です。 セットファイルはありませんが、他のペアを使用する場合は、最適化が必要になる場合があります。 ボットについて: 遺伝子生成を使用し、ATRを使用して取引します。 カーブフィットを防ぐためにウォークフォワード期間が使用されました EAはすべての取引でストップを使用します。 お金の管理は、バランスの%でスケールアップします バックセット期間は2003年から2020年までであり、前進は2020年か
Crypto Net
Thomas Bradley Butler
Crypto Netは、1時間の時間枠でBTCUSDを取引するためのものです。 それは戦略を進化させるために遺伝的進化を使用します。 このEAトレードトレンドは、ATRと一目の嘘の指標に続いています。 これは構築され、モンテカルロやウォークフォワードを含む一連の堅牢なテストに合格しました。 入力: 最小リスクであるアカウントの割合。 最大ロット数 取引を停止する時間 他に何も変更されていません。 フォワードのみのトレード。 バックテストはありません。 ブローカーの時間は、戦略が組み込まれたものとは異なります。 Crypto Netは、1時間の時間枠でBTCUSDを取引するためのものです。 それは戦略を進化させるために遺伝的進化を使用します。 このEAトレードトレンドは、ATRと一目の嘘の指標に続いています。 これは構築され、モンテカルロやウォークフォワードを含む一連の堅牢なテストに合格しました。 入力: 最小リスクであるアカウントの割合。 最大ロット数 取引を停止する時間 他に何も変更されていません。
PropTrader
Thomas Bradley Butler
*使用前にEAを最適化してください* EUR/USD向けに最適化された外国為替取引戦略 Expert Advisor (EA) を使用して 1 ~ 2 年以内に多額の富を達成するというのは非現実的な主張です。 バックテストと実際の取引は、EUR/USD 通貨ペアに焦点を当てています。 この戦略について: これは私たちの戦略の最初の反復を表しており、さらなる進歩の可能性があります。 100% 品質のデータを使用して厳密にテストされており、MT4 エラーはありません。 この戦略は、トレンドフォローの論理原則に基づいて機能します。 トレンドが強気の場合、EA が開始してトレーリング ストップを展開します。逆の場合も同様です。 本質的には、これは単純なトレンド追跡アプローチです。 主な利点と考慮事項: 簡単なセットアップ: デフォルト設定をそのまま使用し、好みに応じてロットサイズを変更するだけです。 リスク管理: この戦略ではマーチンゲールやヘッジは使用されません。 リスク軽減: 各取引には、アベレージ トゥルー レンジ (ATR) によって決定されるトレーリング ストップおよび
Down Under
Thomas Bradley Butler
ダウンアンダーは1時間の時間枠でAUD/USDペアを取引します。 このEAはATRとOHLCをトレードします。 この時間枠でこのペア用にフォーマットされます。 複利は分で使用されます。 ロットサイズと最大。 ロットサイズ。 残高のパーセンテージは、勝ちトレードで合成されます。 バランスが変動すると、ロットサイズも変動します。 設定: mmリスク% mmロット 最大ロット 他に変更するものはありません。 これには、マーチンゲールまたはヘッジ機能はありません。 変更する他の機能は、取引している場合、AUD/USDのCFDのみです。 ブローカープラットフォームでこれを小数点以下で変更します。 リスク免責事項 先物、オプション、通貨取引はすべて大きな潜在的な見返りがありますが、大きな潜在的なリスクもあります。 これらの市場に投資するには、リスクを認識し、喜んで受け入れる必要があります。
Cable Trader
Thomas Bradley Butler
GBP/USD 1hr.  このEAは勢いとセッションを交換します。 これには固定ロットコンポーネントがあり、開発中にTPを変更し続けます。 設定: ロットサイズ 他に変更するものはありません。 これには、マーチンゲールまたはヘッジ機能はありません。 変更する他の機能は、取引している場合、GBP/USDのCFDのみです。 ブローカープラットフォームでこれを小数点以下で変更します。 リスク免責事項 先物、オプション、通貨取引はすべて大きな潜在的な見返りがありますが、大きな潜在的なリスクもあります。 これらの市場に投資するには、リスクを認識し、喜んで受け入れる必要があります。 リスク免責事項 先物、オプション、通貨取引はすべて大きな潜在的な見返りがありますが、大きな潜在的なリスクもあります。 これらの市場に投資するには、リスクを認識し、喜んで受け入れる必要があります。
Euclidean
Thomas Bradley Butler
ユークリッドは、私が8年前に思いついたユニークな取引アルゴリズムです。 このEAはこのシステムの一部です。 閉鎖系として機能します。 EAは、トレンドをキャッチするために角度の程度が正しいときに購入を開始します。 ストップロスは角度から10%です。 とても簡単です。 入力: ロット1マイクロロットの残高の%($ 1,000) ボリューム上位ロット=ロットの最大量 利益レベルを取る=デフォルトは50ピップス 方法と考慮事項: ストップロスが組み込まれており、10%の角度で価格に応じて取引されます。 テイクプロフィットは50ピップスに設定されていますが、希望する金額にすることができます。 1分から5分のような短い時間枠で取引します。 バックテスターでこれをテストする際のエラーはありませんでした。 プラットフォームやブローカーが異なればデータも異なるため、テストするデータのダウンロードを確認してください。 外国為替取引のリスク免責事項 証拠金で外国為替を取引することはリスクが高く、すべての投資家に適しているとは限りません。 過去のパフォーマンスは将来の結果を示すものではありま
Pip Scalper
Thomas Bradley Butler
みんなのための指標 Pip Scalperは、スキャルピングトレンド用です。 この指標を使用して、トレンドに長くとどまります。 すべての時間枠とアセットで機能します。 このツールで毎日のピップを拾います。 200の移動平均を使用して取引をフィルタリングします。 より短い時間枠をお勧めします。 デイトレードに使用します。 使用方法と使用方法: Pips Scalperは、長期的なトレンド取引に基づいています。 青で購入 赤で売る フィルターとして200移動平均を使用し、アクティブな期間中に取引します。 Pip Scalperは、スキャルピングトレンド用です。 この指標を使用して、トレンドに長くとどまります。 すべての時間枠とアセットで機能します。 このツールで毎日のピップを拾います。 200の移動平均を使用して取引をフィルタリングします。 より短い時間枠をお勧めします。 デイトレードに使用します。 使用方法と使用方法: Pips Scalperは、長期的なトレンド取引に基づいています。 青で購入 赤で売る フィルターとして200移動平均を使用し、アクティブな期間中に取
Evolved Trends
Thomas Bradley Butler
テスト前に最適化し、最適な入力を見つけるために使用します こんにちは、トレーダーの皆さん! MT4 プラットフォーム用の最先端の Expert Advisor が必要ですか? 進化したトレンド以外に目を向ける必要はありません。 機械学習テクノロジーで作成されたこの強力な取引アルゴリズムは、1 時間の時間枠での GBP/USD の取引に焦点を当てています。 ただし、最適化のために他のアセットや時間枠を自由に試してみてください。 自分のリスク許容度に合わせて入力をカスタマイズするだけです。 ATR に基づくストップ機能と、利益を確定し、損失をカットする機能を備えた Evolved Trends は、あらゆる取引システムに最適な資金管理を保証します。 さらに、独自のリスク スケーリング機能がアカウント残高に基づいて調整されます。 Evolved Trends でトレーディング ゲームを次のレベルに引き上げましょう!
Trade any Forex combine out there.  Many prop firms offer challenge or instant funding combines.  The biggest problem is controlling the loss.  With this indicator you can get a visual system that can limit loss and teach discipline.  This uses the MACD and the strategy is scalping.  You can determine the risk and reward.  Visually follow small trends for scalps.  Trade during active sessions.  It's just a simple system to instill discipline while limiting loss and scalping pips with the paramet
Holy Grail arrow is for scalping.  The period you use will determine the trend.  You can try different time frames and periods to see what works best for your strategy.  Filters can be applied like a moving average or trendlines.  The 1 minute works good for scalps and always trade during active periods and avoid consolidation times.  Using other indicators to determine trends is recommended but this can also be a free flowing scalping system alone with tp and sl. Inputs: Period = trend period
OPTIMIZE EA BEFORE TEST AND USE No EA turns hundreds into millions in a year or 2.  This is a lie if presented this way. Trade Twenty Eight Forex Pairs.  Use this EA to trade the pairs and time frames with tp and sl according to risk.  This comes with advanced money management built in.  It has break evens and take profits on 50% with sl and tp accordingly.  1 hour recommended but try on others for intraday or swing trading.
Fulltrend
Thomas Bradley Butler
Improve trading with this indicator.  Find areas of buys or sells in Fibonacci retracement areas.  Fulltrend is for scalping and making swing trades.  Fib levels are added for take profits and stop losses. This works on any time frame and can be used by itself or together with other systems and indicators for filters. The indicator doesn't repaint.  Alerts are added and can be true or false.  No need to sit glued to the computer, just set on charts and listen or the alerts to come.  Take a posi
Scalping Code is for trend scalping.  It is simple to use and is profitable.  It can work on any time frame and any asset.  This indicator can be used on it's own or together with another system.  The arrow does not repaint or recalculate.   The rules are as follows:   A blue arrow above the moving average is a buy. An exit for the buy above the moving average is a red arrow or target. A red arrow below the moving average is a sell. An exit for the red below the moving average is a blue arrow
OPTIMIZE BEFORE BACKTEST AND USE FOR A YEAR TO FIND BEST VALUES Order Flow is unique in that is trades the volume.  It was built on EUR/USD and is optimized from  11/11/2021 to 10/24/2022 on 1 hour charts.  Optimization inputs for money management are used.  This EA uses strict money management, it is not a get rich quick martingale or EA without a sl. Trading is about risk management, not gambling.   Run on EUR/USD 1 hour chart or if you want to find other assets and time frames to optimize th
AI Signal
Thomas Bradley Butler
AI Signal is an indicator that is a ready to made scalping system that doesn't repaint Instructions: Load indicator.  Use arrows as entries in trends and stay out of sideways markets.  Trade with the larger trend and trade only active volatile hours Buy blue arrow above yellow and exit at red arrow or at discretion.  Sell red arrow below yellow and exit at blue arrow  or at discretion.  Easy to follow and is based on trends.  The indicator works on all time frames and assets. Use at your own d
*OPTMIZE* High Speed Low Drag trades XAU/USD on 1 hour charts.  The EA was made with machine learning and uses RSI and moving averages to trade its logic. By default the take profit is at 150 and stops are at 50 with additional advanced money management like movable stops.  I would suggest this if you have the know how but this is for beginner or advanced as is. The money management system scales the balance so you can figure what % you want to start and then the max lots to trade.
フィルタ:
レビューなし
レビューに返信