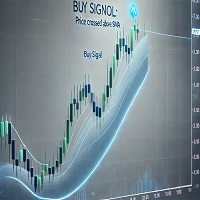
Visual Aroon Cross Signal Indicator
- インディケータ
- AL MOOSAWI ABDULLAH JAFFER BAQER
- バージョン: 1.0
- アクティベーション: 5
Product: Visual Aroon Cross Signal Indicator
Price: $65
Discover the power of trend identification and reversal points with the Visual Aroon Cross Signal Indicator! Designed to assist traders in recognizing key market movements, this indicator focuses on the Aroon oscillator’s signal crossing to detect market trends and shifts, offering insights into potential trade setups.
Note to Buyers
This indicator is not optimized. It’s a powerful tool crafted for traders to adjust and customize according to their own trading preferences and strategies. Take control and fine-tune the settings to match your unique approach to the markets.
What is the Aroon Oscillator?
The Aroon oscillator is a technical analysis tool that measures the strength and direction of a trend. It is based on the time elapsed since the highest high and lowest low over a specific period. The oscillator produces values that help traders identify:
-
Strong Trends: Indicates when the market is trending strongly upward or downward.
-
Potential Reversals: Identifies points where the trend may shift.
-
Consolidation Periods: Recognizes phases of indecision in the market.
How Does the Visual Aroon Cross Signal Indicator Work?
This indicator leverages the Aroon oscillator to visually display:
-
Signal Cross Points: When the Aroon Up and Aroon Down lines cross, it signals potential trend reversals or momentum shifts.
-
Trend Confirmation: Persistent positioning of the Aroon lines confirms the strength of ongoing trends.
-
Visual Alerts: Clear on-chart signals (arrows or highlights) to mark crossover points for easy identification.
Key Features
-
Easy-to-Read Display: The indicator visually highlights crossover signals on your chart, ensuring clarity and quick decision-making.
-
Customizable Settings: Modify parameters to suit different market conditions or personal trading preferences.
-
Multi-Timeframe Support: Analyze trends and signals across various timeframes to refine your trading strategy.
-
No Clutter: Focus solely on the important information without unnecessary distractions.
Trading Strategy and Entry Logic
1. Identifying Trend Reversals:
-
When the Aroon Up crosses above the Aroon Down, it’s a potential signal for bullish momentum.
-
Conversely, when the Aroon Down crosses above the Aroon Up, bearish momentum might be taking over.
2. Trend Confirmation:
-
Use the persistence of the Aroon Up above 70 or Aroon Down below 30 to confirm a strong trend.
-
Consolidation or indecision is indicated when both values hover near the middle (around 50).
3. Entry Points:
-
Look for crossover signals as potential entry opportunities. Combine them with other technical indicators or price action analysis to enhance accuracy.
-
For added precision, confirm signals with higher timeframes.
Who is this Indicator For?
-
Scalpers: Quickly spot short-term trends.
-
Swing Traders: Identify mid-term reversals and consolidation phases.
-
Trend Followers: Validate ongoing trends and find optimal entry points.
Why Choose This Indicator?
-
Simplifies Aroon oscillator analysis with clear visuals.
-
Allows for total customization to align with your trading style.
-
Can be adapted for various asset classes, including forex, stocks, and commodities.
-
Backtestable for evaluating performance on historical data.
Need Support?
If you have any questions or need help, feel free to contact me via direct message. I am here to assist you!
Explore More Tools:
Visit my profile to check out other expert advisors and indicators designed to simplify and enhance your trading journey: My MQL5 Profile.
Take control of your trading strategies with the Visual Aroon Cross Signal Indicator today!
