• 概要
  • レビュー
  • コメント

Market Trend Scanner MT5

Market Trend Scanner is a trend analyzer or trend screener indicator that helps you know the trend in selected timeframe of all symbols you're watching.
This indicator provides clear & detailed analysis results on a beautiful dashboard, let you able to use this result right away without need to do any additional analysis.

How it works

Step 1: Calculate values of 23 selected & trusted technical indicators (Oscillator & Moving Average indicators)
Step 2: Analyze all indicators using best practices to find out component trend 
Step 3: Combine all component signals using Safe Calculation method
Step 4: Provide final trustable signal

Why it works

  • All indicators used to analyze are popular technical indicators that traders use and trust
  • Signals are based on best practices that used and tested for a long time
  • Signal from multiple indicators in difference types combined is always much more trustable than just 1 or 2 indicators
  • Safe Calculation method is a smart that can use to rating final signal

  • If you're looking for an indicator that show the trend of selected symbol in difference timeframes, please check this Timeframes Trend Scanner
  • Please note that this indicator doesn't work with Strategy Tester because of heavy calculation. Sorry for that!

How to use it

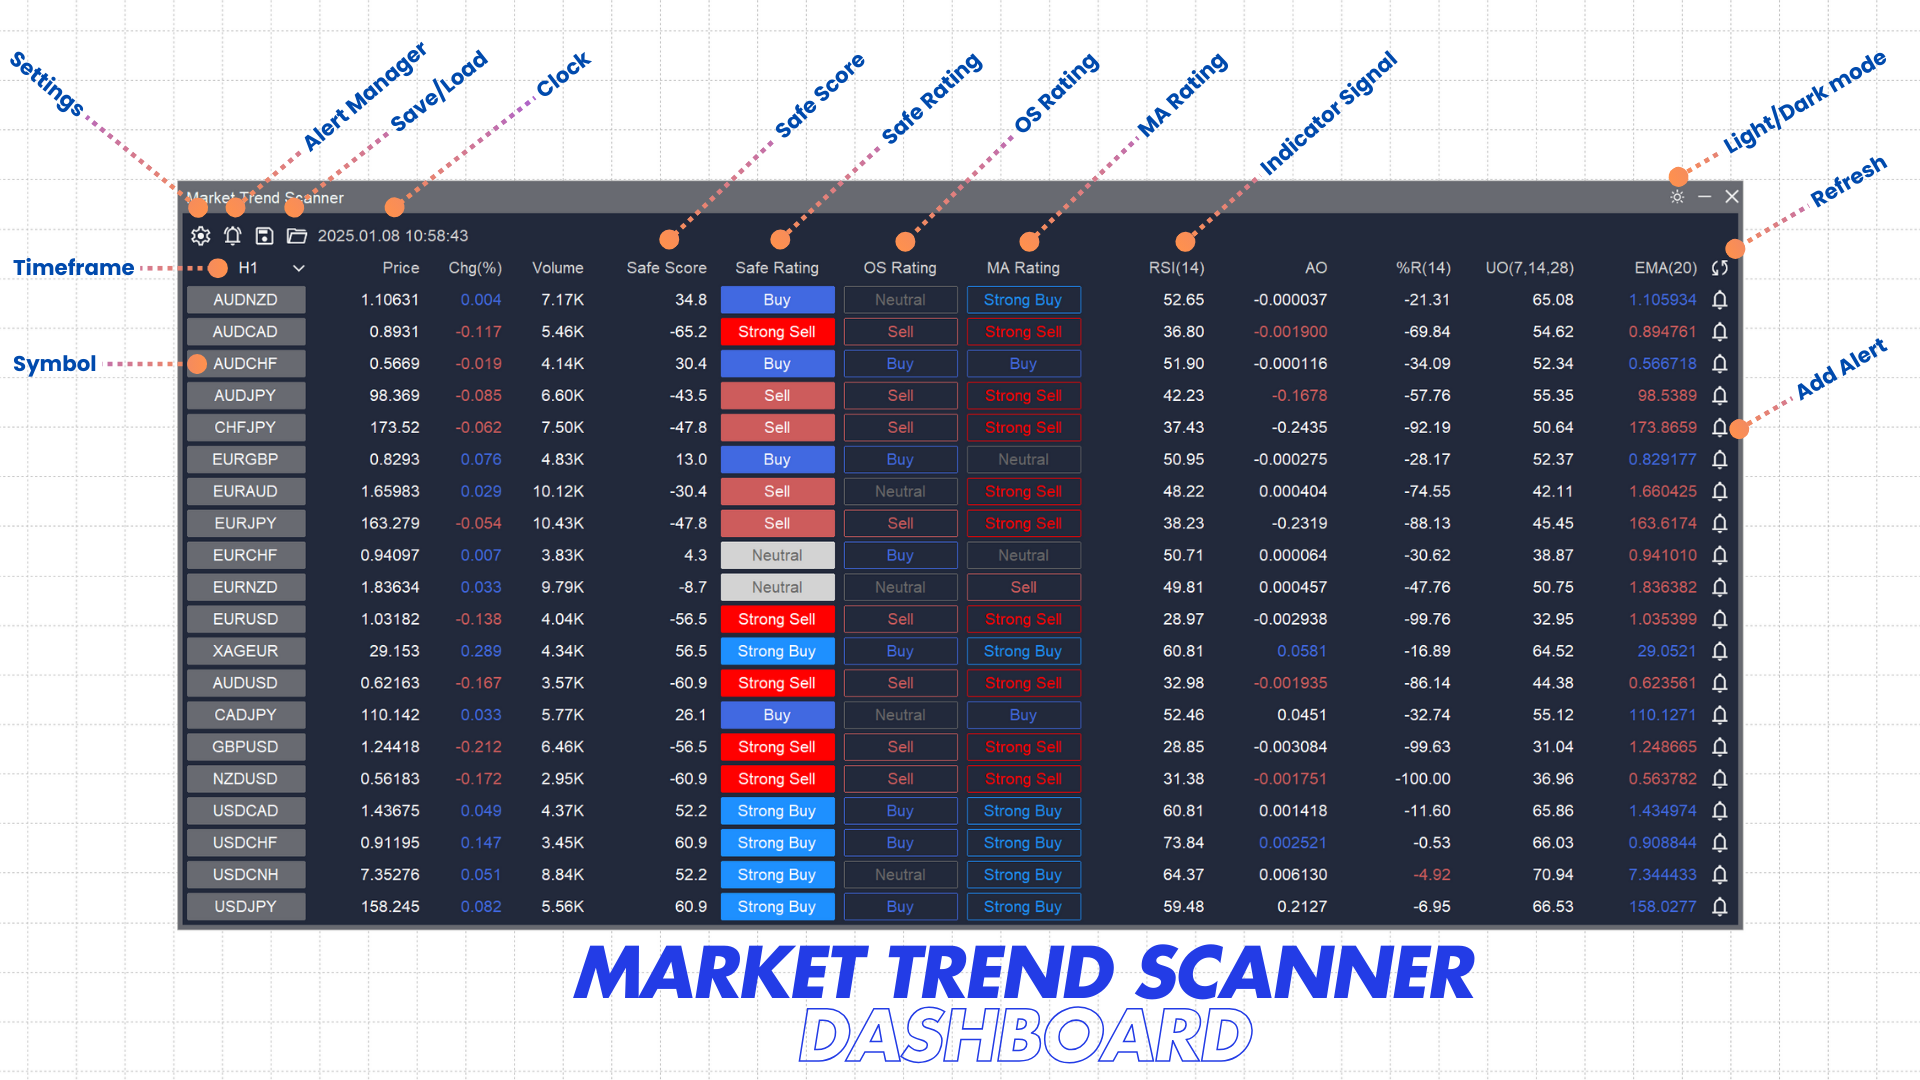
Market Trend Scanner indicator provides these main analyzed data:
- Safe Score: Trend score calculated by Safe Calculation method
- Safe Rating: Final signal by using Safe Calculation method. Can be Neutral, Buy, Strong Buy, Sell, Strong Sell
- Oscillator Rating (OS Rating) : Combination signal of oscillator indicators
- Moving Average Rating (MA Rating): Combination signal of moving average indicators
- Indicator Signals: Signal of single indicators

The way to use these analyzed data:

  • When Safe Rating is Neutral => No clearly trend. Don't be hurry! Keep monitoring
  • When Safe Rating turns from Neutral to Buy/Strong Buy => It's bullish now. Buy!
  • When Safe Rating turns from Neutral to Sell/Strong Sell => It's bearish now. Sell!
  • If you want to enter a position earlier for better price but less reliable => Follow MA Rating when there are no opposite signals of Safe Rating and OS Rating
  • If you want to trade on Overbought/Oversold events => Follow OS Rating when there are no opposite signals of Safe Rating and MA Rating
  • If you are an experienced trader with lot of experiences, more details are provided in Safe Score & Indicator Signals. You can use them for more complex strategies

Who should use this indicator

- If you are a fundamental trader, this indicator is totally useless. It can't help you. Please keep searching for other useful indicators.
- If you are a technical trader who believes on data, history and indicators, you have to own this indicator. Trust me, bro!
- If you are a new trader, this indicator is very strong and simple to use. No setup required. Using selected and trusted indicators. Using best practices...
- If you are an experienced trader, this indicator still help. Are you able to monitor and combine many indicator signals at the same time? Do you have a good method to rating analyzed signals? Let this indicator saves your effort and helps you build more profit strategies.

Something you should know

  • This indicator works as a monitoring dashboard. It won't draw anything on chart candles
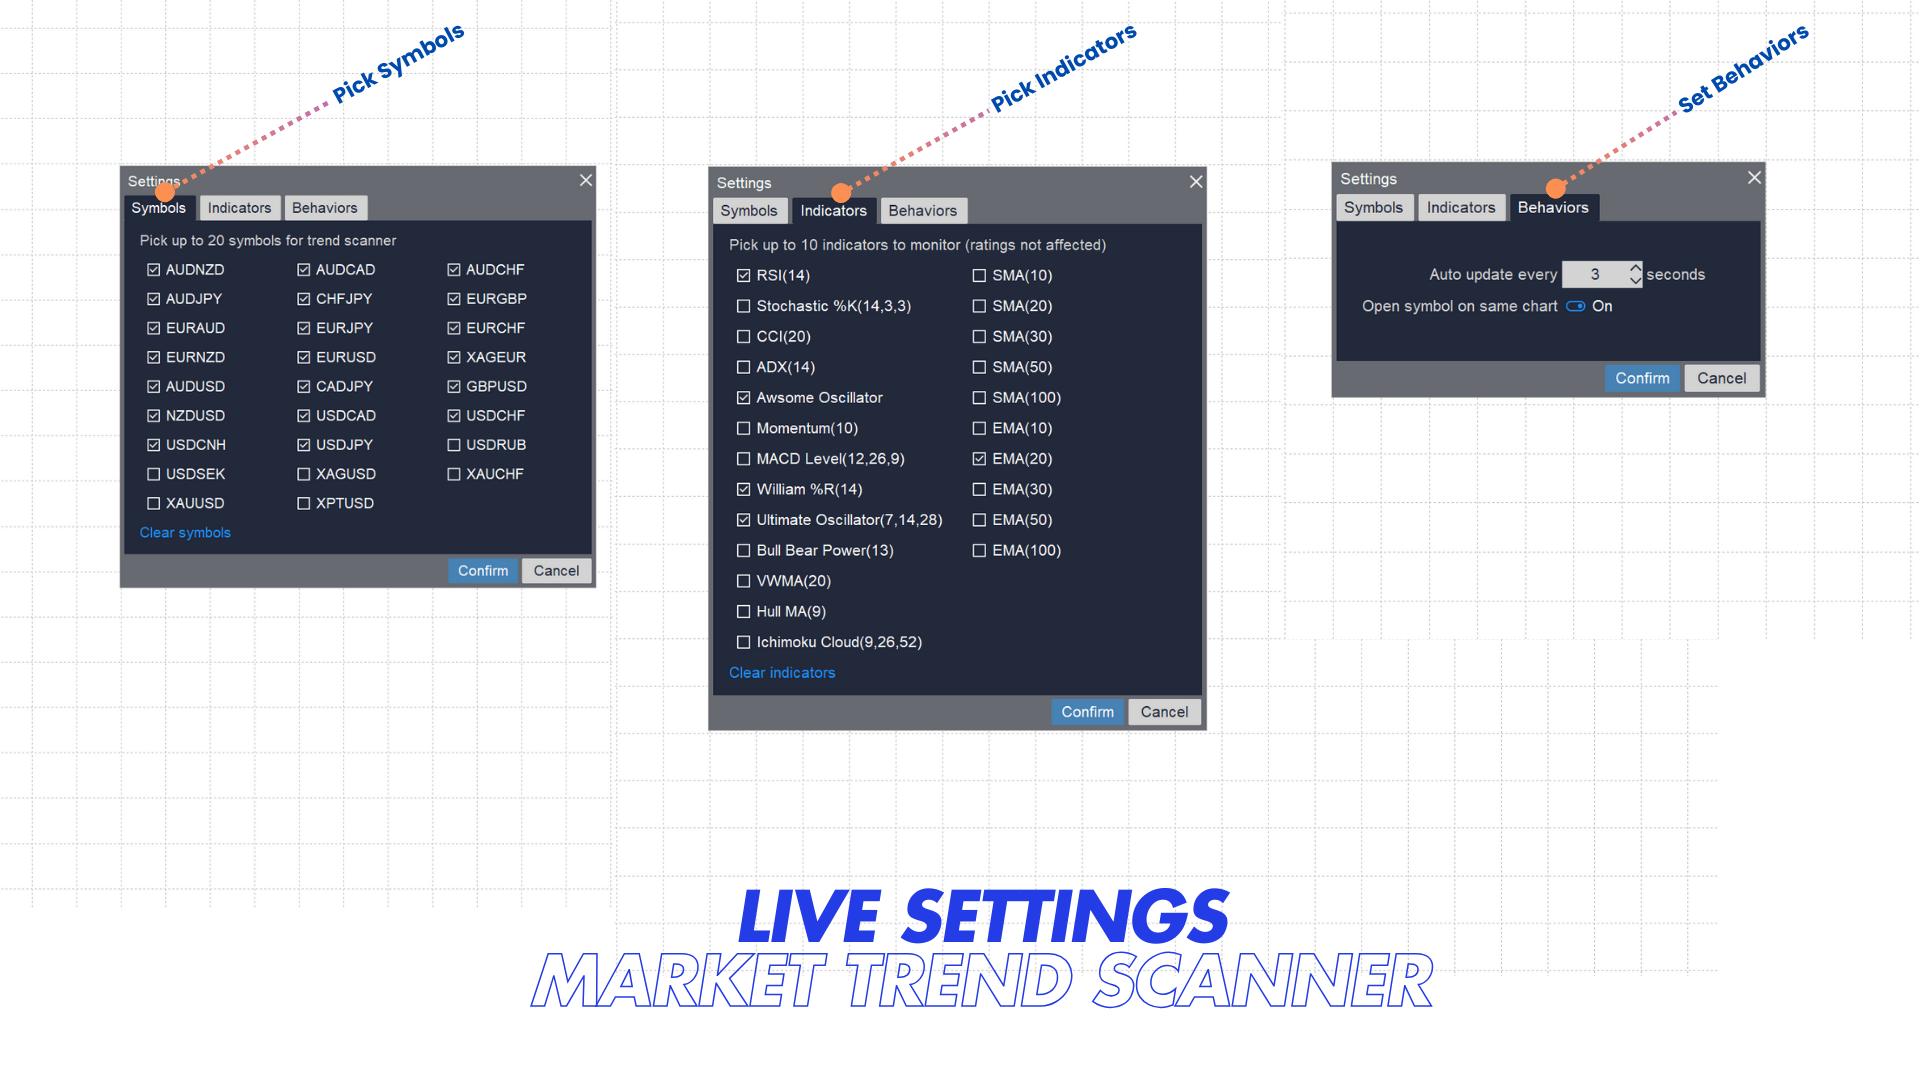
  • You can pick up to 20 symbols to analyze and scan at the same time. Live setting. No pre-setup required!
  • You can switch among all standard chart timeframes to analyze and scan. Live setting. No pre-setup required!
  • You can show up to 10 indicators you prefer to monitor their values/signals on the dashboard but you can't change indicators used for scoring &rating (they are selected and fixed)
  • Analyzed data can be auto-refreshed by interval or manual refreshed. It's up to you!
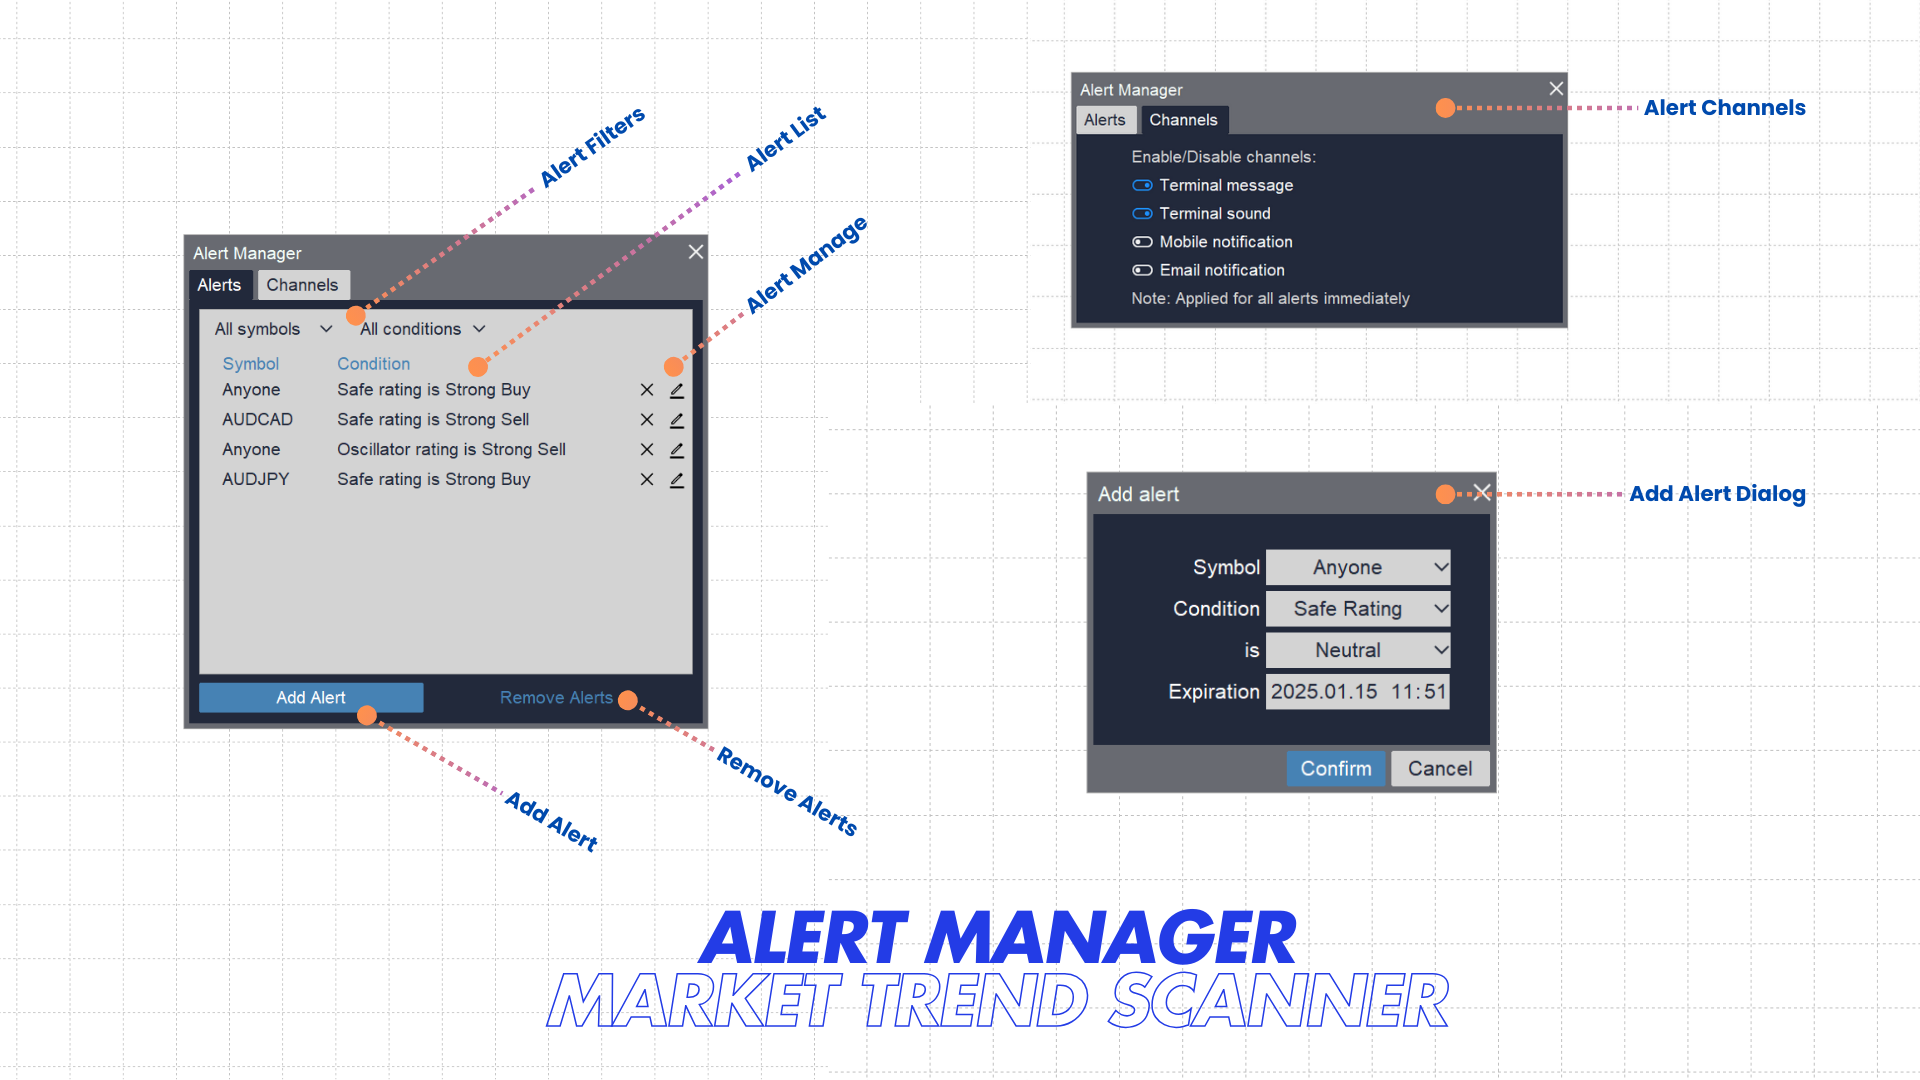
  • You can create alerts and receive alerts via terminal/email/mobile notification with alert manager tool
  • You can easy to save and load you settings with friendly save/load feature
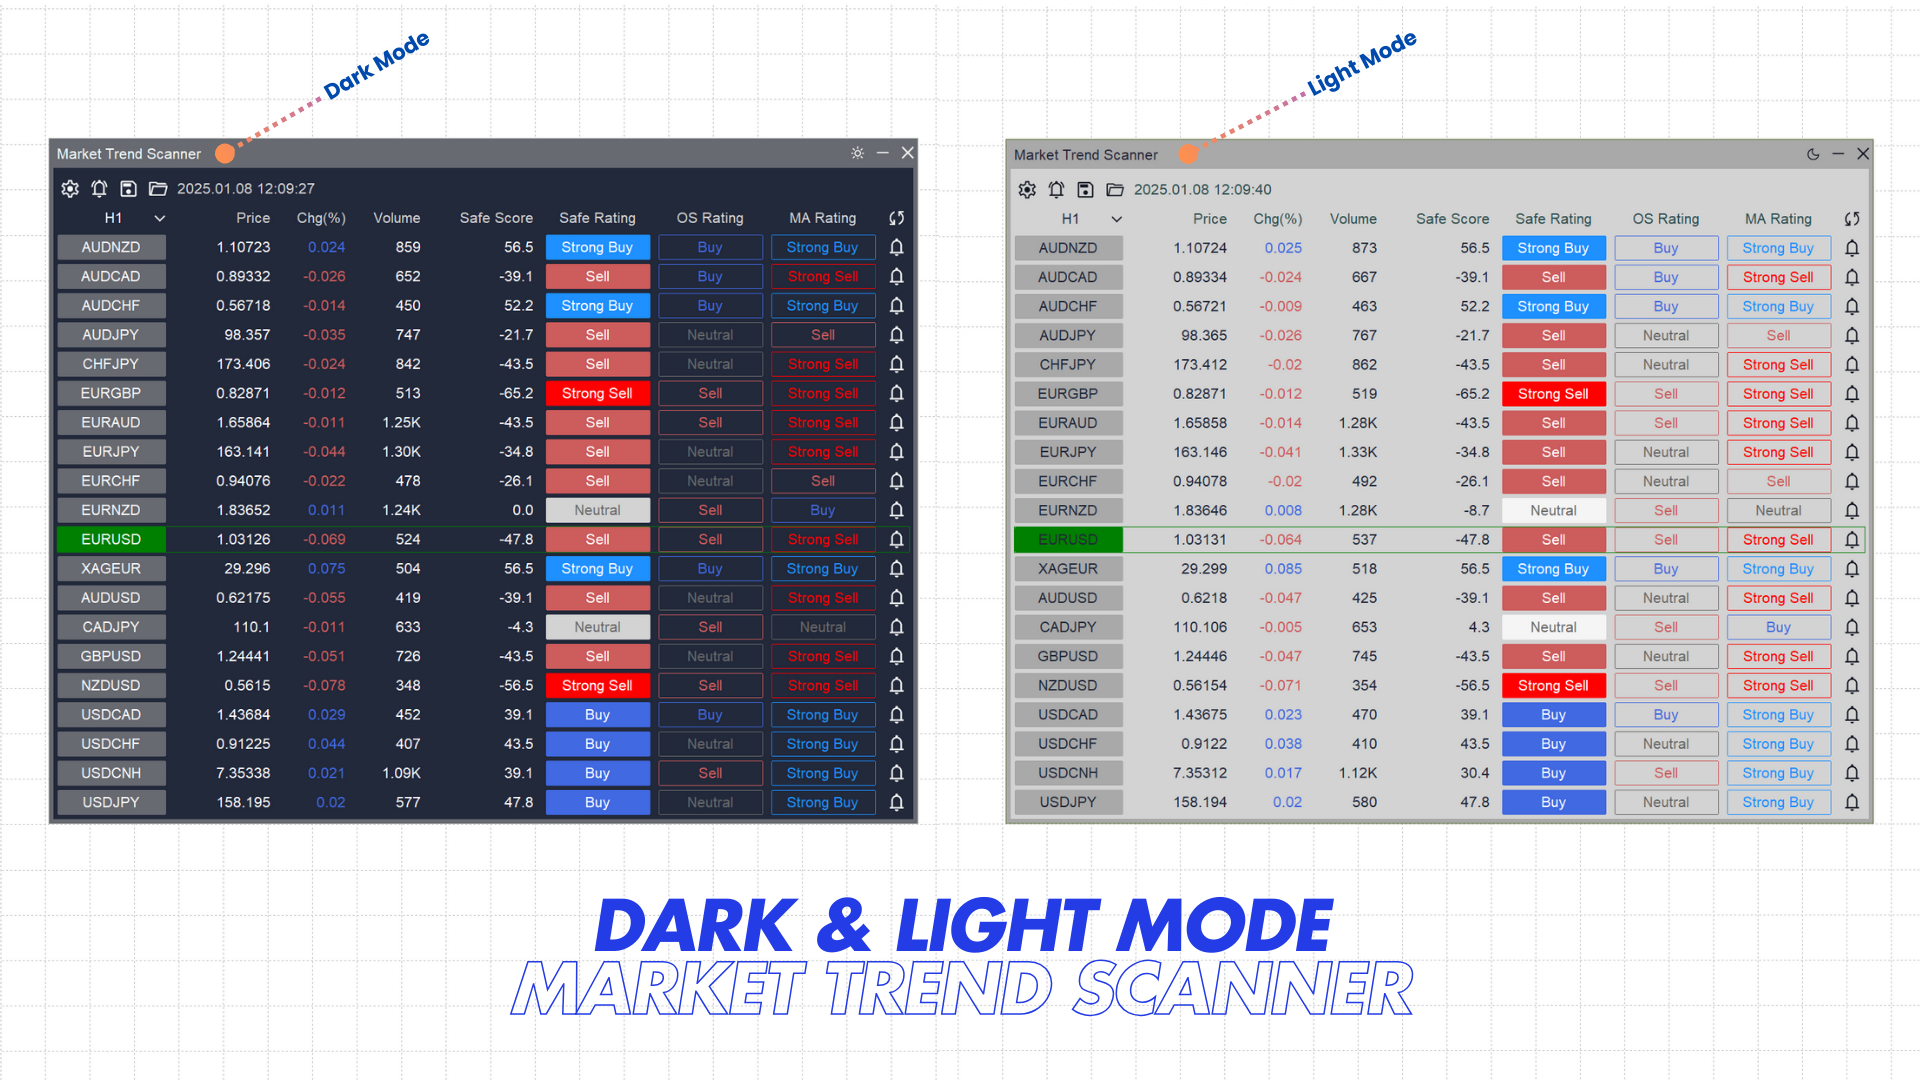
  • There is button in the dashboard to let you able to switch between light and dark mode easily
  • This indicator need to calculate a lot of data for the final signals. Because of that, it just shows the latest signal and don't show historical signals
  • Because of lot of data required for final signal, you may see a fancy effect when attached this indicator into chart or change the timeframe. It looks fabulous!
  • Don't worry about the powerful of your computer, I optimized this indicator carefully so it works smoothly on a typical PC or VPS
  • You can get more details by reading Market Trend Scanner Guidelines

おすすめのプロダクト
Knowledge of the strength and weakness of each currency is vital for every forex trader. Our   Currency Strength Meter indicator   measures the strength of eight major currencies (USD, EUR, GBP, CHF, JPY, CAD, AUD, NZD) by using the Relative Strength Index indicator, also known as RSI. The Currency Strength Meter indicator shows you, simply and quickly, when a currency is oversold, overbought, or in "normal area". This way, you can identify which currency is the strongest and the weakest. Our
A tool for creating Bill Williams indicators Our tool provides the ability to set Bill Williams indicators on a chart with a mouse click. - The Awesome Oscillator (AO) indicator helps to assess the driving force of the trend. - Alligator indicator — determines the current state of the trend and possible entry and exit points. - Fractals indicator — helps to identify significant levels  - Accelerator Oscillator (AC) indicator — shows the change in trend acceleration. - Market Facilitation Index
FREE
Engulfing Pattern Indicator Introducing the Engulfing Pattern Indicator! Are you ready to take your trading strategy to the next level? The Engulfing Pattern Indicator is your ultimate tool to spot powerful market reversals and trends based on the time-tested Engulfing Candlestick Pattern. This indicator is crafted to provide you with actionable insights, but remember: it’s not optimized—you have the freedom to optimize it to suit your trading needs! Why the Engulfing Pattern? The Engulfing Pat
インジケータMTFクリスタリウム矢印は、半自動取引システムであります. これは、すべての通貨ペアで動作します。  インジケータは、三つのルールを使用しています:1)我々は唯一のトレンドで取引、2)"誰もが販売しているときに購入し、誰もが買うときに販売する"、3)価格  インジケータMTF矢印は、内蔵の指標を使用して、複数の時間枠全体のクリスタリウムフィルタルール。 トレンドは、選択した時間間隔で一致した場合、インジケータは、市場に参入するための矢印を与えます。 それからあなた自身の決定をする。 購入する-緑の矢印、売る-赤い矢印。 指標では、ロットを変更したり、EAの取引時間とシャットダウン時間を設定することができます。 また、作業期間と時間フィルタを変更することができます。 ビープ音が鳴ってる  推薦された働く期間D1。 フィルタH1とH4。  設定: TF働く期間(推薦されたD1) Cci_cperiodcomment CCIレベルアップ CCIレベルDn CCI価格 SARステップ SAR最大値 TFのFilter1–(推薦されたH1) TFのFilter2
Simple Japanese candlestick indicator Contains 3 patterns: - bearish engulfing - bullish engulfing - doji Only contains these 3 because after rigorous testing and trading (data) these seem to be the most efficient. Also contains: - alerts if enabled  When japanese candlestick is detected it is colored with relevant color depending on bias, and also shows label next to it. Labels: - BEG = Bearish engulfing - BE = Bullish engulfing - DO = Doji
It is very easy to use the Fibrillar indicator, since the simplest is to look at the chart and act according to the indications of the colored arrows. The algorithm takes into account the measurement of prices, and this method also focuses on measuring each of the price drops (H / C, H / O, LC, LO) - which gives more detailed information, but also more averaged. When calculating this indicator, logarithmic gains are first calculated at the closing price, which allows you to filter out the tren
Timeframes Trend Scanner   is a trend analyzer or trend screener indicator that helps you know the trend in   all timeframes of selected symbol you are watching . This indicator provides clear & detailed analysis results on a beautiful dashboard, let you able to use this result right away without need to do any additional analysis. How it works Step 1: Calculate values of 23 selected & trusted technical indicators (Oscillator & Moving Average indicators) Step 2: Analyze all indicators using bes
Crypto Kong: The Next Generation of Cryptocurrency Trading Crypto Kong is a trailblazing Expert Advisor (EA) for MetaTrader, engineered to conquer the volatile world of cryptocurrency trading with precision and ease. Version 1.15 marks the pinnacle of this robot’s evolution, fulfilling the ambitious goals set across its previous thirteen iterations. This definitive release combines sophisticated automation with a user-centric design, making it an ideal companion for traders seeking to harness t
Hi Traders. The Multi Time Frame (LargeTimeFrame) Candle Indicator is a technical analysis tool used in trading that allows traders to view candlestick patterns from multiple time frames on a single chart. By combining data from different time frames, this indicator helps traders identify trends, reversals, and potential entry or exit points, offering a more comprehensive view of market activity. It aids in confirming signals by providing insights from shorter and longer time frames, helping tra
MT5 Session Indicator: Track Global Market Hours with Precision Boost your trading strategy with this FREE Session Indicator for MetaTrader 5 , designed to help you effortlessly identify active trading sessions across global markets. Perfect for forex, stocks, and commodities traders, this tool highlights key market hours (Asian, European, North American, and overlaps) directly on your chart, ensuring you never miss high-liquidity periods. Key Features: Visual Session Overlays : Clear color-c
FREE
Introducing the Sniper AUDUSD Trading Strategy Sniper AUDUSD is a highly accurate forex trading strategy specifically designed for the AUD/USD currency pair. It leverages advanced technical analysis to identify high-probability entry points, aiming to maximize profits while minimizing risk.  The Sniper AUDUSD strategy uses complex algorithms to analyze and identify trends to generate highly accurate buy and sell signals. Once the signal is activated, the system will automatically execute trades
FREE
Lorentzian AI
Michael Prescott Burney
5 (1)
The Lorentzian A.I Indicator System is designed to enhance trading strategies across Crypto, Indices, Forex, and Stocks by utilizing adaptive algorithms and real-time market analysis. It applies Lorentzian Classification to generate buy and sell signals while integrating K-Nearest Neighbors filtration for data normalization and improved signal reliability. Neural network processing incorporates multidimensional signals with time-space calculations to refine trend forecasting. The system continu
FREE
Xtrade Trend Detector is an indicator capable of finding the best opportunities to take a position in any stock market. Indeed, it is a great tool for scalpers but also for Daytraders. You could therefore use it to identify areas to trade, it fits easily on a chart. I use it to detect trends on Big timeframes and take positions on Small timeframes. Don't hesitate to give me a feedback if you test it.
Range Directional Force Indicator – Designed for You to Optimize! The Range Directional Force Indicator is a cutting-edge tool designed to empower traders by visualizing market dynamics and directional strength. Built to offer insights into market trends and reversals, this indicator is an invaluable asset for traders seeking precision in their strategies. However, it is important to note that this indicator is not optimized, leaving room for you to tailor it to your unique trading preferences.
Identify Engulfing   candle pattern  with Arrows & Alert ( built-in   RSI filter). This indicator helps you to identify Engulfing candle pattern or Outside bar (OB) on the chart with arrows, along with an alert when a new Engulfing candle appears. Engulfing candle pattern is one of the most important reversal Price Action signals. You can choose between standard Engulfing (Engulfing based on candle body) or non standard Engulfing (Engulfing based on candle high - low ) Alerts can be turned on
40% off. Original price: $50 Ichimoku Trend Finder is a multi symbol multi timeframe trend dashboard that helps traders to monitor and identify potential market trends from one chart. This panel scans the Ichimoku Kinko Hyo indicator in 28 configurable instruments and 9 timeframes for classic Ichimoku trend signals with a deep scan feature to scan all market watch symbols (up to 1000 instruments!).     Download Demo here  (Scans only M1 and M6) Settings description   here MT4 version   here
### Introducing the Price Action Ultimate Suite – The Ultimate Trading Tool for Professional Traders! Are you searching for a powerful tool to elevate your Price Action trading strategy? Look no further than the **Price Action Ultimate Suite** – a comprehensive and intelligent indicator for MetaTrader 5 (MT5) – designed to be your trusted partner in conquering the financial markets! Packed with advanced features and user-friendly functionality, this indicator helps you identify key price patte
NeuroExt
Dmytryi Voitukhov
4 (11)
https://t.me/mql5_neuroExt   actual version Signal https://www.mql5.com/ru/signals/1511461 You can use any tool. The bases will be automatically created at the start of the Learn. If you need to start learning from 0 - just delete the base files. Initial deposit - from 200 ye. Options: DO NOT ATTEMPT TO TEST WITHOUT NEURAL NETWORK TRAINING! it is enough for the balance graph after training to be horizontal. generating a training base is extremely simple.  there is a ready-made training for U
FREE
This is the famous Sunflower indicator for Metatrader5. This indicator marks possible tops and bottoms on price charts. The indicator identifies tops and bottoms in the asset's price history, keep in mind that the current sunflower of the last candle repaints, as it is not possible to identify a top until the market reverses and it is also not possible to identify a bottom without the market stop falling and start rising. If you are looking for a professional programmer for Metatrader5, please
RSI / TDIアラートダッシュボードを使用すると、取引するすべての主要ペアでRSIを一度に(ユーザーが選択可能に)監視できます。 次の2つの方法で使用できます。 1.複数の時間枠を選択すると、通常の取引条件を超えて延長された複数の時間枠がある場合にダッシュが表示されます。複数の時間枠にわたって買われ過ぎまたは売られ過ぎのレベルを達成したため、価格が最近激しく押し上げられたため、引き戻しまたは逆転が間もなく行われることを示す優れた指標です。 2. 1つの時間枠(トレードするのが好き)と複数のRSIレベルを使用して、その時間枠でのRSIの延長の強さを示します。これは、価格が一方向に非常に長く押し込まれ、市場が利益を得ることになっている場合に、平均回帰取引を行うための優れた戦略です。スクリーンショットの例では、H4 RSIが25レベルを超えて2ペアで拡張されていることがわかります。これは、通常の価格アクションよりもはるかに遠いため、長く行く良い機会です。 ダッシュボードは、選択した時間枠でろうそくが閉じたときに、選択したレベルでの延長された状態(買われ過ぎと売られ過ぎ)を警告
HiperCube VIX へようこそ Darwinex Zero 25%割引コード: DWZ2328770MGM この指標は、sp500 / us500 の市場のボリュームに関する実際の情報を提供します 定義 CBOE ボラティリティ インデックスとして知られる HiperCube VIX は、市場の恐怖やストレスを測る広く認知された指標です。株式市場の不確実性とボラティリティのレベルを示し、S&P 500 インデックスを広範な市場の代理として使用します。VIX インデックスは、S&P 500 インデックスのオプション契約の価格に基づいて計算されます。 機能: カスタムカラー カスタムチャートカラー メイングラフを明瞭に保つためにサブウィンドウにインジケーターを表示 解釈が簡単 完全にカスタマイズ可能 Chat gptとAIが開発に使用されました 使用例: VIX は実際の市場に関する優れた情報を提供するボリュームインジケーターです。このインジケーターの値が高いということは、ボラティリティが高いことを意味します ボラティリティが高いということは、市場の動きにアプローチし、市場
FREE
MultiFrame Trend Detector: Advanced Forex Trend Analysis Indicator The MultiFrame Trend Detector is a powerful MetaTrader 5 indicator that provides traders with comprehensive trend analysis across multiple timeframes. By dynamically adjusting trend thresholds based on the relationship between timeframes, the MultiFrame Trend Detector delivers reliable and consistent trend detection for all Forex pairs and precious metals. Key Features Custom Timeframe Analysis : Analyze trends across multiple, u
Currency Magician Matrixインジケーターとは何ですか? Currency Magician Matrixインジケーターは、通貨の強さを示すグラフィカルなツールです。一般的なインジケーターは通常、通貨の強さを他の通貨との関係で表示しますが、いくつかの計算を行うことで各個別通貨の絶対的な強さを見つけることができます。 したがって、Currency Magician Matrixインジケーター(またはメーター)は、通貨の絶対的な強さを表現し、他の通貨の強さと比較できるツールです。 通貨の絶対的な強さを計算する方法はさまざまありますが、通常、他のインジケーターのすべての値を考慮して抽出しようとします。 つまり、たとえばJPYの強さを計算するためには、アルゴリズムがJPYを含むすべてのペアで同じインジケーターの値を分析します。 この概念は、Currency Magician Matrixに新しい場合は少し混乱するかもしれませんが、心配しないでください。さらに読んでいくことで理解できます。 Currency Magician Matrixは、8つの主要通貨の強さを測定するため
Description The Profit and Loss Indicator by Creative Tech Solutions is a robust and comprehensive tool designed to help traders monitor their trading performance in real-time. This indicator provides detailed metrics on profits and drawdowns, ensuring traders are always informed about their trading activities and performance. With customisable alerts and display settings, this indicator is an essential tool for any serious trader. Features Real-Time Metrics : Monitor profit and drawdown percent
FREE
Dominant Candle Finder is a significant candlestick on a price chart that stands out due to its size, volume, or price movement compared to surrounding candles. It often indicates strong buying or selling pressure and can be used to identify potential reversal points, breakouts, or continuations in the market. Dominant candles can serve as key indicators for traders to make informed decisions, providing insights into market sentiment and potential future price movements. MT4 Version -  https://w
Go Binary
Fabio Oliveira Magalhaes
The main idea of this product is to generate statistics based on signals from 5 different strategies for the Binary Options traders, showing how the results would be and the final balance based on broker's payout. Strategy 1: The calculation is secret. Strategy 2: The signal is based on a sequence of same side candles (same color). Strategy 3: The signal is based on a sequence of interspersed candles (opposite colors). Strategy 4: The signal consists of the indicators bollinger (we have 3 type
The Supertrend Multicurrency Scanner Dashboard MT5 is a powerful tool designed to monitor multiple currency pairs and timeframes using the Supertrend indicator. It organizes signals in a grid format, displaying each symbol’s trend status across timeframes from M1 to MN1. Traders can enable or disable specific timeframes to align with their strategies. You can find the MT4 version here    Supertrend  Multicurrency  Scanner  MT4   For detailed documentation click here Supertrend Integration: The d
Combination of Ichimoku and Super Trend indicators, with Signals and live notifications on Mobile App and Meta Trader Terminal. Features: Display five reliable signals of ARC Ichimoku Filter signals by their strength level (strong, neutral, weak) Send live notifications on Mobile App and Meta Trader terminal S ignals remain consistent without repainting Applicable across all time-frames Suitable for all markets Notifications format: "ARC Ichimoku | XAUUSD | BUY at 1849.79 | Tenken-Kijun cross |
PipFinite Exit EDGE MT5
Karlo Wilson Vendiola
4.86 (29)
Did You Have A Profitable Trade But Suddenly Reversed? In a solid strategy, exiting a trade is equally important as entering. Exit EDGE helps maximize your current trade profit and avoid turning winning trades to losers. Never Miss An Exit Signal Again Monitor all pairs and timeframes in just 1 chart www.mql5.com/en/blogs/post/726558 How To Trade You can close your open trades as soon as you receive a signal Close your Buy orders if you receive an Exit Buy Signal. Close your Sell orders if
Currency Strength Dynamic 通貨強さのダイナミックは通貨の強さを示す指標です。 通貨の強さは、通貨が含まれるほとんどまたはすべての通貨ペアのトレンドの方向を指します。 この指標は、MACD 指標と同様に、28 の最も人気のある通貨ペア (メジャー通貨ペアとマイナー通貨ペア) の移動平均間の差の測定値に基づいています。 利点 独自の振動計算法 特定の通貨の明細を無効または有効にするボタンの利用可能性 情報テーブル 2 種類のアラート: インジケーターのラインが交差したときと、ラインが指定されたレベルを交差したとき。 描画されるバーの数はオプションです。 各ポイントを詳しく見てみましょう。 独自の振動計算方法により、インジケーターが長時間最大値に留まらず、発散と収束のよく知られた効果と同様に、事前に最大値から抜け出すことができます。 この方法には、指定された計算期間と読み取り値をより滑らかにする平滑化レベルも含まれます。 計算には無駄な計算式や冗長な計算式が含まれないため、端末への負荷が軽減されます。 特定の通貨の行を無効または有効にするボタンがあることは、
このプロダクトを購入した人は以下も購入しています
MonetTrend — Премиум-индикатор для торговли по тренду (M30, H1, H4) MonetTrend — это мощный и визуально понятный трендовый индикатор, созданный для торговли на таймфреймах M30, H1 и H4. Он идеально подходит для работы с волатильными инструментами, такими как: • Золото (XAUUSD) • Криптовалюты (BTCUSD) • Валютные пары (EURUSD, USDJPY и др.) Ключевые особенности MonetTrend: • Автоматическое отображение Take Profit 1 (TP1) и Stop Loss (SL): После появления сигнала индикатор сразу показывает: • TP
反転ゾーン / ピークボリューム / 主要プレーヤーのアクティブゾーン =       TS TPSプロシステム 説明書 RUS       /       説明書     英語     /           バージョン MT4        このインジケーターを購入したすべての購入者は、さらに以下を無料で受け取ります: RFI SIGNALS サービスからの取引シグナルへの 6 か月間のアクセス - TPSproSYSTEM アルゴリズムに従った既製のエントリ ポイント。 定期的に更新されるトレーニング資料 - 戦略に没頭し、プロフェッショナル レベルを高めます。 平日は 24 時間 365 日サポート、非公開のトレーダー チャットへのアクセス - コミュニケーション、サポート、市場状況の分析。 著者の設定ファイル - 余分な労力をかけずに最大の結果を達成するための自動インジケーター設定。 主な機能: 売り手と買い手のアクティブなゾーンを表示します。 このインジケーターは、購入と販売の正しい最初のインパルス レベル/ゾーンをすべて表示します。これらのレベル/ゾーンがアクティブに
NOTE: CYCLEMAESTRO is distributed only on this website, there are no other distributors. Demo version is for reference only and is not supported. Full versione is perfectly functional and it is supported. CYCLEMAESTRO , the first and only indicator of Cyclic Analysis, useful for giving signals of TRADING, BUY, SELL, STOP LOSS, ADDING. Created on the logic of   Serghei Istrati   and programmed by   Stefano Frisetti ;   CYCLEMAESTRO   is not an indicator like the others, the challenge was to inter
今、147ドル(いくつかの更新後に499ドルに増加します) - 無制限のアカウント(PCSまたはMac) RelicusRoad ユーザー マニュアル + トレーニング ビデオ + プライベート Discord グループへのアクセス + VIP ステータス 市場の新しい見方 RelicusRoad は、外国為替、先物、暗号通貨、株式、および指数の世界で最も強力な取引インジケーターであり、トレーダーに収益を維持するために必要なすべての情報とツールを提供します。初心者から上級者まで、すべてのトレーダーが成功するためのテクニカル分析と取引計画を提供します。これは、将来の市場を予測するのに十分な情報を提供する重要な取引指標です。意味をなさないチャート上のいくつかの異なる指標ではなく、完全な解決策を信じています.これは、信号、矢印 + 価格アクション情報を表示するオールインワンのインジケーターで、他に類を見ない非常に正確です。 強力な AI に基づいて、RelicusRoad は不足している情報とツールを提供して、あなたを教育し、トレーディングのプロ、成功したトレーダーにします。 ほと
MetaForecast M5
Vahidreza Heidar Gholami
5 (3)
MetaForecastは、価格データのハーモニクスに基づいて、どんな市場の未来を予測し視覚化します。市場が常に予測可能ではありませんが、価格にパターンがある場合、MetaForecastは可能な限り正確な未来を予測できます。他の類似製品と比較して、MetaForecastは市場のトレンドを分析することでより正確な結果を生成することができます。 入力パラメータ Past size (過去のサイズ) MetaForecastが将来の予測を生成するために使用するバーの数を指定します。モデルは選択したバー上に描かれた黄色の線で表されます。 Future size (将来のサイズ) 予測すべき将来のバーの数を指定します。予測された将来は、ピンクの線で表示され、その上に青い回帰線が描かれます。 Degree (程度) この入力は、MetaForecastが市場で行う分析のレベルを決定します。 Degree 説明  0 Degree 0の場合、価格の全てのピークや谷、そして詳細をカバーするために、「Past size」の入力に大きな値を使用することが推奨されています。  1 (推奨) Degre
MONEYTRON – ТВОЙ ЛИЧНЫЙ СИГНАЛ НА УСПЕХ! XAUUSD | AUDUSD | USDJPY | BTCUSD Поддержка таймфреймов: M5, M15, M30, H1 Почему трейдеры выбирают Moneytron? 82% успешных сделок — это не просто цифры, это результат продуманной логики, точного алгоритма и настоящей силы анализа. Автоматические сигналы на вход — не нужно гадать: когда покупать, когда продавать. 3 уровня Take Profit — ты сам выбираешь свой уровень прибыли: безопасный, уверенный или максимум. Четкий Stop Loss — контролируешь риск
CBT Quantum Maverick 高効率バイナリーオプション取引システム CBT Quantum Maverickは、高いパフォーマンスとシンプルさを追求するトレーダー向けに設計されたバイナリーオプション取引システムです。カスタマイズの必要がなく、最適化された状態で使用を開始できます。シグナルに従うだけで、少しの練習でマスターできます。 主な特徴: シグナルの精度: 現在のローソク足を基に次のローソク足の取引シグナルを生成し、頻繁な再描画がありません。 多様な市場対応: バイナリーオプション取引に特化し、さまざまなブローカーや資産クラスに対応しています。 対応可能: Deriv Synthetic Charts :すべてのタイムフレームで使用可能。 OTCチャート :Quotex、PocketOption、Binomo、Stockity、IQOption、Exnova、OlympTrade、Deriv、Binolla、Homebrokerなどのブローカーに対応。MT5へのインポートは最初の1週間無料、その後は有料サービス。 FX、仮想通貨、商品市場 :幅広い資産利用が可能
収益性の高い取引機会を簡単に特定するのに役立つ強力な外国為替取引インジケーターをお探しですか?ビースト スーパー シグナル以外に探す必要はありません。 この使いやすいトレンドベースのインジケーターは、市場の状況を継続的に監視し、新しいトレンドを検索したり、既存のトレンドに飛びついたりします。ビースト スーパー シグナルは、すべての内部戦略が一致し、互いに 100% 合流したときに売買シグナルを発するため、追加の確認は不要です。シグナル矢印アラートを受け取ったら、単に売買します。 購入後、プライベート VIP グループに追加されるようにメッセージを送ってください! (完全な製品購入のみ)。 購入後、最新の最適化されたセット ファイルについてメッセージを送ってください。 MT4版は こちらから。 Beast Super Signal EA は こちらから 入手できます。 コメント セクションをチェックして、最新の結果を確認してください。 ビースト スーパー シグナルは、1:1、1:2、または 1:3 のリスクと報酬の比率に基づいて、エントリー価格、ストップ ロス、テイク プ
IQ Gold Gann Levels a non-repainting, precision tool designed exclusively for XAUUSD/Gold intraday trading. It uses W.D. Gann’s square root method to plot real-time support and resistance levels, helping traders spot high-probability entries with confidence and clarity. William Delbert Gann (W.D. Gann) was an exceptional market analyst, whose trading technique was based on a complex blend of mathematics, geometry, astrology, and ancient mathematics which proved to be extremely accurate. Download
The Naveen Dynamic Square  MT5  is one of the best known  technical analysis tools  inspired  by WD Gann along with the Gann Fan and Gann Box. It is considered a cornerstone of his trading technique that is based on time and price symmetry. The Naveen Dynamic Square MT5   is a powerful tool in finance for determining support and resistance levels based on a stock's extreme price points. It works by extrapolating probable price levels from a central value, typically an all-time or cyclical high o
WHY IS OUR FXACCCURATE LS MT5 THE PROFITABLE ? PROTECT YOUR CAPITAL WITH RISK MANAGEMENT Gives entry, stop and target levels from time to time. It finds Trading opportunities by analyzing what the price is doing during established trends. POWERFUL INDICATOR FOR A RELIABLE STRATEGIES We have made these indicators with a lot of years of hard work. It is made at a very advanced level. Established trends provide dozens of trading opportunities, but most trend indicators completely ignore them! The
これはほぼ間違いなく、MetaTraderプラットフォームで見つけることができる最も完全な調和価格形成自動認識インジケーターです。 19種類のパターンを検出し、フィボナッチプロジェクションをあなたと同じように真剣に受け止め、潜在的逆転ゾーン(PRZ)を表示し、適切なストップロスとテイクプロフィットレベルを見つけます。 [ インストールガイド | 更新ガイド | トラブルシューティング | よくある質問 | すべての製品 ] 19の異なる調和価格形成を検出します プライマリ、派生および補完フィボナッチ投影(PRZ)をプロットします 過去の価格行動を評価し、過去のすべてのパターンを表示します この指標は、独自の品質とパフォーマンスを分析します 適切なストップロスとテイクプロフィットのレベルを表示します ブレイクアウトを使用して適切な取引を通知します すべてのパターン比をグラフにプロットします 電子メール/音声/視覚アラートを実装します スコット・M・カーニーの本に着想を得て、この指標は最も純粋で急を要するトレーダーのニーズを満たすように設計されています。ただし、トレードを容易にする
プレシジョン・インデックス・オシレーター(Pi-Osc)は、Precision Trading SystemsのRoger Medcalfによるものです。 バージョン2は、チャートにスーパーファストでロードされるように注意深く再コードされ、その他の技術的な改良も組み込まれて、エクスペリエンスを向上させています。 Pi-Oscは、市場が強制的に行かなければならない、すべての人のストップを取り除くためのポイントである、極限のエクソースト・ポイントを見つけるために設計された正確な取引タイミング信号を提供するために作成されました。 この製品は、極限のポイントがどこにあるかを知るという古代の問題を解決し、トレーダーの生活をはるかにシンプルにします。 これは、業界標準のオシレーターとは異なる強力な要素を持つ高度なコンセンサス・インジケーターです。 使用されている一部の機能には、需要指数、マネーフロー、RSI、スティリング、パターン認識、出来高分析、標準偏差の極値などがあり、異なる長さでこれらのバリエーションが多く含まれています。 初めて見ると、訓練されていない目には、他のオシレーター
回帰取引を意味する専門的かつ定量的なアプローチを実装する独自の指標。これは、価格が予測可能かつ測定可能な方法で迂回して平均に戻るという事実を利用しており、非定量的な取引戦略を大幅に上回る明確な出入りルールを可能にします。 [ Installation Guide | Update Guide | Troubleshooting | FAQ | All Products ] 明確な取引シグナル 驚くほど簡単に取引できます カスタマイズ可能な色とサイズ パフォーマンス統計を実装します ほとんどの取引戦略を上回ります 適切なSLおよびTPレベルを表示します 電子メール/音声/視覚アラートを実装します 使い方 インディケータは、より高い時間枠からの完全にカスタマイズ可能な移動平均の周りの標準偏差を測定し、トレンドフォローアプローチを使用して正確に取引を見つけます。取引は、現在のチャートの価格アクションに飛び込むことによって見つけられ、価格が選択したより高い時間枠から計算された平均価格帯に戻ったときに閉じられます。それがコード化される方法のために、指標は高ボラティリティと強いトレンドの市場か
The   Time_Price_SQ9_Degree   indicator is based on the 9 Gann square. Using this indicator, you can identify strong time and price zones. The indicator displays the levels as a degree value. The degrees can be set in the settings. After launching, the MENU button appears. If it is highlighted, it can be moved to any point on the graph, and after double-clicking on it, it stops being highlighted and menu buttons appear. To hide the menu, just double-click on the button, it will become highlight
説明 ICSM(Impulse-Correction SCOB Mapper)は、価格の動きを分析し、有効なインパルス、修正、およびSCOB(Single Candle Order Block)を識別するインジケーターです。柔軟性があり、情報量が多く、使いやすく、最も流動性の高い関心領域に対するトレーダーの認識を大幅に向上させるため、あらゆるタイプのテクニカル分析で使用できる強力なツールです。 設定 一般 | ビジュアル カラーテーマ — ICSMのカラーテーマを定義します。 SCOB | ビジュアル SCOBを表示 — SCOBを有効/無効にします; SCOBをマークする — SCOB表現のスタイルオプションのリストを表します; SCOB色 — SCOBの色を定義します; ICM | ビジュアル ICMラインを表示 — ICM(Impulse-Correction Mapper)ラインを有効/無効にします; ICトレンドを表示 — チャートの下部にある色付きの仕切りを通じてインパルス-修正トレンドの視覚化を有効/無効にします; ライン色 — ICMラインの色
TPA True Price Action indicator reveals the true price action of the market makers through 100% non-repainting signals strictly at the close of a candle! TPA shows entries and re-entries, every time the bulls are definitely stronger than the bears and vice versa. Not to confuse with red/green candles. The shift of power gets confirmed at the earliest stage and is ONE exit strategy of several. There are available now two free parts of the TPA User Guide for our customers. The first "The Basics"
The AT Forex Indicator MT5 is a sophisticated trading tool designed to provide traders with a comprehensive analysis of multiple currency pairs. This powerful indicator simplifies the complex nature of the forex market, making it accessible for both novice and experienced traders. AT Forex Indicator uses advanced algorithms to detect trends, patterns and is an essential tool for traders aiming to enhance their forex trading performance. With its robust features, ease of use, and reliable signal
[ MT4 Version ]  [ Order Blocks ]  [ Kill Zones ]  [ SMT Divergences ] How to trade using Order Blocks :  Click here User Interface Performance:  During testing in the strategy tester, the UI may experience lag. Rest assured, this issue is specific to the testing environment and does not affect the indicator's performance in live trading. Elevate your trading strategy with the  Order Blocks ICT Multi TF  indicator, a cutting-edge tool designed to enhance your trading decisions through advanced o
[ MT4 Version ]  [ Kill Zones ]  [ SMT Divergences ] How to trade using Order Blocks:  Click here User Interface Performance:  During testing in the strategy tester, the UI may experience lag. Rest assured, this issue is specific to the testing environment and does not affect the indicator's performance in live trading. Elevate your trading strategy with the  Order Blocks ICT Multi TF  indicator, a cutting-edge tool designed to enhance your trading decisions through advanced order block analysis
Visual Heatmap Book Analyser This indicator monitors the market liquidity and generates colors based on order patterns, quantities, and renewal activities in the book. This allows you to visualize the order flow and identify areas of high and low liquidity and activity. The indicator uses machine learning techniques to analyze the order behavior in the book, enabling it to detect patterns and trends in orders, allowing you to make informed decisions about your trading operations. The color pale
MT4 Version SMT Divergences MT5 SMT Divergences is one of the most innovative indicators in the market. It offers the possibility of analyzing price divergences between 2 pairs. These divergences highlight and help to foresee what banks and institutions are planning to do. SMT divergences also provides you with a kill zones indicator and the possibility of filtering divergences occurring during these kill zones.  This indicator is specially powerful if applied in 2 highly correlated pairs. A pri
Pro Thunder V10: バイナリーオプション取引の究極のインジケーター! Pro Thunder V10 で取引を次のレベルへ引き上げましょう!最先端の ニューラルネットワークAI技術 に基づいたこの革新的なインジケーターは、比類のない精度と信頼性を提供するよう設計されています。リアルタイムの非リペイント信号から、変動する市場条件でもシームレスなパフォーマンスまで、 Pro Thunder V10 はあなたの取引における究極のパートナーです。 主な特徴: 圧倒的な精度: 高精度の信号で市場を制覇。重要なニュースイベントを含むあらゆる市場状況で実証済み。 OTC対応: OlympTrade、Pocket Option、Quotex、Binomo、IQ Option などのプラットフォームで完璧に動作。 MT5専用: 最も先進的な取引プラットフォームである MetaTrader 5 のために特別に設計されています。 パフォーマンスダッシュボード: 勝敗や信号を直感的に追跡できる使いやすい画面。 永久アクセス: 一度の購入で、すべてのアップデートに生涯アク
How to use Pair Trading Station Pair Trading Station is recommended for H1 time frame and you can use it for any currency pairs. To generate buy and sell signal, follow few steps below to apply Pair Trading Station to your MetaTrader terminal. When you load Pair Trading Station on your chart, Pair Trading station will assess available historical data in your MetaTrader platforms for each currency pair. On your chart, the amount of historical data available will be displayed for each currency pai
Reversal ALGO
Muhammad Abdullah Bhatti
Reversal Algo は、市場のトレンド転換点を特定するために設計された高度なテクニカル指標です。過去の価格データを詳細に分析し、トレンドの変化を示唆する重要な高値と安値を検出します。チャート上に明確な視覚シグナルを提供し、トレーダーが転換点となる可能性のある重要なエリアを特定できるようにします。 主な特徴 重要な価格レベルの検出: Reversal Algo は過去の価格データをスキャンし、市場ノイズを排除しながら、統計的に重要な高値・安値を特定します。 高度なノイズフィルター: ボラティリティに基づいたフィルターを使用し、小さな価格変動による誤ったシグナルを最小限に抑えます。 カスタマイズ可能なパラメータ: 感度や閾値を調整できるため、トレードスタイルや市場環境に応じて最適化が可能です。 強力なデータ分析: 過去の価格データを幅広く分析し、市場の動向を把握するための有益な情報を提供します。 仕組み 極値レベルの分析: 市場の高値・安値を詳細に評価し、ボラティリティ閾値を適用することで、重要な価格変動のみを抽出します。 シグナルの確認: 他のテクニカル指標(オシレー
Offer 249 down from 350 for the next 1 copies. then back to 350 $ Are you tired of using outdated indicators that leave you guessing where to set your profit targets? Look no further than the AK CAP Opening Range Breakout Indicator. This powerful tool is backed by a US patent and has already helped countless traders pass funded challenges like FTMO. We use it daily on our prop traders and internal funds, and now it's available to you as well. The calculation behind the indicator is incredibly a
IQ FX Gann Levels a precision trading indicator based on W.D. Gann’s square root methods. It plots real-time, non-repainting support and resistance levels to help traders confidently spot intraday and scalping opportunities with high accuracy. William Delbert Gann (W.D. Gann) was an exceptional market analyst, whose trading technique was based on a complex blend of mathematics, geometry, astrology, and ancient mathematics which proved to be extremely accurate. Download the Metatrader 4 Version M
トレンドトレーディング は、タイミングのプルバックとブレイクアウトにより、市場で起こっているトレンドから可能な限り利益を得るように設計された指標です。確立されたトレンドの中で価格が何をしているかを分析することにより、取引の機会を見つけます。 [ インストールガイド | 更新ガイド | トラブルシューティング | よくある質問 | すべての製品 ] 自信を持って効率的に金融市場を取引する むち打ちにならずに確立されたトレンドから利益を得る 収益性の高いプルバック、ブレイクアウト、早期の逆転を認識する この指標は、独自の品質とパフォーマンスを分析します 複数時間枠のダッシュボードを実装します インジケーターは再描画されていません 電子メール/音声/視覚アラートを実装します 確立されたトレンドは多くの取引機会を提供しますが、ほとんどのトレンド指標はそれらを完全に無視しています。インジケーターの解釈はかなり簡単です: (1) トレンドの変化 (2) トレンドの方向への後退 (3) トレンドの方向へのブレイクアウト 赤いダッシュ は下降トレンド中の修正です 青いダッシュ は上昇トレンド中
Super Zone   For several years of observing the principles of the market, Super Zone worked, both then and now, because the indicator  allows you to see the trading range of the  week and even the month that major market participants use. It’s very easy to use, we work on H4 in the weekly range (  in the tester it doesn’t work in the demo mode  ) - we sell from the upper zones, we buy from the lower ones. It marks the zones from the beginning of the week (month) that are  not redrawn  , works on
Berma Bands
Muhammad Elbermawi
5 (3)
Berma Bands (BBs) インジケーターは、市場のトレンドを特定して活用したいトレーダーにとって貴重なツールです。価格と BBs の関係を分析することで、トレーダーは市場がトレンド段階にあるか、レンジ段階にあるかを判断できます。 詳細については、[ Berma Home Blog ] をご覧ください。 バーマ バンドは、上部バーマ バンド、中部バーマ バンド、下部バーマ バンドの 3 つの異なる線で構成されています。これらの線は価格の周りにプロットされ、全体的な傾向に対する価格の動きを視覚的に表します。これらのバンド間の距離から、ボラティリティや潜在的な傾向の反転についての洞察を得ることができます。 バーマ バンドの線がそれぞれ離れると、市場が横ばいまたはレンジ相場の期間に入っていることを示すことがよくあります。これは、明確な方向性の偏りがないことを示しています。トレーダーは、これらの期間中にトレンドを特定するのが難しいと感じる可能性があり、より明確なトレンドが出現するまで待つ場合があります。 バーマ バンドの線が 1 本の線に収束すると、強いトレンド環境の兆候となること
作者のその他のプロダクト
Just another   Auto Fibonacci Retracement indicator . However, this is the most   Flexible   &   Reliable   one you can find for FREE. If you use this indicator and you like it, please leave a review/comment. If you just looking for a powerful indicator, please check this   Timeframes Trend Scanner indicator ### FEATURES ### Auto-calculate up to 7 Fibonacci levels on your customized frame. Adjust levels as your need. Use High/Low price or  Open/Close price to calculate. Freeze the levels and don
FREE
Timeframes Trend Scanner   is a trend analyzer or trend screener indicator that helps you know the trend in   all timeframes of selected symbol you are watching . This indicator provides clear & detailed analysis results on a beautiful dashboard, let you able to use this result right away without need to do any additional analysis. How it works Step 1: Calculate values of 23 selected & trusted technical indicators (Oscillator & Moving Average indicators) Step 2: Analyze all indicators using bes
Ruler  is important but just a simple tool. Why people make it too complex? Easy Ruler makes it great again. Almost zero setup required, nothing annoying on chart, quick and accurate. Easy Ruler MT5  just help you measure 2 points on chart quickly and accurate. That's all! To support you better, it has magnet mode to pick points more accurate and works on indicator windows too (38 indicators that provided by MT5 by default). This smart ruler provides these information right on chart in no time t
T he most   Flexible   &   Reliable   Trend-Based Fibonacci indicator   by Safe Trading. This indicator helps you calculate Trend-Based Fibonacci levels base on   the main and retracement trends to predict future price . If you just looking for a powerful indicator, please check this   Timeframes Trend Scanner indicator ### FEATURES ### Auto-calculate up to 7 Trend-Based Fibonacci levels on adjustable frame. Adjust Fibonacci levels as your need. Adjust the start and the end of calculated frame i
FREE
Just another Auto Fibonacci Retracement indicator . However, this is the most Flexible & Reliable one you can find for FREE. If you use this indicator and you like it, please leave a review/comment. If you just looking for a powerful indicator, please check this   Timeframes Trend Scanner indicator ### FEATURES ### Auto-calculate up to 7 Fibonacci levels on your customized frame. Adjust levels as your need. Use   High/Low price or  Open/Close price to calculate. Freeze the levels and don't recal
FREE
The most Flexible & Reliable   Trend-Based Fibonacci indicator by Safe Trading. This indicator helps you calculate Trend-Based Fibonacci levels base on the main and retracement trends to predict future price . If you just looking for a powerful indicator, please check this   Timeframes Trend Scanner indicator ### FEATURES ### Auto-calculate up to 7 Trend-Based Fibonacci levels on adjustable frame. Adjust Fibonacci levels as your need. Adjust the start and the end of calculated frame in indicator
FREE
Easy Toolbar is a user-friendly toolkit that provides fundamental tools and utilities which can helps you analyze market , get notifications and calculate trade factors faster, more accurate and much easier. Easy Toolbar is born with the mission to make analysis tools of MT4 really work & provide more useful utilities . If you are not fully depend on EAs and do your own work to analyze market, this tool is for you! Main features New way to use market analysis tools Introduce new important object
Ruler  is important but just a simple tool. Why people make it too complex? Easy Ruler makes it great again. Almost zero setup required, nothing annoying on chart, quick and accurate. Easy Ruler MT4  just help you measure 2 points on chart quickly and accurate. That's all! To support you better, it has magnet mode to pick points more accurate and works on indicator windows too (30 indicators that provided by MT4 by default). This smart ruler provides these information right on chart in no time t
Market Trend Scanner   is a trend analyzer or trend screener indicator that helps you know the trend in   selected timeframe of all symbols you're watching . This indicator provides clear & detailed analysis results on a beautiful dashboard, let you able to use this result right away without need   to do any additional analysis. How it works Step 1: Calculate values of 23 selected & trusted technical indicators (Oscillator & Moving Average indicators) Step 2: Analyze all indicators using best pr
Timeframes Trend Scanner is a trend analyzer or trend screener indicator that helps you know the trend in all timeframes of selected symbol you are watching . This indicator provides clear & detailed analysis results on a beautiful dashboard, let you able to use this result right away without need to do any additional analysis. How it works Step 1: Calculate values of 23 selected & trusted technical indicators (Oscillator & Moving Average indicators) Step 2: Analyze all indicators using best pra
Easy Trade Calculator helps to calculate entry/stop loss/take profit levels and volume with some additional information to let your trades under risk management. Quick, accurate & in the visual way! Make trade calculation easier than ever! There are some  constraints between risk, stop loss and volume  for a safe trade. You need to know and let risk under management before you making a trade. Easy Trade Calculator helps to simplify calculation, make it more accurate and much quicker than do it m
Easy Toolbar is a user-friendly toolkit that provides fundamental tools and utilities which can helps you analyze market , get notifications and calculate trade factors faster, more accurate and much easier. Easy Toolbar is born with the mission to make analysis tools of MT5 really work & provide more useful utilities . If you are not fully depend on EAs and do your own work to analyze market, this tool is for you! Main features New way to use market analysis tools Introduce new important object
Easy Trade Calculator helps to calculate entry/stop loss/take profit levels and volume with some additional information to let your trades under risk management. Quick, accurate & in the visual way! Make trade calculation easier than ever! There are some  constraints between risk, stop loss and volume  for a safe trade. You need to know and let risk under management before you making a trade. Easy Trade Calculator helps to simplify calculation, make it more accurate and much quicker than do it m
フィルタ:
レビューなし
レビューに返信