Visual Price Break SMA Indicator MT4
- インディケータ
- AL MOOSAWI ABDULLAH JAFFER BAQER
- バージョン: 1.0
- アクティベーション: 5
💡 Optimize for Your Needs
The PriceBreak SmartSMA Indicator is ideal for traders looking for a robust price action tool with full customization options. It provides key insights into market trends and potential trading opportunities, empowering you to refine your strategy for any market condition.
🔎 How It Works
1️⃣ SMA Crossover Logic
- Uses a 20-period SMA (customizable) to identify market trends.
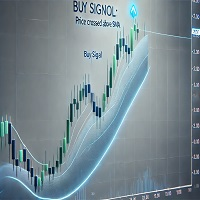
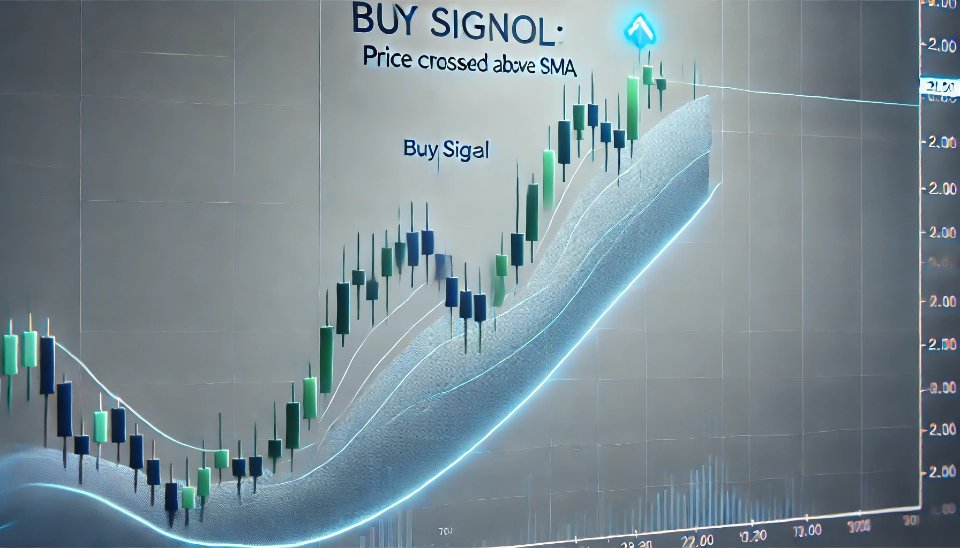
- Buy Signals: Triggered when price crosses above the SMA.
- Sell Signals: Triggered when price crosses below the SMA.
- Users can choose to apply the crossover logic to the closing price or high/low values based on their trading style.
📈 Key Features
- Flexible Parameters: Adjust SMA period and visual indicators to suit your strategy.
- Signal Visualization: Clear buy/sell signals with arrows for actionable insights.
- Risk Management Tools: Visual aids for volume checks and margin validation help you plan trades safely.
🛠 What to Expect
The PriceBreak SmartSMA Indicator is a blank canvas for traders to fine-tune and optimize. Whether you’re a swing trader, scalper, or trend follower, this indicator provides the flexibility and precision needed to adapt to your preferred trading environment.
💰 Price
Available for $65, this indicator is an excellent value for traders seeking a reliable tool for dynamic market analysis.
🌐 Visit Us Online
Explore this indicator and other advanced trading tools designed to enhance your trading experience on our website.
Take control of your trading strategy with the PriceBreak SmartSMA Indicator today! 🚀
