RSI On The Price Chart
- インディケータ
- George Njau Ngugi
- バージョン: 1.0
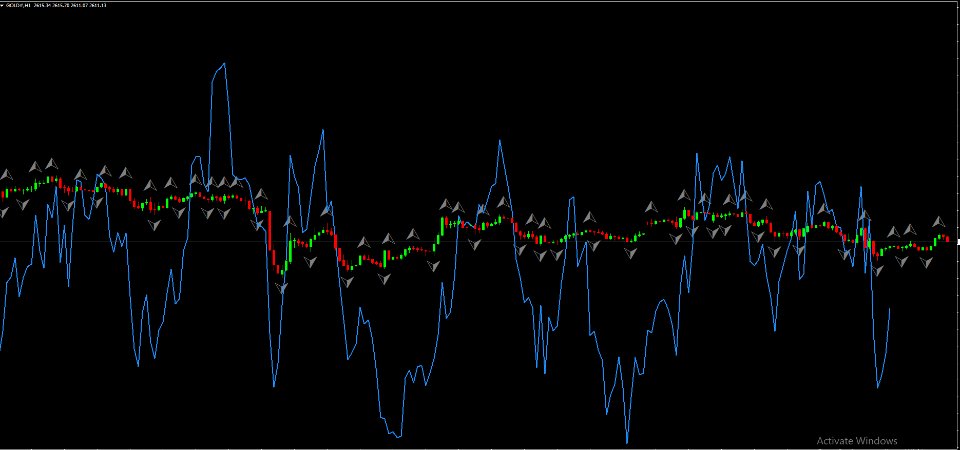
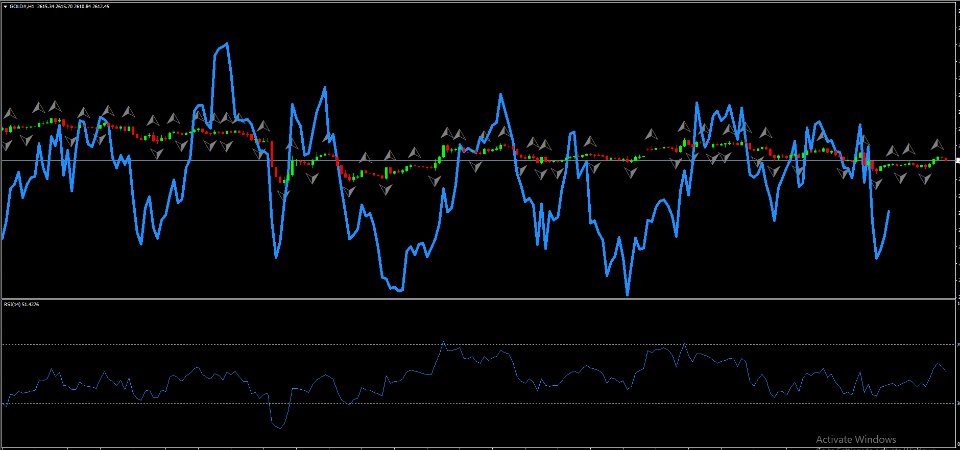
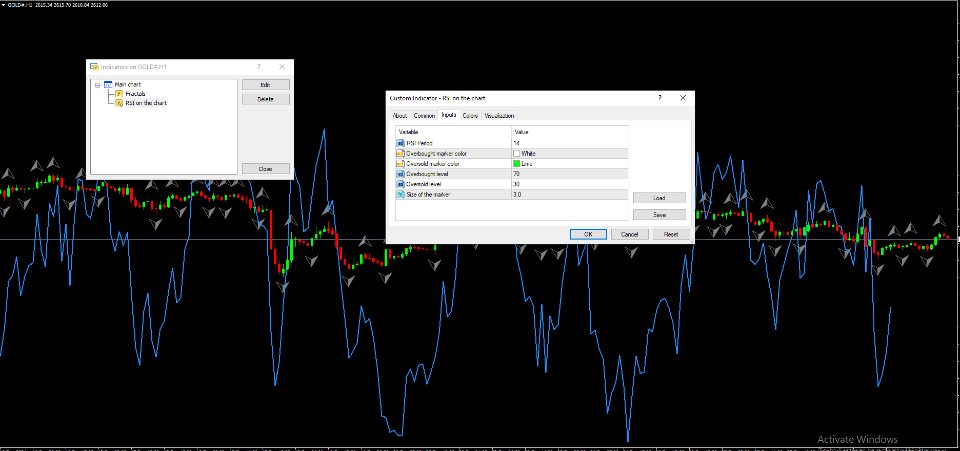
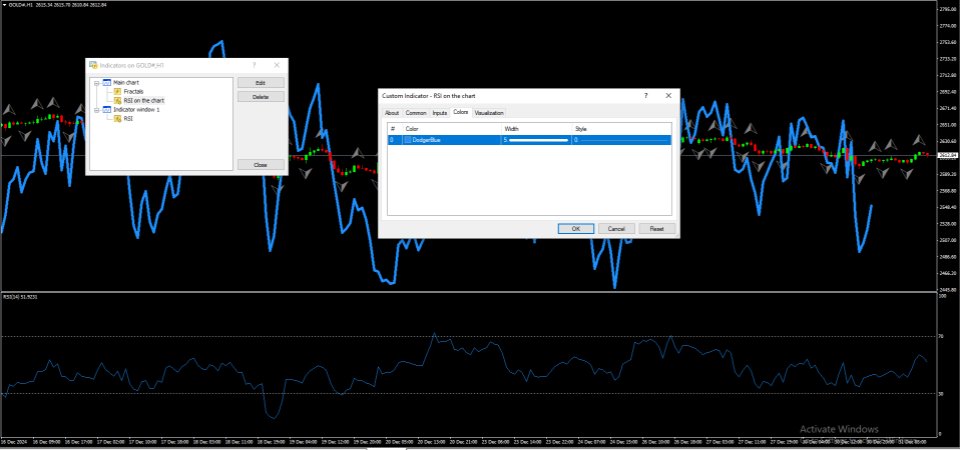
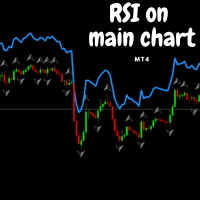
This indicator functions similarly to the traditional Relative Strength Index (RSI), but it's integrated directly onto the main price chart. This setup allows traders to more easily identify price fluctuations and recognize conditions of overbought or oversold markets. By observing the indicator in conjunction with price movements, you can gain valuable insights into potential trend reversals or continued momentum. Keep an eye on these signals to enhance your trading strategy. Happy trading, everyone!
For a Neat and EAsy to use RSI on main chart check ou my profile
