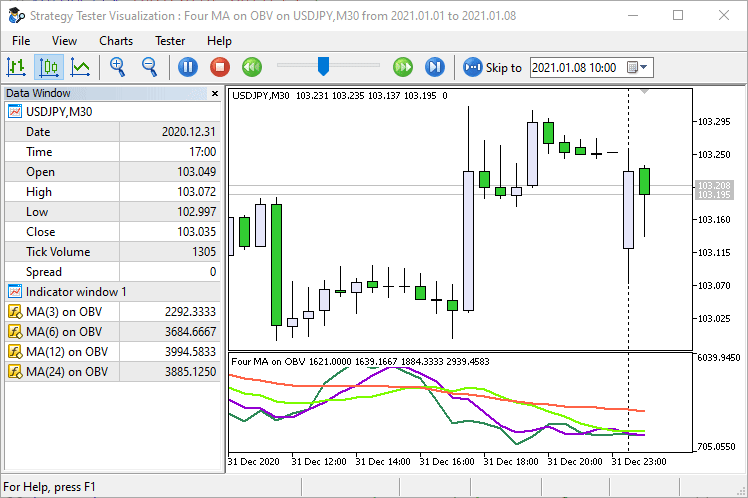
• 概要
  • レビュー
  • コメント

Four MA on OBV

Four MA on OBV - 成功するトレードのための究極のガイド!

Four MA on OBVインディケーターで、トレードの真の可能性を引き出しましょう。この強力なインディケーターは、MetaTrader 5プラットフォーム専用に設計されており、4つの移動平均線とオンバランスボリューム(OBV)を組み合わせ、正確で信頼性のあるシグナルを提供します。

🔍 技術的な特徴:

  • 4つの移動平均線: 単純、指数、平滑、線形の移動平均線を統合し、詳細なトレンド監視を実現。

  • OBV分析: 価格変動に先行するボリュームの動きを検出し、理想的なエントリーおよびエグジットポイントを特定。

  • カスタマイズ可能な設定: トレーディング戦略に応じてパラメータを調整し、柔軟性とコントロールを向上。

  • リアルタイムアラート: 重要な変化について即時通知を受け取り、迅速かつ情報に基づいた行動が可能。

🎯 主なメリット:

  • シグナルの精度: 高度な誤信号フィルタリングにより、最良の機会のみを提供。

  • 使いやすさ: 直感的なインターフェースで、初心者と経験豊富なトレーダーの両方に適しています。

  • 利益の向上: トレーディング決定を最適化するシステムで収益を最大化。

💡 なぜFour MA on OBVを選ぶのか?

  • 信頼性と信頼性: 最先端のアルゴリズムで開発され、安定した結果を保証するために徹底的にテストされています。

  • 専用サポート: 質問に答え、トレーディング体験を最大化するための専門サポートチームにアクセス。

  • 賢い投資: 本当に違いを生むインディケーターでトレーディング戦略を変革。

Four MA on OBVで金融市場の旅を変えましょう。今すぐダウンロードして、自信と精度を持ってトレードを始めましょう!


おすすめのプロダクト
The Rocket Trend indicator is trending. The indicator draws two-color points connected by lines along the chart. This is a trend indicator, it is an algorithmic indicator. It is easy to work and understand when a blue circle appears, you need to buy, when a red one appears, sell. The indicator is used for scalping and pipsing, and has proven itself well. Rocket Trend is available for analyzing the direction of the trend for a specific period of time. Ideal for novice traders learning the laws o
Linear Trend Predictor ー - エントリ ポイントと方向サポート ラインを組み合わせたトレンド インジケーター。高値/安値チャネルを突破するという原理に基づいて機能します。 インジケーターのアルゴリズムは市場のノイズをフィルタリングし、ボラティリティと市場の動向を考慮します。 インジケーターの機能  平滑化手法を使用して、市場のトレンドと、買い注文または売り注文を開くためのエントリー ポイントを表示します。  任意の時間枠のチャートを分析して、短期および長期の市場の動きを判断するのに適しています。  あらゆる市場や時間枠に適応可能な入力パラメータにより、トレーダーはインジケーターを独自にカスタマイズできます。  設定されたインジケーター信号は消えず、再描画もされません。ローソク足の終値で決定されます。  いくつかの種類の通知が矢印と組み合わされています。  このインジケーターは、独立した取引システムとして使用することも、他の取引システムへの追加として使用することもできます。  あらゆるレベルの経験を持つトレーダーが使用できます。 主なパラメータ Vol
このインジケーターは実践的なトレードに最適な自動波動分析のインジケーターです! 場合... 注:   Tang Lun (Tang Zhong Shuo Zen) の命名規則の影響で、私は波のグレーディングに西洋の名前を使用することに慣れていません。基本的な波を ペン 、二次波のバンドを セグメント と名付けました。同時に、 セグメント にはトレンドの方向が指定されます (この命名方法は将来のノートで使用されます。最初に言っておきます)。ただし、アルゴリズムは曲がりくねった理論とはほとんど関係がないため、付けるべきではありません。これは、私の市場分析 によって要約された、絶えず変化する複雑な運用ルール を反映しています。 バンドは標準化され、人によって異なることがないよう定義されており、市場参入を厳密に分析する上で重要な役割を果たす人為的な干渉の描画方法が排除されています。 このインジケーターを使用することは、取引インターフェイスの美しさを改善することと同等であり、元の K ライン取引を放棄し、取引の新しいレベルに連れて行きます。また、宣伝の観点から顧客の認識も向上します。 イ
Utilities
Douglas Lucio De Araujo
Indicator with 3 features - Clock : Clock independent of the chart, counting continues even when the market is closed. - Template : After setting up a configuration in any graphic, be it color patterns, indicators, zoom ... The configuration will be copied to all active graphics. - TimeFrame : Set the TimeFrame on a chart, and with just one click all the active charts will be changed to the same TimeFrame.
Rush Point Histogram Continuity force indicator. Operation: After a breach of support or resistance of an asset, the trader can understand by reading the histogram if such a move tends to continue, thus filtering false breaks or short breaks without trend formation. Through a simple, level-based reading, the trader can make a decision based on the histogram, where: Below 21: No trend formation 21 to 34: Weak trend 34 to 55: Strong Trend 55 to 89: Strong tendency Suggested Reading: Observed disru
Go Binary
Fabio Oliveira Magalhaes
The main idea of this product is to generate statistics based on signals from 5 different strategies for the Binary Options traders, showing how the results would be and the final balance based on broker's payout. Strategy 1: The calculation is secret. Strategy 2: The signal is based on a sequence of same side candles (same color). Strategy 3: The signal is based on a sequence of interspersed candles (opposite colors). Strategy 4: The signal consists of the indicators bollinger (we have 3 type
Xtrade Trend Detector is an indicator capable of finding the best opportunities to take a position in any stock market. Indeed, it is a great tool for scalpers but also for Daytraders. You could therefore use it to identify areas to trade, it fits easily on a chart. I use it to detect trends on Big timeframes and take positions on Small timeframes. Don't hesitate to give me a feedback if you test it.
Institutional Pivot is a result of 5 years of research on order flow analysis in the Forex market and Nasdaq, seeking mounting and defense positions. The one of the best support and resistance points you can have right now available to everyone. You can opt for the Forex, CME and Brazilian markets in the settings Choosing the market just plot on the chart to make your trades
Introduction to Fractal Pattern Scanner Fractal Indicator refers to the technical indicator that makes use of the fractal geometry found in the financial market. Fractal Pattern Scanner is the advanced Fractal Indicator that brings the latest trading technology after the extensive research and development work in the fractal geometry in the financial market. The most important feature in Fractal Pattern Scanner is the ability to measure the turning point probability as well as the trend probabil
KT Absolute Strength measures and plots the absolute strength of the instrument's price action in a histogram form. It combines the moving average and histogram for a meaningful illustration. It supports two modes for the histogram calculation, i.e., it can be calculated using RSI and Stochastic both. However, for more dynamic analysis, RSI mode is always preferred. Buy Entry When the Absolute Strength histogram turns green and also it's higher than the previous red column. Sell Entry When th
MACDmaxmin
Carlos Andrés Moya Erazo
3 (2)
The indicator shows when there are overpricing and divergences over a normalized MACD Plus, it displays signals with configurable alerts, self-regulating dynamic overprice levels, and a simple setup and interface. The indicator that automatically calculates overprices ranges! MACDmaxmin is an indicator based on the MACD oscillator that effectively identifies trend changes in price, as it is a momentum indicator that captures the trend and shows the relationship between two moving averages of th
KT Psar Arrows MT5
KEENBASE SOFTWARE SOLUTIONS
5 (1)
KT Psar Arrows plots the arrows on chart using the standard Parabolic SAR indicator. A bullish arrow is plotted when the candle's high touch the SAR. A bearish arrow is plotted when the candle's low touch the SAR. The signals are generated in the real-time without waiting for the bar close.  Features A beneficial tool for traders who want to experiment with the trading strategies that include the use of Parabolic Sar indicator.  Can be used to find turning points in the market. Use custom PSAR
As   well   as   SuperTrend, SuperTrend Alerts offers alerts . You   can   also   get   alerts   with   SuperTrend   Alerts . Besides   SuperTrend, SuperTrend Alerts   also   offers alerts . SuperTrend   Alerts offers alerts   along   with SuperTrend . In addition to SuperTrend, SuperTrend Alerts   has   alerts . Also , SuperTrend Alerts offers alerts . The   SuperTrend   Alerts   add-on   works   with   SuperTrend   as well. As   well   as   SuperTrend, SuperTrend Alerts   has   alerts   too .
この指標は、市場の強気と弱気の圧力を分析する価格反転を予想しています。購入圧力は、特定の日数にわたるすべての累積バーの合計にボリュームを掛けたものです。販売圧力は、同じ数のバーにわたるすべての分布の合計に、ボリュームを掛けたものです。 [ インストールガイド | 更新ガイド | トラブルシューティング | よくある質問 | すべての製品 ] インディケーター比率は、合計アクティビティに対する購買圧力の割合を示します。この値は、0から100まで変動します。2つの移動平均、高速および低速を実装して、圧力トレンドの変化を識別し、それに応じて取引を探します。 50の比率は、市場が均衡していることを意味します 70を超える比率は、市場が買われ過ぎであることを意味します 30未満の比率は、市場が売られ過ぎていることを意味します 赤い点線は現在の比率です 青い線は信号線です オレンジ色の線がメインラインです それは簡単な取引の含意を持っています。 市場が売られ過ぎているときに購入の機会を探す 市場が買われすぎている場合に販売機会を探す 信号線が本線の上にある場合、圧力は強気です 信号線が本線より
Gator
Eric Mangeni Wakho
Introducing Gator Algo(Intelligent Algo) , an advanced Expert Advisor (EA) designed with a unique blend of Supply and Demand strategy to give you an edge in the market. It leverages the Hull and Stochastic Trend indicators for precision entries and exits. With built-in Telegram notifications, you'll stay informed on all trade actions in real-time. Gator Algo combines cutting-edge automation with a strategic approach that uses AI to help you maximize profits. Perfect for traders seeking a powerfu
KT DMA is a modified and advanced version of the classic Displaced Moving Averages with buy/sell crossover alerts and a Multi-Timeframe scanner that shows DMA's direction across each real-time time frame. A Displaced Moving Average is a simple moving average that moves ahead or backward in a time frame (either short-term or long-term). It also allows you to predict price movement more accurately. Features Depicts the trend direction using the alignment of three moving averages. Buy/Sell signals
If you are unsure how to use this indicator, please feel free to reach out to me. I will explain it to you and provide reading materials to help you make the most of it. TD Sequential Scanner: An Overview The TD Sequential scanner is a powerful technical analysis tool designed to identify potential price exhaustion points and trend reversals in financial markets. Developed by Tom DeMark, this method is widely used by traders to gauge market cycles and potential turning points with precision. Ho
Quantum TrendPulse を ご紹介します。これは、   SuperTrend   、   RSI   、および Stochastic のパワーを 1 つの包括的なインジケーターに組み合わせて、取引の可能性を最大限に引き出す究極の取引ツールです。精度と効率を求めるトレーダー向けに設計されたこのインジケーターは、市場のトレンド、勢いの変化、最適なエントリー ポイントとエグジット ポイントを自信を持って特定するのに役立ちます。 主な特徴: SuperTrend 統合: 現在の市場動向に簡単に追従し、収益性の波に乗ることができます。 RSI精度: 買われすぎと売られすぎのレベルを検出し、市場の反転のタイミングに最適で、SuperTrendのフィルターとして使用されます。 確率的精度: 確率的振動を活用して、変動の激しい市場で隠れたチャンスを見つけます。SuperTrend のフィルターとして使用されます。 マルチタイムフレーム分析:   M5 から H1 または H4 まで、さまざまなタイムフレームで市場を常に把握します。 カスタマイズ可能なアラート: カスタム取引条件が満たされ
E2C Lines
Eduardo Cristian De Carvalho
Descubra o poder do nosso indicador de alta precisão, projetado para identificar as regiões de alvo e exaustão de qualquer ativo. Testado e validado por mais de 3 anos nos mercados de mini dólar e mini índice, ele oferece confiabilidade e eficácia incomparáveis. Transforme sua estratégia de trading e alcance novos patamares de sucesso com nossa ferramenta inovadora.
Go Ferramentas
Fabio Oliveira Magalhaes
This product is a set of tools that help the trader to make decisions, bringing information from different categories that complement each other: trend, support / resistance and candle patterns. It also has a panel with information about the balance. The trend has two different calculations and is shown as colored candles. Strategy 1 is longer, having 3 different states: up, down and neutral trend. Strategy 2 has a faster response and has only 2 states: up and down trend. Support and resistance
MACD Alerts MT5
KEENBASE SOFTWARE SOLUTIONS
5 (1)
KT MACD Alerts is a personal implementation of the standard MACD indicator available in Metatrader. It provides alerts and also draws vertical lines for the below two events: When MACD crosses above the zero line. When MACD crosses below the zero line. Features It comes with an inbuilt MTF scanner, which shows the MACD direction on every time frame.  A perfect choice for traders who speculate the MACD crossovers above/below the zero line. Along with the alerts, it also draws the vertical lines
Trend Ruby
Ignacio Agustin Mene Franco
Trend Ruby, indicator 3 of the ruby ​​pack. trend ruby ​​has the strategy of breaking the structure or trend line How well do the lines mark and gives you the signal of breaking or following the trend? and bounce! works for any temporality, It is used for scalping and also intraday It works for the forex markets all the pairs, also for synthetic indices all pairs ideal for volatility and jumps! also crash and boom!
ROC acceleration-deceleration is the manual system for medium-term scalping. Indicator based on custom ROC system which defines bullish/bearish market and especially  acceleration-deceleration of tendention in the market's main direction. Buy arrow is plotted during bearish market when current trend decelerates and sell  arrow is plotted during bullish market when current trend decelerates. Main Indicator's Features Signals are not repaint,non-late or disappear(exept cases when system recalculat
Speed Scalp Indicator – NON-Repaint The Ultimate Tool for Fast and Precise Scalping Perfect for Gold (XAUUSD) & Lower Timeframes The   Speed Scalp Indicator   is a powerful, non-repainting trading tool specifically engineered for scalpers who thrive on speed, precision, and high-frequency entries. Tailored for timeframes   30 minutes and below , this indicator is especially optimized for   Gold (XAUUSD) , making it an essential companion for traders focusing on volatile instruments and rapid
The indicator helps to enter a trade following the trend, at the same time, after some correction. It finds strong trending movements of a currency pair on a given number of bars, and also finds correction levels to this trend. If the trend is strong enough, and the correction becomes equal to the one specified in the parameters, then the indicator signals this. You can set different correction values, 38, 50 and 62 (Fibonacci levels) are better. In addition, you can set the minimum trend lengt
Santa Trend
Marco Aurelio Cestari
4.4 (5)
Santa Trend Indicator  is an efficient way to forecast and detect the trend in any market. Advantages Generates instant buy and sell signals. Provides an alternate exit strategy to your existing trading system. Never repaints, never backpaints, never recalculates. Works in all symbols and all timeframes. Perfect trend filter for any strategy or expert advisor. Fully compatible with Expert Advisor (EA) development. Does not lag.
FREE
Heat Map Indicator - Advanced Volume Analysis Introducing the Heat Map Indicator - A Professional Tool for Market Volume Analysis! **Key Features** **Visual Heat Map** - Instant volume intensity visualization through colors - Blue: Low volume - Green: Medium volume - Yellow/Orange: Increasing volume - Red: High volume **Intuitive Interface** - Dynamic color scale - Real-time percentage indicator - Current level indicator - Customizable colors and transparency **Smart Alert System** - Custo
範囲の枯渇は、価格が現在の期間の予想される範囲を満たすか超えると発生します。これらのレベルでは、価格は期間の初期に比べて勢いを失い始めるため、新しいポジションをとっていないことを確認するのに良いポイントです. このインジケーターは、チャート上でこれが発生する可能性が高い場所を示し、日次、週次、月次の期間のレベルを示します。 価格がこれらの枯渇レベルを超えている場合は、動きの背後にある勢いが非常に強く、より高い時間枠レベルに向かっている可能性が高いことを示しています. インジケーターは、好みに応じて、Average True Range (ATR) または Average Range (ADR) 計算を使用できます。デフォルトでは、外国為替チャートでよりうまく機能することがわかっているため、ATR を使用しますが、ADR は株式ベースのインデックスとシンボルで優位に立っています。 インジケーターには、以下で説明するいくつかの描画モードがあり、ニーズに合わせて調整できます。 設定 計算モード レベルの計算には、AverageTrueRange (ATR) または AverageDaily
I recommend you to read the  product's blog  (manual) from start to end so that it is clear from the beginning what the indicator offers. This multi time frame and multi symbol supply and demand zone dashboard indicator sends alerts when the price has reached a supply/demand zone. It is also possible to use it to be alerted about regular double tops/bottoms instead of zones. It can be used with all time frames from M1 to MN. Maximum 9 time frames can be shown in the dashboard at the same time. 
このマルチタイムフレームとマルチシンボルインジケーターは、ダブルトップ/ボトム、ヘッド&ショルダー、ペナント/トライアングル、フラグパターンを識別します。ネックライン/トライアングル/旗竿のブレイクアウトが発生した場合にのみアラートを設定することもできます(ネックラインブレイクアウト=上下および頭と肩の確認された信号)。     インジケーターはシングルチャートモードでも使用できます。このオプションの詳細については、製品の     ブログ 。独自のルールとテクニックを組み合わせることで、このインジケーターを使用して、独自の強力なシステムを作成(または強化)できます。 特徴 マーケットウォッチウィンドウに表示されているすべてのシンボルを同時に監視できます。インジケーターを1つのチャートに適用し、市場全体を即座に監視します。 M1からMNまでのすべての時間枠を監視でき、パターンが識別されたとき、またはブレイクアウト時にリアルタイムのアラートを送信します。すべてのMetatraderネイティブアラートタイプがサポートされています。 RSIをトレンドフィルターとして使用して、潜在的な反転を適
このプロダクトを購入した人は以下も購入しています
Golden Trend Indicator MT5
Noha Mohamed Fathy Younes Badr
4.89 (18)
Golden Trend indicator  is The best indicator for predicting trend movement this indicator never lags and never repaints and never back paints    and give  arrow buy and sell    before the candle appear  and it will help you and  will make your trading decisions clearer its work on all currencies and  gold and crypto and all time frame This unique  indicator uses very secret algorithms to catch the  trends, so you can trade using this indicator and see the trend clear on charts  manual guide and
反転ゾーン / ピークボリューム / 主要プレーヤーのアクティブゾーン =       TS TPSプロシステム 説明書 RUS       /       説明書     英語     /           バージョン MT4        このインジケーターを購入したすべての購入者は、さらに以下を無料で受け取ります: RFI SIGNALS サービスからの取引シグナルへの 6 か月間のアクセス - TPSproSYSTEM アルゴリズムに従った既製のエントリ ポイント。 定期的に更新されるトレーニング資料 - 戦略に没頭し、プロフェッショナル レベルを高めます。 平日は 24 時間 365 日サポート、非公開のトレーダー チャットへのアクセス - コミュニケーション、サポート、市場状況の分析。 著者の設定ファイル - 余分な労力をかけずに最大の結果を達成するための自動インジケーター設定。 主な機能: 売り手と買い手のアクティブなゾーンを表示します。 このインジケーターは、購入と販売の正しい最初のインパルス レベル/ゾーンをすべて表示します。これらのレベル/ゾーンがアクティブに
VERSION MT4        —        ИНСТРУКЦИЯ RUS           —        INSTRUCTIONS  ENG 主な機能: レンダリングなしで正確な入力信号! シグナルが表示されると、それは関連性を維持します。これは、シグナルを提供してからそれを変更し、その結果、入金された資金が失われる可能性があるリドローインジケーターとの重要な違いです。より高い確率と精度で市場に参入できるようになりました。矢印が表示された後、ターゲットに到達する (利益確定) か反転シグナルが表示されるまで、ローソク足に色を付ける機能もあります。 STOP-LOSS/TAKE-PROFITゾーンの表示 エントリーポイントを検索する際の視覚的な明瞭さを改善するために、最適な市場エントリーポイントが検索される購入/販売ゾーンを最初に表示するモジュールが作成されました。ストップロスレベルを操作するための追加のインテリジェントロジックは、時間の経過とともにそのサイズを縮小するのに役立ち、それによって取引に参加するときの初期リスクを軽減します(Move SL)。 より高いタイ
今、147ドル(いくつかの更新後に499ドルに増加します) - 無制限のアカウント(PCSまたはMac) RelicusRoad ユーザー マニュアル + トレーニング ビデオ + プライベート Discord グループへのアクセス + VIP ステータス 市場の新しい見方 RelicusRoad は、外国為替、先物、暗号通貨、株式、および指数の世界で最も強力な取引インジケーターであり、トレーダーに収益を維持するために必要なすべての情報とツールを提供します。初心者から上級者まで、すべてのトレーダーが成功するためのテクニカル分析と取引計画を提供します。これは、将来の市場を予測するのに十分な情報を提供する重要な取引指標です。意味をなさないチャート上のいくつかの異なる指標ではなく、完全な解決策を信じています.これは、信号、矢印 + 価格アクション情報を表示するオールインワンのインジケーターで、他に類を見ない非常に正確です。 強力な AI に基づいて、RelicusRoad は不足している情報とツールを提供して、あなたを教育し、トレーディングのプロ、成功したトレーダーにします。 ほと
次世代の自動化された需要と供給のゾーン。どのチャートでも機能する新しい革新的なアルゴリズム。すべてのゾーンは、市場の価格行動に従って動的に作成されています。 2種類のアラート --> 1) 価格がゾーンに達したとき 2) 新しいゾーンが形成されたとき もう 1 つの役に立たない指標はありません。実績のある完全な取引戦略を手に入れることができます。     新機能:     価格が需給ゾーンに達したときにアラートを出す     新しい需給ゾーンが作成されたときにアラートを発します     プッシュ通知アラート     ピップ単位のゾーン幅ラベル     MTF のもう 1 つのタイムフレーム。したがって、現在より 2 時間足高いのではなく、現在より 3 時間足し上に見えるようになります。     アラート/ゾーン/MTF 機能を有効/無効にするボタン あなたが得る利点:     取引から感情を取り除きます。     取引エントリをオブジェクト化します。     確率の高いセットアップで利益を上げましょう。     描画ゾーンから時間を節約します。
WHY IS OUR FXACCCURATE LS MT5 THE PROFITABLE ? PROTECT YOUR CAPITAL WITH RISK MANAGEMENT Gives entry, stop and target levels from time to time. It finds Trading opportunities by analyzing what the price is doing during established trends. POWERFUL INDICATOR FOR A RELIABLE STRATEGIES We have made these indicators with a lot of years of hard work. It is made at a very advanced level. Established trends provide dozens of trading opportunities, but most trend indicators completely ignore them! The
これはMT5のインジケーターで、再描画なしで取引に参入するための正確なシグナルを提供します。 外国為替、暗号通貨、金属、株式、インデックスなど、あらゆる金融資産に適用できます。かなり正確な見積もりを提供し、取引を開始して終了するのに最適な時期を教えてくれます。1つのシグナルを処理しただけでインジケーターの元が取れた例の 動画 (6:22)をご覧ください。Entry PointsPro インジケーターの助けを借りたほとんどのトレーダーの最初の1週間の結果が改善しています。 Telegramグループ に登録してください。Entry Points Proインジケーターのメリットは次の通りです。 再描画のないエントリーシグナル 再描画されるインジケーターでは一度表示されたシグナルが削除されて大きな金銭的損失につながることがありますが、これと異なり、表示されて確認されたシグナルは消えることがありません。 エラーなしの取引開始 インジケーターアルゴリズムによって取引を開始する(資産を売買する)理想的な瞬間を見つけることができます。それを使用するすべてのトレーダーの成功率が向上します。 あら
Was: $299  Now: $149  Supply Demand uses previous price action to identify potential imbalances between buyers and sellers. The key is to identify the better odds zones, not just the untouched ones. Blahtech Supply Demand indicator delivers functionality previously unavailable on any trading platform. This 4-in-1 indicator not only highlights the higher probability zones using a multi-criteria strength engine, but also combines it with multi-timeframe trend analysis, previously confirmed swings
[ MT4 Version ]  [ Order Blocks ]  [ Kill Zones ]  [ SMT Divergences ] How to trade using Order Blocks :  Click here User Interface Performance:  During testing in the strategy tester, the UI may experience lag. Rest assured, this issue is specific to the testing environment and does not affect the indicator's performance in live trading. Elevate your trading strategy with the  Order Blocks ICT Multi TF  indicator, a cutting-edge tool designed to enhance your trading decisions through advanced o
[ MT4 Version ]  [ Kill Zones ]  [ SMT Divergences ] How to trade using Order Blocks:  Click here User Interface Performance:  During testing in the strategy tester, the UI may experience lag. Rest assured, this issue is specific to the testing environment and does not affect the indicator's performance in live trading. Elevate your trading strategy with the  Order Blocks ICT Multi TF  indicator, a cutting-edge tool designed to enhance your trading decisions through advanced order block analysis
[ MT4 Version ] Are you tired of spending months on demo or live accounts to test your trading strategies? The Backtesting Simulator is the ultimate tool designed to elevate your backtesting experience to new heights. Utilizing Metatrader historical symbol information, it offers an unparalleled simulation of real market conditions. Take control of your testing speed, test ideas quickly or at a slower pace, and witness remarkable improvements in your testing performance. Forget about wasting tim
IQ Gold Gann Levels a non-repainting, precision tool designed exclusively for XAUUSD/Gold intraday trading. It uses W.D. Gann’s square root method to plot real-time support and resistance levels, helping traders spot high-probability entries with confidence and clarity. William Delbert Gann (W.D. Gann) was an exceptional market analyst, whose trading technique was based on a complex blend of mathematics, geometry, astrology, and ancient mathematics which proved to be extremely accurate. Download
The AT Forex Indicator MT5 is a sophisticated trading tool designed to provide traders with a comprehensive analysis of multiple currency pairs. This powerful indicator simplifies the complex nature of the forex market, making it accessible for both novice and experienced traders. AT Forex Indicator uses advanced algorithms to detect trends, patterns and is an essential tool for traders aiming to enhance their forex trading performance. With its robust features, ease of use, and reliable signal
Description: The Volume Profile displays detailed informations of historical trading activities at certain price levels (Market Profile). Locate the areas with the best prices in the market and get an advantage over other market participants. Features: Customizable Market Profile Shows the "fair" Value Area with 70% of all Volume Shows critical low volume zones Shows VPOC, VAL and VAH Points integrated resource management to reduce the load while working with multiple charts Works on all timefr
The Naveen Dynamic Square  MT5  is one of the best known  technical analysis tools  inspired  by WD Gann along with the Gann Fan and Gann Box. It is considered a cornerstone of his trading technique that is based on time and price symmetry. The Naveen Dynamic Square MT5   is a powerful tool in finance for determining support and resistance levels based on a stock's extreme price points. It works by extrapolating probable price levels from a central value, typically an all-time or cyclical high o
Royal Scalping Indicator is an advanced price adaptive indicator designed to generate high-quality trading signals. Built-in multi-timeframe and multi-currency capabilities make it even more powerful to have configurations based on different symbols and timeframes. This indicator is perfect for scalp trades as well as swing trades. Royal Scalping is not just an indicator, but a trading strategy itself. Features Price Adaptive Trend Detector Algorithm Multi-Timeframe and Multi-Currency Trend Low
これはほぼ間違いなく、MetaTraderプラットフォームで見つけることができる最も完全な調和価格形成自動認識インジケーターです。 19種類のパターンを検出し、フィボナッチプロジェクションをあなたと同じように真剣に受け止め、潜在的逆転ゾーン(PRZ)を表示し、適切なストップロスとテイクプロフィットレベルを見つけます。 [ インストールガイド | 更新ガイド | トラブルシューティング | よくある質問 | すべての製品 ] 19の異なる調和価格形成を検出します プライマリ、派生および補完フィボナッチ投影(PRZ)をプロットします 過去の価格行動を評価し、過去のすべてのパターンを表示します この指標は、独自の品質とパフォーマンスを分析します 適切なストップロスとテイクプロフィットのレベルを表示します ブレイクアウトを使用して適切な取引を通知します すべてのパターン比をグラフにプロットします 電子メール/音声/視覚アラートを実装します スコット・M・カーニーの本に着想を得て、この指標は最も純粋で急を要するトレーダーのニーズを満たすように設計されています。ただし、トレードを容易にする
現在33%オフ 初心者にもエキスパートトレーダーにも最適なソリューション このインジケーターは独自の機能と新しい公式を多数内蔵しており、ユニークで高品質かつ手頃な取引ツールです。このアップデートでは、2つの時間枠ゾーンを表示できるようになります。より長いTFだけでなく、チャートTFとより長いTF(ネストゾーンを表示)の両方を表示できます。すべてのSupply Demandトレーダーの皆さんのお気に召すはずです。:) 重要情報の公開 Advanced Supply Demandの可能性を最大化するには、 https://www.mql5.com/ja/blogs/post/720245 にアクセスしてください。   エントリーまたはターゲットの正確なトリガーポイントを正確に特定できれば取引がどのように改善されるか想像してみてください。新しい基盤となるアルゴリズムに基づいて構築されているため、買い手と売り手の間の潜在的な不均衡をさらに簡単に特定できます。これは、最も強い需要と供給のゾーンと、過去のパフォーマンス(古いゾーンを表示)がグラフィカルに表現されるためです。これらの機能は、最適な
KT Candlestick Patternsは、信頼性の高い24種類の日本のローソク足パターンをリアルタイムで検出しチャート上に表示します。日本のトレーダーは18世紀からローソク足を用いて価格の方向性を予測してきました。 すべてのローソク足パターンが同じ信頼性を持つわけではありませんが、サポートとレジスタンスなどのテクニカル分析と組み合わせることで、より正確な市場状況の把握が可能になります。 このインジケーターは、スティーブ・ニソンの著書「日本のローソク足チャートの技法」で詳しく紹介されている多くのパターンを含んでいます。 また、書籍には載っていない珍しい複雑なローソク足パターンも多数検出可能です。 特徴 固定ピップスを成功基準として設定することで、リアルタイムでそのパターンの成功率が確認できます。 24種類の有名なローソク足パターンを高精度で検出します。 各パターンの成功率を記録・表示するパフォーマンス分析モジュールを搭載。 パターン間に最低バー数を設定でき、視認性と精度が向上します。 トレンド方向と組み合わせてパターンをより正確に認識します。 反転パターン、継続パターン、中
CBT Quantum Maverick 高効率バイナリーオプション取引システム CBT Quantum Maverickは、高いパフォーマンスとシンプルさを追求するトレーダー向けに設計されたバイナリーオプション取引システムです。カスタマイズの必要がなく、最適化された状態で使用を開始できます。シグナルに従うだけで、少しの練習でマスターできます。 主な特徴: シグナルの精度: 現在のローソク足を基に次のローソク足の取引シグナルを生成し、頻繁な再描画がありません。 多様な市場対応: バイナリーオプション取引に特化し、さまざまなブローカーや資産クラスに対応しています。 対応可能: Deriv Synthetic Charts :すべてのタイムフレームで使用可能。 OTCチャート :Quotex、PocketOption、Binomo、Stockity、IQOption、Exnova、OlympTrade、Deriv、Binolla、Homebrokerなどのブローカーに対応。MT5へのインポートは最初の1週間無料、その後は有料サービス。 FX、仮想通貨、商品市場 :幅広い資産利用が可能
MetaBands M5
Vahidreza Heidar Gholami
4.5 (2)
MetaBandsは、強力でユニークなアルゴリズムを使用してチャンネルを描画し、トレンドを検出して、トレーダーに取引の入出ポイントを提供することができます。チャンネル指標に加えて、強力なトレンド指標でもあります。入力パラメータを使用して新しいチャンネルを作成するために、異なるタイプのチャンネルを統合することができます。MetaBandsは、市場のイベントについてユーザーに通知するために、すべてのタイプのアラートを使用します。 特徴 ほとんどのチャンネルアルゴリズムをサポート 強力なトレンド検出アルゴリズム 異なるタイプのチャンネルを統合する能力 マルチタイムフレームおよびマルチカレンシー(シグナルマトリックス) すべてのタイプのアラート機能(サウンド、画面フラッシャー、プッシュ通知、メール、ポップアップ、矢印) 再描画しない トレンド検出 MetaBandsは、チャネル内を振動する青いラインを使用してトレンドを検出します。ラインがチャネルの上部バンドに達すると、下降トレンドの開始を示し、下部バンドに達すると上昇トレンドの開始を示します。青いラインが中心ラインに近づくと、市場はコンソリ
MetaForecast M5
Vahidreza Heidar Gholami
5 (3)
MetaForecastは、価格データのハーモニクスに基づいて、どんな市場の未来を予測し視覚化します。市場が常に予測可能ではありませんが、価格にパターンがある場合、MetaForecastは可能な限り正確な未来を予測できます。他の類似製品と比較して、MetaForecastは市場のトレンドを分析することでより正確な結果を生成することができます。 入力パラメータ Past size (過去のサイズ) MetaForecastが将来の予測を生成するために使用するバーの数を指定します。モデルは選択したバー上に描かれた黄色の線で表されます。 Future size (将来のサイズ) 予測すべき将来のバーの数を指定します。予測された将来は、ピンクの線で表示され、その上に青い回帰線が描かれます。 Degree (程度) この入力は、MetaForecastが市場で行う分析のレベルを決定します。 Degree 説明  0 Degree 0の場合、価格の全てのピークや谷、そして詳細をカバーするために、「Past size」の入力に大きな値を使用することが推奨されています。  1 (推奨) Degre
プレシジョン・インデックス・オシレーター(Pi-Osc)は、Precision Trading SystemsのRoger Medcalfによるものです。 バージョン2は、チャートにスーパーファストでロードされるように注意深く再コードされ、その他の技術的な改良も組み込まれて、エクスペリエンスを向上させています。 Pi-Oscは、市場が強制的に行かなければならない、すべての人のストップを取り除くためのポイントである、極限のエクソースト・ポイントを見つけるために設計された正確な取引タイミング信号を提供するために作成されました。 この製品は、極限のポイントがどこにあるかを知るという古代の問題を解決し、トレーダーの生活をはるかにシンプルにします。 これは、業界標準のオシレーターとは異なる強力な要素を持つ高度なコンセンサス・インジケーターです。 使用されている一部の機能には、需要指数、マネーフロー、RSI、スティリング、パターン認識、出来高分析、標準偏差の極値などがあり、異なる長さでこれらのバリエーションが多く含まれています。 初めて見ると、訓練されていない目には、他のオシレーター
回帰取引を意味する専門的かつ定量的なアプローチを実装する独自の指標。これは、価格が予測可能かつ測定可能な方法で迂回して平均に戻るという事実を利用しており、非定量的な取引戦略を大幅に上回る明確な出入りルールを可能にします。 [ Installation Guide | Update Guide | Troubleshooting | FAQ | All Products ] 明確な取引シグナル 驚くほど簡単に取引できます カスタマイズ可能な色とサイズ パフォーマンス統計を実装します ほとんどの取引戦略を上回ります 適切なSLおよびTPレベルを表示します 電子メール/音声/視覚アラートを実装します 使い方 インディケータは、より高い時間枠からの完全にカスタマイズ可能な移動平均の周りの標準偏差を測定し、トレンドフォローアプローチを使用して正確に取引を見つけます。取引は、現在のチャートの価格アクションに飛び込むことによって見つけられ、価格が選択したより高い時間枠から計算された平均価格帯に戻ったときに閉じられます。それがコード化される方法のために、指標は高ボラティリティと強いトレンドの市場か
The   Time_Price_SQ9_Degree   indicator is based on the 9 Gann square. Using this indicator, you can identify strong time and price zones. The indicator displays the levels as a degree value. The degrees can be set in the settings. After launching, the MENU button appears. If it is highlighted, it can be moved to any point on the graph, and after double-clicking on it, it stops being highlighted and menu buttons appear. To hide the menu, just double-click on the button, it will become highlight
Volume Profile, Footprint and Market Profile TPO (Time Price Opportunity). Volume and TPO histogram bar and line charts. Volume Footprint charts. TPO letter and block marker collapsed and split structure charts. Static, dynamic and flexible range segmentation and compositing methods with relative and absolute visualizations. Session hours filtering and segment concatenation with Market Watch and custom user specifications. Graphical layering, positioning and styling options to suit the user's a
説明 ICSM(Impulse-Correction SCOB Mapper)は、価格の動きを分析し、有効なインパルス、修正、およびSCOB(Single Candle Order Block)を識別するインジケーターです。柔軟性があり、情報量が多く、使いやすく、最も流動性の高い関心領域に対するトレーダーの認識を大幅に向上させるため、あらゆるタイプのテクニカル分析で使用できる強力なツールです。 設定 一般 | ビジュアル カラーテーマ — ICSMのカラーテーマを定義します。 SCOB | ビジュアル SCOBを表示 — SCOBを有効/無効にします; SCOBをマークする — SCOB表現のスタイルオプションのリストを表します; SCOB色 — SCOBの色を定義します; ICM | ビジュアル ICMラインを表示 — ICM(Impulse-Correction Mapper)ラインを有効/無効にします; ICトレンドを表示 — チャートの下部にある色付きの仕切りを通じてインパルス-修正トレンドの視覚化を有効/無効にします; ライン色 — ICMラインの色
Was: $249  Now: $149   Market Profile defines a number of day types that can help the trader to determine market behaviour. A key feature is the Value Area, representing the range of price action where 70% of trading took place. Understanding the Value Area can give traders valuable insight into market direction and establish the higher odds trade. It is an excellent addition to any system you may be using. Inspired by Jim Dalton’s book “Mind Over Markets”, this indicator is designed to suit the
Berma Bands
Muhammad Elbermawi
5 (3)
Berma Bands (BBs) インジケーターは、市場のトレンドを特定して活用したいトレーダーにとって貴重なツールです。価格と BBs の関係を分析することで、トレーダーは市場がトレンド段階にあるか、レンジ段階にあるかを判断できます。 詳細については、[ Berma Home Blog ] をご覧ください。 バーマ バンドは、上部バーマ バンド、中部バーマ バンド、下部バーマ バンドの 3 つの異なる線で構成されています。これらの線は価格の周りにプロットされ、全体的な傾向に対する価格の動きを視覚的に表します。これらのバンド間の距離から、ボラティリティや潜在的な傾向の反転についての洞察を得ることができます。 バーマ バンドの線がそれぞれ離れると、市場が横ばいまたはレンジ相場の期間に入っていることを示すことがよくあります。これは、明確な方向性の偏りがないことを示しています。トレーダーは、これらの期間中にトレンドを特定するのが難しいと感じる可能性があり、より明確なトレンドが出現するまで待つ場合があります。 バーマ バンドの線が 1 本の線に収束すると、強いトレンド環境の兆候となること
TPA True Price Action indicator reveals the true price action of the market makers through 100% non-repainting signals strictly at the close of a candle! TPA shows entries and re-entries, every time the bulls are definitely stronger than the bears and vice versa. Not to confuse with red/green candles. The shift of power gets confirmed at the earliest stage and is ONE exit strategy of several. There are available now two free parts of the TPA User Guide for our customers. The first "The Basics"
フィルタ:
レビューなし
レビューに返信