GPF Stochastic

5
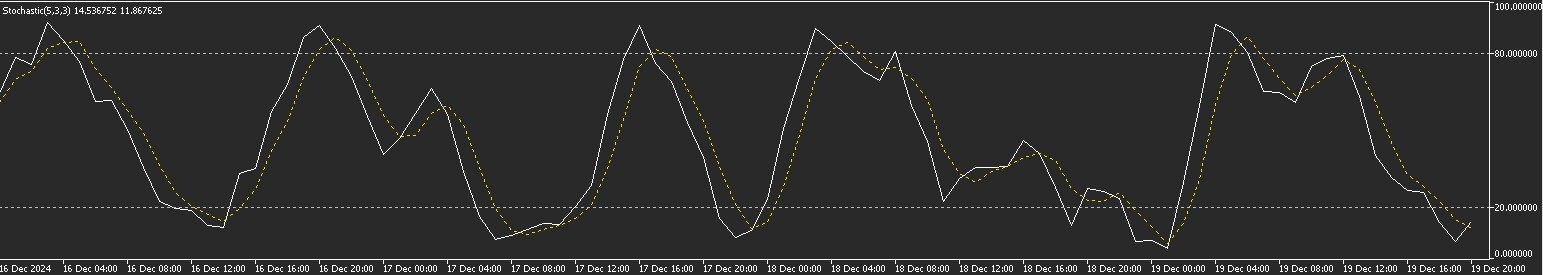
GPF Stochastic:  a momentum indicator that compares a specific closing price of an asset to a range of its prices over a certain period. It helps traders identify potential overbought or oversold conditions in the market.

The indicator consists of two lines:

  1. %K Line: The main line, which represents the current closing price relative to the price range over a set period.
  2. %D Line: The signal line, which is a moving average of %K.

The Stochastic Oscillator ranges from 0 to 100, with levels typically interpreted as:

  • Above 80: Overbought (potential reversal or pullback).
  • Below 20: Oversold (potential bounce or upward movement).

It is not used alone but in conjunction with other indicators or tools for better decision-making.


レビュー 1
Yassou Kalimera
853
Yassou Kalimera 2025.01.10 12:43 
 

well

おすすめのプロダクト
MACD Enhanced
Nikita Berdnikov
4 (4)
Introducing the MACD  Enhanced – an advanced MACD (Moving Average Convergence Divergence) indicator that provides traders with extended capabilities for trend and momentum analysis in financial markets. The indicator uses the difference between the fast and slow exponential moving averages to determine momentum, direction, and strength of the trend, creating clear visual signals for potential entry and exit points. Attention! To achieve the best results, it is recommended to adapt the indicator
FREE
An analogue of the Stochastic oscillator based on algorithms of singular spectrum analysis (SSA) SSA is an effective method to handle non-stationary time series with unknown internal structure. It is used for determining the main components (trend, seasonal and wave fluctuations), smoothing and noise reduction. The method allows finding previously unknown series periods and make forecasts on the basis of the detected periodic patterns. Indicator signals are identical to signals of the original i
FREE
Follow The Line MT5
Oliver Gideon Amofa Appiah
4.6 (35)
This indicator obeys the popular maxim that: "THE TREND IS YOUR FRIEND" It paints a GREEN line for BUY and also paints a RED line for SELL. (you can change the colors). It gives alarms and alerts of all kinds. IT DOES NOT REPAINT and can be used for all currency pairs and timeframes. Yes, as easy and simple as that. Even a newbie can use it to make great and reliable trades. NB: For best results, get my other premium indicators for more powerful and reliable signals. Get them here: https://www.m
FREE
The indicator is based on Robert Miner's methodology described in his book "High probability trading strategies" and displays signals along with momentum of 2 timeframes. A Stochastic oscillator is used as a momentum indicator. The settings speak for themselves period_1 is the current timeframe, 'current' period_2 is indicated - the senior timeframe is 4 or 5 times larger than the current one. For example, if the current one is 5 minutes, then the older one will be 20 minutes The rest of the s
FREE
Indicador IMI (Intraday Momentum Index) Descrição O Indicador IMI (Intraday Momentum Index) é uma poderosa ferramenta de análise técnica desenvolvida para identificar a força do momentum e potenciais reversões no mercado. Este indicador quantifica a relação entre ganhos e perdas durante um período específico, ajudando traders a avaliar a dinâmica atual do mercado. Características Oscila entre 0 e 100, facilitando a interpretação das condições de mercado Identifica com precisão áreas de sobrecomp
FREE
SSACD - Singular Spectrum Average Convergence/Divergence This is an analogue of the MACD indicator based on the Caterpillar-SSA ( Singular Spectrum Analysis ) method. Limited version of the SSACD Forecast indicator. Limitations include the set of parameters and their range. Specificity of the method The Caterpillar-SSA is an effective method to handle non-stationary time series with unknown internal structure. The method allows to find the previously unknown periodicities of the series and make
FREE
Free automatic Fibonacci is an indicator that automatically plots a Fibonacci retracement based on the number of bars you select on the BarsToScan setting in the indicator. The Fibonacci is automatically updated in real time as new highest and lowest values appears amongst the selected bars. You can select which level values to be displayed in the indicator settings. You can also select the color of the levels thus enabling the trader to be able to attach the indicator several times with differe
FREE
Stochastic RSI with Visual Split and Alerts This indicator is based on the Stochastic oscillator applied to the Relative Strength Index (RSI). It is designed to help traders visually identify the main long-term trend while generating entry signals in overbought and oversold zones. Support and questions via MQL5 product comments. For questions, updates, and to connect with other traders, join my official   MQL5 group ForexEAandMore Key Features Visual RSI Split : The RSI line is displayed in gr
FREE
Indicator and Expert Adviser  EA Available in the comments section of this product. Download with Indicator must have indicator installed for EA to work. Mt5 indicator alerts for bollinger band and envelope extremes occurring at the same time. Buy signal alerts occur when A bullish candle has formed below both the lower bollinger band and the lower envelope  Bar must open and close below both these indicators. Sell signal occur when A bear bar is formed above the upper bollinger band and upper
FREE
The Penta-O is a 6-point retracement harmonacci pattern which usually precedes big market movements. Penta-O patterns can expand and repaint quite a bit. To make things easier this indicator implements a twist: it waits for a donchian breakout in the right direction before signaling the trade. The end result is an otherwise repainting indicator with a very reliable trading signal. The donchian breakout period is entered as an input. [ Installation Guide | Update Guide | Troubleshooting | FAQ | A
FREE
Dynamic Supply and Demand indicator automatically identifies and displays Supply and Demand Zones on your chart based on price action patterns and market structure.  These zones represent areas where institutional buying or selling pressure has historically occurred, making them key levels for potential price reactions. This form of indicator takes inspiration from ICT as well as traditional Support & Resistance formation. **For the first 50 candles (number depends on LookBackCandles) when indic
FREE
Supports And Resistances Lines
Francisco Gomes Da Silva
4.65 (46)
サポートゾーンとレジスタンスゾーンのインジケーターMT5 このインジケーターは、トップとボトムを自動的に識別する方法を知っています。 このサポートとレジスタンスインジケーターは、トップとボトムに基づいてサポートラインとレジスタンスラインを作成します。 サポートラインとレジスタンスラインの作り方。 これは、自動サポートラインとレジスタンスラインを作成するためのインジケーターです。 インジケーターを使用してサポートレベルを見つける方法。 このインジケーターはトップとボトムを自動的に検出します。 インジケーターは、「ZigZag」が自動的に底を作成するか、新しい底を前の底より低くするたびにサポートラインを自動的に作成するため、インジケーターは画面に自動サポートラインを自動的に描画します。 レジスタンスラインの作成方法。 インジケーターは、「ZigZag」が新しいトップまたは前のトップよりも高いトップを作成するたびに、サポートレベルを作成するのと同じ方法で抵抗線を自動的に作成します。したがって、インジケーターは新しい抵抗を自動的に作成します。トップレベルとボトムレベルがどこにあるかを心配する必
FREE
SUPERTREND; It is a trend following indicator based on the SuperTrend ATR created by Olivier Seban. It can be used to detect changes in trend direction and locate stops. When the price falls below the indicator curve, it turns red and indicates a downtrend. Conversely, when the price moves above the curve, the indicator turns green, indicating an uptrend. Like other indicators, it works well on SuperTrend when used in conjunction with other indicators such as MACD, parabolik SAR, Bollinger Band
FREE
The MACD indicator in MetaTrader 5 does not look like MACD as it was designed. That is because the MetaTrader 5 version of MACD displays the MACD line as a histogram when it is traditionally displayed as a line. Additionally, the MetaTrader 5 version computes the Signal line using an SMA, while according to MACD definition it is supposed to be an EMA. The MetaTrader 5 version also does not compute a true MACD Histogram (the difference between the MACD/Signal lines). This can be confusing for peo
FREE
Donchian Channel DC is the indicator of Donchian Channels, that plots maximum and minimum values of a specific period, besides mean value line. It´s possible to configure simple period for analysis and the indicator will plot all three values. You can trade with this indicator as trend or reversal, according to each strategy. Do not let to test others indicators as soon as others expert advisors.
Easy Correlations Indicator The Easy Correlations Indicator is designed to help traders analyze the relationship between two correlated instruments. By monitoring the distance between their Relative Strength Index (RSI) values, the indicator highlights situations where one instrument has moved significantly further than the other. This creates potential trading opportunities: Sell the stronger instrument (overstretched RSI) Buy the weaker instrument (lagging RSI) Because the positions are opened
FREE
Daily High Low Danilo Monteiro
Danilo Hudson Couto Monteiro
4 (1)
# Indicador Daily High - Danilo Monteiro - MT5 ## Descrição O Daily High/Low Labels é um indicador personalizado para MetaTrader 5 que exibe automaticamente as máximas e mínimas diárias no gráfico, facilitando a identificação rápida dos níveis importantes de preço. O indicador marca os preços com etiquetas e linhas horizontais, permitindo uma visualização clara dos níveis críticos do dia atual e anterior. ## Principais Características ### 1. Marcação Automática - Exibe automaticamente as máxi
FREE
PROMETHEUS TECHNICAN VERSION Free | By THE SONS A gift from The Sons — no strings, no trial, no expiry. Every trader deserves access to professional-grade market intelligence. That belief is why Prometheus Technical Version exists, and why it costs nothing. Consider it our handshake to the trading community. What You're Getting This is not a simplified tool dressed up as a gift. Prometheus Technican Version is a fully built, institutional-quality technical analysis indicator running a dual-model
FREE
フェニックス移動平均メーター (MT5) MetaTrader 5向けプロフェッショナルな移動平均トレンド分析・可視化ツール。インテリジェントな傾き分析、雲幅測定、相場状態分類を洗練されたリアルタイムダッシュボードに統合。 概要 フェニックス移動平均メーターは、速い移動平均と遅い移動平均の関係を分析し、トレンドの方向性、強さ、成熟度を判定します。本指標は移動平均の傾き角度、雲幅の拡大・縮小、クロスオーバー発生からの経過時間を継続的に監視し、現在の市場レジームをリアルタイムで分類します。 システムは二つの馬蹄形メーター表示を採用。傾き位置メーターは短期移動平均の角度を「下降→横ばい→上昇」まで可視化し、雲幅メーターはトレンドの圧縮・拡大を過去平均値と比較して測定します。両メーターが連動することで、勢いの質とトレンド持続性に関する即時的な洞察を提供します。 トレンド状態は強気・弱気双方において「弱」「中」「強」「延長」に自動分類されます。雲のカラーリングはトレンド状態に直接連動し、チャートとダッシュボード間の視覚的整合性を確保。ノイズを低減し、生指標値ではなく実用的なトレンド状態
FREE
Donchian Channel is an indicator created by Richard Donchian. It is formed by taking the highest high and the lowest low of the last specified period in candles. The area between high and low is the channel for the chosen period. Its configuration is simple. It is possible to have the average between the upper and lower lines, plus you have alerts when price hits one side. If you have any questions or find any bugs, please contact me. Enjoy!
FREE
Value Chart Candlesticks
Flavio Javier Jarabeck
4.57 (14)
The idea of a Value Chart indicator was presented in the very good book I read back in 2020 , " Dynamic Trading Indicators: Winning with Value Charts and Price Action Profile ", from the authors Mark Helweg and David Stendahl. The idea is simple and the result is pure genius: Present candlestick Price analysis in a detrended way! HOW TO READ THIS INDICATOR Look for Overbought and Oversold levels. Of course, you will need to test the settings a lot to find the "correct" one for your approach. It
FREE
Are you tired of drawing trendlines every time you're analyzing charts? Or perhaps you would like more consistency in your technical analysis. Then this is for you. This indicator will draw trend lines automatically when dropped on a chart. How it works Works similar to standard deviation channel found on mt4 and mt5. It has 2 parameters: 1. Starting Bar 2. Number of bars for calculation The   starting bar   is the bar which drawing of the trend lines will begin, while the   number of bars for c
FREE
Description (English) EMA 5-20-200 Cross Alerts (Fixed Alerts, No Repaint) This indicator combines three popular EMAs (5, 20, and 200) to help traders identify short-term, mid-term, and long-term trends. With visual arrows on the chart and automatic alerts (popup & push notification) , it allows traders to catch entries and trend confirmations without constantly monitoring the screen. Key Features: Plots EMA 5, EMA 20, and EMA 200 directly on the chart. Generates Buy/Sell signals (EMA5 vs
FREE
Multi-timeframe trend indicator based on the ADX / ADXWilder indicator with Fibonacci levels The indicator shows trend areas using ADX or ADXWilder indicator data from multiple timeframes. The impulse mode of the indicator allows you to catch the beginning of a trend, and several "Screens" with different timeframes allow you to filter out market noise. Fibonacci levels are added to the price chart, which have flexible settings. How the indicator works: if PDI is greater than NDI, then   it`s
FREE
Pivot Points Indicator – a fast, reliable, and fully customizable pivot detection for MetaTrader 5. This indicator uses MetaTrader’s native iHighest and iLowest functions to identify pivot highs and lows by scanning for the highest and lowest prices within a user-defined window of bars. A pivot is confirmed only when the current bar is the absolute maximum or minimum within the selected range, ensuring accurate and timely signals based on robust built-in logic. Key Features No Repainting : Onc
FREE
「Haven Key Levels PDH PDL」   インジケーターは、トレーダーがチャート上の主要なレベルを視覚化するのに役立ちます。次のレベルを自動的にマークします: DO (Daily Open)   — 日足の始値。 NYM (New York Midnight)   — ニューヨーク時間の深夜0時のレベル。 PDH (Previous Day High)   — 前日の高値。 PDL (Previous Day Low)   — 前日の安値。 WO (Weekly Open)   — 週足の始値。 MO (Monthly Open)   — 月足の始値。 PWH (Previous Week High)   — 前週の高値。 PWL (Previous Week Low)   — 前週の安値。 CMH (Current Month High)   — 当月の高値。 CML (Current Month Low)   — 当月の安値。 PMH (Previous Month High)   — 前月の高値。 PML (Previous Month Low)   — 前月の
FREE
The indicator identifies when a divergence occurs between price and an indicator or oscillator. It identifies both regular and hidden divergences. Combined with your own rules and techniques, this indicator will allow you to create (or enhance) your own powerful system. For higher probability setups I can recommend you to use my Supply Demand indicator and trade only if the divergence occurs inside a zone. Supply zone for bearish div and demand zone for bullish div. The optimal scenario is if it
FREE
この情報インジケーターは、アカウントの現在の状況を常に把握したい人にとって役立ちます。 VERSION MT 4 -   More useful indicators このインジケーターには、ポイント、パーセンテージ、通貨での利益、現在のペアのスプレッド、現在の時間枠でバーが閉じるまでの時間などのデータが表示されます。 チャート上に情報線を配置するには、いくつかのオプションがあります。 価格の右側 (価格の後ろにあります)。 コメントとして (グラフの左上隅に); 画面の選択した隅。 情報区切り記号を選択することもできます。 | / \ # このインジケーターは使いやすく、非常に有益です。設定で不要な情報項目を無効にすることも可能です。 設定 外観の種類     - 情報行の表示タイプ。次の 3 つのオプションがあります。 価格に従ってください     - 価格に従う。 コメントとして     - コメントとして; 画面の選択した隅に     - 画面の選択した隅にあります。 添付用グラフコーナー     - 表示タイプを選択した場合 画面の選択されたコーナーでは、この項目を使用して
FREE
This indicator extracts a trend from a price series and forecasts its further development. Algorithm is based on modern technique of Singular Spectral Analysis ( SSA ). SSA is used for extracting the main components (trend, seasonal and wave fluctuations), smoothing and eliminating noise. It does not require the series to be stationary, as well as the information on presence of periodic components and their periods. It can be applied both for trend and for another indicators. Features of the me
FREE
This indicator, "Phoenix Volume Amazing", is a sophisticated Volume Delta and Order Flow Dashboard. Unlike standard volume indicators that only show total activity, this tool dissects the internal "tug-of-war" between buyers and sellers in real-time. Core Functionality The indicator calculates Delta (the difference between buying volume and selling volume) to provide a "under the hood" look at market sentiment. It uses a custom-built GUI (Graphical User Interface) panel to display these metrics
FREE
このプロダクトを購入した人は以下も購入しています
Neuro Poseidon is a new indicator by Daria Rezueva. It combines precise trading signals with adaptive TP/SL levels - creating best possible trades as a result! Message me and get  Neuro Poseidon Assistant  as a gift to automize your trading process! What makes it stand out? 1. Proven profitability on all assets and timeframes 2. Only confirmed BUY and SELL signals present on the chart 3. Adaptive TP & SL levels generated by the software for each trade 4. Easy to understand - suitable for al
SuperScalp Pro
Van Minh Nguyen
4.68 (28)
SuperScalp Pro – プロフェッショナル多層コンフルエンス・スキャルピングシステム SuperScalp Proは、インテリジェントなマルチファクター確認システムを通じて高確率の取引機会を特定するために設計された、プロフェッショナルなマルチレイヤー・コンフルエンストレーディングシステムです。Supertrend、VWAP、EMA、RSI、ADX、出来高分析、ボリンジャーバンド、およびMACDダイバージェンスを統合することで、低品質なセットアップを排除し、ダマシのブレイクアウトシグナルを減らし、エントリー精度を向上させます。 XAUUSD、BTCUSD、および主要なForex通貨ペア向けに特別に最適化されたSuperScalp Proは、ATRベースのボラティリティロジックとルールベースのシグナル検証を通じて市場環境の変化に適応し、M1からH4までの複数時間足で一貫性と客観性のある取引確認を提供します。 内蔵されたスマートコントロールパネルにより、リアルタイムで完全なカスタマイズが可能です。トレーダーは個別の確認フィルターを有効または無効にし、市場環境、取引スタイル、リスク許
まず正直に言いましょう。 どんなインジケーターも、それ単体であなたを利益化させることはできません。もしそう言う人がいるなら、それは夢を売っているだけです。完璧な売買シグナル(矢印)を表示するインジケーターは、いくらでも“完璧に見せる”ことができます。正しい過去の区間を拡大して、勝ちトレードだけを切り取ればいいだけです。私たちはそれをしません。 SMC Intraday Formula はツールです。 市場構造を読み取り、最も高い確率の価格ゾーンを特定し、今この瞬間のスマートマネーの痕跡をシンプルな言葉で正確に示します。最終判断はあなたが行います。トレードを実行するのもあなたです。しかし今は「希望」ではなく「精度」でエントリーできます。 私たちはこのインジケーターを、ゴールド(XAUUSD)および主要FX通貨ペアで約3年間、日々のスキャルピングに使用してきました。M1、M5、M15、M30の主要ツールです。これは未来を予測しようとするのではなく、今まさに形成されている高確率セットアップを示し、その理由を説明します。 他のすべてのインジケーターと何が違うのか? ほとんどのトレーディングイ
Gold Entry Sniper – ゴールドスキャルピング&スイングトレード用プロフェッショナル多時間足ATRダッシュボード Gold Entry Sniper は、XAUUSDや他の銘柄向けに正確な 売買シグナル を提供する、MetaTrader 5用の高度なインジケーターです。 ATRトレーリングストップロジック と 多時間足分析ダッシュボード を搭載し、スキャルピングからスイングトレードまで対応します。 主な特徴と利点 多時間足シグナル分析 – M1、M5、M15 のトレンドを同時表示。 ATRベースのトレーリングストップ – ボラティリティに応じて動的に調整。 プロ仕様のチャートダッシュボード – シグナル状況、ATRレベル、回帰線、売買方向を表示。 明確な売買マーカー – 自動矢印とテキストラベル。 エグジットアラートとトレード管理 – 利益確定のための自動検出。 完全カスタマイズ可能 – パネル位置、色、フォント、ATR/回帰設定を調整可能。 ゴールド(XAUUSD)に最適化 – M1〜M15のスキャルピングに最適、FXや指数、暗号資産にも対応。 Gold Entry
開発者からのお知らせ: 149ドル で購入できるライセンスは残り  2 つ です。売り切れ後、価格は 169ドル に変更されます。 M1 Quantum は、M1専用のプロフェッショナルトレーディングシステムであり、ストップロス、テイクプロフィット、スマートな資金管理を内蔵した、迅速かつ正確な取引シグナルを提供します。 M1 Quantum は、 連続勝利 に重点を置いて口座を素早く成長させるために設計されたプロフェッショナルな資金管理を備えています。 M1 Quantum インジケーター の主な特徴 M1時間足 およびすべての 主要通貨ペア 向けに設計 すべての取引にストップロスとテイクプロフィットを設定 資金管理 を実装し、トレーダーが簡単に取引できるようサポート 高い勝率と高い 連続勝利 リペイントなし、遅延なし あらゆるトレーダーにとって理解しやすい M1 Quantum を使用するには、 M1 Quantum Assistant が必要です。この強力なツールは、M1 Quantum をご購入いただいたすべてのお客様に 無料 で提供されています。 M1 Quantum Ass
Entry In The Zone and SMC Multi Timeframe is a real-time 2-in-1 market analysis tool that combines market structure analysis and a No Repaint BUY / SELL signal system into a single indicator, built on Smart Money Concepts (SMC) — a widely adopted framework used by professional traders to understand market structure. This indicator helps you see the market more clearly, make decisions based on structure rather than guesswork, and focus on high-probability zones where price is more likely to react
Gann Made Easy   は、ミスター・ギャンの理論を使用した取引の最良の原則に基づいた、プロフェッショナルで使いやすい外国為替取引システムです。 W・D・ガン。このインジケーターは、ストップロスとテイクプロフィットレベルを含む正確な買いと売りのシグナルを提供します。 PUSH通知を利用して外出先でも取引可能です。 ご購入後、取引方法の説明と優れた追加インジケーターを無料で入手するには、私にご連絡ください! おそらく、ギャンの取引手法についてはすでに何度も聞いたことがあるでしょう。通常、ギャンの理論は初心者のトレーダーだけでなく、すでにある程度の取引経験がある人にとっても非常に複雑なものです。なぜなら、ギャンの取引手法は理論的にはそれほど簡単に適用できるものではないからです。私はその知識を磨き、最良の原則を私の外国為替インジケーターに組み込むために数年を費やしました。 このインジケーターは非常に簡単に適用できます。必要なのは、それをチャートに添付し、簡単な取引推奨事項に従うだけです。このインジケーターは常に市場分析の仕事を行い、取引の機会を探します。適切なエントリーポイントを検
このインジケーターを購入された方には、以下の特典を 無料 で提供しています: 各トレードを自動で管理し、ストップロスとテイクプロフィットを設定し、戦略ルールに基づいてポジションを決済する補助ツール 「Bomber Utility」 様々な銘柄に合わせたインジケーターの設定ファイル(セットファイル) 「最小リスク」、「バランスリスク」、「待機戦略」 の3つのモードで使用できる Bomber Utility 用の設定ファイル このトレーディング戦略をすぐに導入・設定・開始できる ステップバイステップのビデオマニュアル ご注意: 上記の特典を受け取るには、MQL5のプライベートメッセージシステムを通じて販売者にご連絡ください。 オリジナルのカスタムインジケーター 「Divergence Bomber(ダイバージェンス・ボンバー)」 をご紹介します。これは、MACDのダイバージェンス(乖離)戦略に基づいた 「オールインワン」型のトレーディングシステム です。 このテクニカルインジケーターの主な目的は、価格とMACDインジケーターの間に発生するダイバージェンスを検出 し、将来の価格の動きを示す
Power Candles V3 - 自己最適化型強弱インジケーター Power Candles V3は 、通貨や銘柄の強さを、適用されたすべてのチャート上で実行可能なトレードプランに変換します。単にローソク足を色分けするだけでなく、バックグラウンドでリアルタイムの自動最適化を実行し、目の前の銘柄に対して最適なストップロス、テイクプロフィット、およびシグナルの閾値を提示します。ワンクリックで実取引に適用でき、エントリーポイント、ストップロス、テイクプロフィットのラインが正確な価格位置にチャート上に表示され、方向性を示すアラートがリアルタイムで発動します。 このツールは、Stein Investmentsのエコシステムの一部です。  18種類以上のツールをすべて閲覧し、AIを活用したセットアップの推奨事項を入手し、  https://stein.investments でコミュニティに参加しましょう クローズしたバーごとに3,000回以上のトレードシミュレーション。9つの強さの状態。2つの戦略を並行してテスト。勝率の高い設定をワンクリックで適用。 なぜこれが必要なのか ほとんどの強
PrimeScalping is a powerful trading companion designed to generate high-probability entry signals with dynamic TP/SL/DP levels based on volatility. Built-in performance tracking shows win/loss stats, PP1/PP2 hits, and success rates — all updated live. Key Features: Buy/Sell signals with adaptive volatility bands Real-time TP/SL/DP levels based on ATR Built-in MA Filter with optional ATR/StdDev volatility Performance stats panel (Success, Profit/Loss, PP1/PP2) Alerts via popup, sound, push, or e
この製品は 2026 年の市場向けに更新され、最新の MT5 ビルドに最適化されています。 価格更新のお知らせ: Smart Trend Trading System は現在 $99 で提供されています。 次の 30 件の購入 後、価格は $199 に上がります。 特別オファー: Smart Trend Trading System を購入後、私にプライベートメッセージを送ることで、 Smart Universal EA を無料 で受け取り、Smart Trend のシグナルを自動売買に変えることができます。 Smart Trend Trading System は、リペイントなし、再描画なし、遅延なしの完全なトレーディングシステムです。よりクリーンなシグナル、より明確なトレンド方向、そしてより整理された取引方法を求めるトレーダー向けに作られています。 Online course , manual and [download presets] . このシステムは、トレンド検出、反転ゾーン、Smart Cloud、トレーリングストップロジック、サポートとレジスタンス、ローソク足の色分け
トレンドキャッチャーインジケーター トレンドキャッチャーインジケーターは、開発者独自の適応型トレンド分析指標を組み合わせることで、市場価格の動きを分析します。短期的なノイズを除去し、根底にあるモメンタムの強さ、ボラティリティの拡大、価格構造の挙動に焦点を当てることで、真の市場方向性を特定します。また、移動平均線、RSI、ボラティリティフィルターなどの平滑化およびトレンドフィルタリング機能を備えたカスタマイズ指標も使用します。 実際の運用状況のモニタリングやその他の製品については、こちらをご覧ください: https://www.mql5.com/en/users/mechanic/seller ご注意ください。私はTelegramでEAや設定を販売していません。詐欺です。すべての設定はブログで無料で公開しています。 重要!ご購入後すぐにご連絡ください。手順とボーナスをお送りします!
UZFX {SSS} スキャルピング・スマートシグナル v4.0 MT5は、変動の激しい市場において正確かつリアルタイムのシグナルを求めるスキャルパー、デイトレーダー、スイングトレーダー向けに設計された、リペイントのない高性能な取引インジケーターです。(UZFX-LABS)によって開発されたこのインジケーターは、価格行動分析、トレンド確認、スマートフィルタリングを組み合わせることで、すべての通貨ペアおよび時間軸において、高確率の売買シグナル、警告シグナル、トレンド継続の機会を生成します。 トレードの判断に迷うのはもうやめましょう。明確さ、正確さ、そして規律ある市場執行を求めるトレーダーのために設計された、体系的なシグナルシステムに従い始めましょう。 私のおすすめ* 最適な時間足:15分足以上。 {H1} が私のお気に入りです。そして、その成果は驚異的です…!! 主な機能の更新 • 自動売買シグナル検出 • 高度な反転認識ロジック • 市場反転の可能性に先立つ早期警告シグナル • トレンド継続確認シグナル • エントリー、ストップロス、TP1、TP2、TP3レベルを備えた組み込み型
Trend Sniper X
Sarvarbek Abduvoxobov
5 (2)
Trend Sniper X — 概要 Trend Sniper X は、HTF SuperTrendエンジンとEMAフィルターを組み合わせた、MetaTrader 5用のマルチタイムフレーム・トレンド追従型インジケーターです。上位タイムフレームのトレンド方向に応じて現在のタイムフレームのローソク足の色を変更し、トレンドの転換点をBUY/SELL矢印でマークします。 価格情報: 現在の価格はプロモーション価格であり、今後のアップデートや新機能のリリースに伴い変更される場合があります。 Code2Profitチャンネル   マルチタイムフレーム分析で市場をマスターしよう!   技術仕様 プラットフォーム MetaTrader 5 インジケータータイプ マルチタイムフレーム・トレンドキャンドル(SuperTrendベース) シグナルソース HTF SuperTrend (ATRベース) + HTF EMAフィルター 動作タイムフレーム 任意のチャートタイムフレーム。独立して選択可能な上位タイムフレーム(M1〜MN1)に対応 主要銘柄 FX、ゴールド(XAUUSD)およびその他のCFD商品
ご紹介     Quantum Breakout PRO は 、ブレイクアウト ゾーンの取引方法を変革する画期的な MQL5 インジケーターです。 13年以上の取引経験を持つ経験豊富なトレーダーのチームによって開発されました。     クォンタム ブレイクアウト プロ   は、革新的でダイナミックなブレイクアウト ゾーン戦略により、あなたのトレーディングの旅を新たな高みに押し上げるように設計されています。 クォンタム ブレイクアウト インジケーターは、5 つの利益ターゲット ゾーンを備えたブレイクアウト ゾーン上のシグナル矢印と、ブレイクアウト ボックスに基づいたストップロスの提案を提供します。 初心者トレーダーにもプロのトレーダーにも適しています。 量子EAチャネル:       ここをクリック 重要!購入後、インストールマニュアルを受け取るためにプライベートメッセージを送ってください。 推奨事項: 時間枠: M15 通貨ペア: GBPJPY、EURJPY、USDJPY、NZDUSD、XAUUSD アカウントの種類: ECN、Raw、またはスプレッドが非常に低い R
この製品は 2026 年の市場向けに更新され、最新の MT5 ビルドに最適化されています。 価格更新のお知らせ: Atomic Analyst は現在 $99 で提供されています。 次の 30 件の購入 後、価格は $199 に上がります。 特別オファー: Atomic Analyst を購入後、私にプライベートメッセージを送ることで、 Smart Universal EA を無料 で受け取り、Atomic Analyst のシグナルを自動売買に変えることができます。 Atomic Analyst は、リペイントなし、再描画なし、遅延なしの Price Action トレーディングインジケーターで、手動取引、シグナルの明確化、EA 自動化のために設計されています。 User manual: settings, inputs and strategy.   &   User Manual PDF . 価格行動、強さ、モメンタム、マルチタイムフレーム方向、高度なフィルターを分析し、トレーダーがノイズを減らし、弱いセットアップを避け、より構造化された取引判断を行えるようにします。 このイ
このインジケーターは、市場で 関心が示されたゾーン をハイライトし、その後に 注文の蓄積ゾーン を表示します。 これは、大規模な**板情報(オーダーブック)**のように機能します。 これは、 巨大な資金 のためのインジケーターです。その性能は卓越しています。 市場にどんな関心が存在していても、 必ず目に見えるようになります 。 (これは 完全に再設計され、自動化されたバージョン です。もはや手動分析は必要ありません。) トランザクションスピード(取引速度) は新しい概念のインジケーターで、市場で大口注文が どこに・いつ 集中しているかを示し、それに基づいたチャンスを提供します。 トレンドの変化を 非常に早い段階 で察知することができます。 FXでは「出来高」と呼ばれているものは誤解されています。実際には、これは 時間あたりの価格変動量 です。したがって、正しい名称は トランザクションスピード です。 考え方・行動・分析の仕方すべてが問われます。 分析パラダイムの転換は非常に重要です。 このインジケーターは、FXにおける出来高の考え方を 根本から再定義 し、論理的な形で正確に活用する、
Quantum TrendPulse を ご紹介します。これは、   SuperTrend   、   RSI   、および Stochastic のパワーを 1 つの包括的なインジケーターに組み合わせて、取引の可能性を最大限に引き出す究極の取引ツールです。精度と効率を求めるトレーダー向けに設計されたこのインジケーターは、市場のトレンド、勢いの変化、最適なエントリー ポイントとエグジット ポイントを自信を持って特定するのに役立ちます。 主な特徴: SuperTrend 統合: 現在の市場動向に簡単に追従し、収益性の波に乗ることができます。 RSI精度: 買われすぎと売られすぎのレベルを検出し、市場の反転のタイミングに最適で、SuperTrendのフィルターとして使用されます。 確率的精度: 確率的振動を活用して、変動の激しい市場で隠れたチャンスを見つけます。SuperTrend のフィルターとして使用されます。 マルチタイムフレーム分析:   M5 から H1 または H4 まで、さまざまなタイムフレームで市場を常に把握します。 カスタマイズ可能なアラート: カスタム取引条件が満たされ
GEM Signal Pro GEM Signal Pro は、MetaTrader 5 向けのトレンドフォロー型インジケーターです。より明確なシグナル、より整理されたトレードセットアップ、そして実用的なリスク管理をチャート上で確認したいトレーダーのために設計されています。 単純な矢印だけを表示するのではなく、GEM Signal Pro はトレード全体の考え方を、より見やすく分かりやすい形で表示します。条件が確認されると、インジケーターはエントリー価格、ストップロス、利確目標をチャート上に表示し、トレードセットアップをより効率的に確認できるようにします。 動作の仕組み このインジケーターは、まず内部ロジックに基づいて有効なシードシグナルを検出します。 確認条件が満たされると、GEM Signal Pro はチャート上に完全なセットアップを表示します。これにより、トレーダーはトレード構造をより明確に把握し、手作業による分析を減らすことができます。 チャート上のトレードレベル 確認済みシグナルに対して、GEM Signal Pro は以下を表示できます。 エントリー価格 ストップロス テ
ARIPoint
Temirlan Kdyrkhan
1 (1)
ARIPoint is a powerful trading companion designed to generate high-probability entry signals with dynamic TP/SL/DP levels based on volatility. Built-in performance tracking shows win/loss stats, PP1/PP2 hits, and success rates all updated live. Key Features: Buy/Sell signals with adaptive volatility bands Real-time TP/SL/DP levels based on ATR Built-in MA Filter with optional ATR/StdDev volatility Performance stats panel (Success, Profit/Loss, PP1/PP2) Alerts via popup, sound, push, or email Cu
BTMM State Engine Pro is a MetaTrader 5 indicator for traders who use the Beat The Market Maker approach: Asian session context, kill zone timing, level progression, peak formation detection, and a multi-pair scanner from a single chart. It combines cycle state logic with a built-in scanner dashboard so you do not need the same tool on many charts at once. What it does Draws the Asian session range; session times can follow broker server offset or be set in inputs. Tracks level progression (L
FX Trend NG:次世代マルチマーケット・トレンドインテリジェンス 概要 FX Trend NG は、複数の時間足に対応したプロフェッショナル向けトレンド分析およびマーケット監視ツールです。 市場全体の構造を数秒で把握することができます。 複数のチャートを切り替える必要はありません。どの銘柄がトレンド中なのか、どこでモメンタムが弱まっているのか、そしてどの時間足で強い整合性があるのかを瞬時に確認できます。 ローンチ特別オファー – FX Trend NG を $30(6ヶ月) または $80 永久ライセンス でご利用いただけます。 すでに Stein Investments のユーザーですか? -> メッセージを送信 して、プライベートグループへアクセスしてください。 セットアップや詳細情報が必要ですか? -> Stein Investments 公式ページ をご覧ください。 1. FX Trend NG が他と異なる理由 3ステート・トレンドロジック ― Buy と Sell だけではない • 多くのインジケーターは Buy または Sell の2状態のみを表示します。
GoldenX Entryは、MT5向けのインジケーターであり、適応型Smart Entry Trendアルゴリズム、シグナルスコアリングシステム、マーケットレジーム検出機能、およびボラティリティフィルターを備えています。各シグナルには、計算されたエントリーレベル、3つのテイクプロフィット(TP1、TP2、TP3)、およびストップロスレベルが含まれます。本インジケーターは、異なる市場環境に適応するために設計された複数の分析レイヤー上に構築されており、マルチレイヤー分析システムと内蔵オプティマイザーおよび統計トラッキングシステムを組み合わせています。リスク・リワード(RR)指標および過去のトレード履歴に基づく定量分析を提供します。 使い始めは簡単です — 選択した時間足でオプティマイザーを実行し、そのままチャート上でインジケーターを使用します。 コア機能 GoldenX Entryは、シグナルエンジンとトレード管理機能、そして過去統計トラッキングを1つのチャートに統合しています: - 内蔵オプティマイザー: オプティマイザーはチャート上でワンクリックで実行できます。200通りのパラメー
Crystal Heikin Ashi Signals - Professional Trend & Signal Detection Indicator Advanced Heikin Ashi Visualization with Intelligent Signal System for Manual & Automated Trading Final Price: $149 ---------> Price goes up $10 after every 10 sales . Limited slots available — act fast . Overview Crystal Heikin Ashi Signals is a professional-grade MetaTrader 5 indicator that combines pure Heikin Ashi candle visualization with an advanced momentum-shift detection system. Designed for both manual traders
Current event:  https://c.mql5.com/1/326/A2SR2025_NoMusic.gif MT5向けA2SR インジケーター:自動実需給(S/R)。 + 取引商品。 Product description in English here. --   Guidance   : -- at   https://www.mql5.com/en/blogs/post/734748/page4#comment_16532516 -- and  https://www.mql5.com/en/users/yohana/blog 強力で信頼性が高く、時間を節約。よりスマートな取引判断を実現。 + EA互換オブジェクト。 主な利点 先行する実SRレベル(遅延やリペイントなし) 2014年以来、MT4で長年にわたり信頼性が実証されてきたA2SRが 、MetaTrader 5でも利用可能になりました。 価格がサポートレベルとレジスタンスレベルに到達する前に、実際のサポートレベルとレジスタンスレベルを特定できる、リペイントなしの先行インジケーターにより、トレー
FX Power: 通貨の強弱を分析して、より賢い取引を実現 概要 FX Power は主要通貨と金の実際の強弱をあらゆる市場状況で理解するための必須ツールです。強い通貨を買い、弱い通貨を売ることで、 FX Power は取引の意思決定を簡素化し、高い確率の取引機会を見出します。トレンドを追従する場合でも、極端なデルタ値を使用して反転を予測する場合でも、このツールはあなたの取引スタイルに完全に適応します。ただ取引するだけではなく、 FX Power で賢く取引をしましょう。 1. なぜ FX Power がトレーダーにとって非常に有益なのか 通貨と金のリアルタイム強弱分析 • FX Power は主要通貨と金の相対的な強弱を計算し、マーケットダイナミクスに関する明確な洞察を提供します。 • どの資産がリードしているか、または後れを取っているかを監視して、取引するペアを賢く選びましょう。 マルチタイムフレームの包括的なビュー • 短期、中期、長期のタイムフレームで通貨と金の強弱を追跡し、マーケットトレンドに基づいて取引戦略を調整できます。 • スキャルピングからスイングトレード
Azimuth Pro
Ottaviano De Cicco
5 (7)
Azimuth Pro V2:MT5向けシンセティック・フラクタル構造分析と確認済みエントリー 概要 Azimuth Pro は Merkava Labs によるマルチレベルスイング構造インジケーターです。4つのネストされたスイングレイヤー、スイングアンカーVWAP、ABCパターン検出、3タイムフレーム構造フィルタリング、そして確定バーでの確認済みエントリー — 1つのチャートで、ミクロスイングからマクロサイクルまでを網羅するワークフロー。 これはブラインドシグナル製品ではありません。ロケーション、コンテキスト、タイミングを重視するトレーダーのための構造ファーストワークフローです。 ️ サマーセール — 夏至とThe Oracle Proの発売を記念して、Azimuth Proが30%オフ。現在279 USD(通常399 USD)。期間限定の夏季オファー。 1. V2での変更点 シンセティック・マルチタイムフレームエンジン 上位タイムフレーム分析をMeridian Proと同じ独自のシンセティックアーキテクチャで一から再構築。よりクリーンなHTFコンテキスト、安定したライブ動作、
AXIOM MATRIX MT5 ローンチ価格:$99 Axiom Matrix はローンチ価格 $99 でご利用いただけます。 最初の30件の購入後、価格は $199 に上がります。 Axiom Matrix は、MetaTrader 5 用のプロフェッショナルなマルチシンボル・マルチタイムフレーム市場スキャナー兼意思決定ダッシュボードです。 Market Watch をスキャンし、複数の時間足を分析し、複数のエビデンスエンジンを読み取り、最も強いチャンスを比較し、1つのクリーンなマトリックスダッシュボード内で最適な BUY、SELL、WAIT、またはブロック状態を表示します。 私が Axiom Matrix を作った理由は、市場スキャンという重い作業を代わりに行ってくれる1つのツールが欲しかったからです。 RSI だけを確認したくありませんでした。 次に MACD だけ。 次に移動平均線。 次に出来高。 次にボラティリティ。 次にサポートとレジスタンス。 そして、1つのトレードアイデアを作るためだけに、銘柄と時間足を手動で切り替えることもしたくありませんでした。 私は、市場をスキャ
Gold Stuff mt5
Vasiliy Strukov
4.9 (192)
Gold Stuff mt5 は、金専用に設計されたトレンド指標であり、あらゆる金融商品にも使用できます。 インジケーターは再描画せず、遅れません。 推奨時間枠 H1. 設定と個人的なボーナスを得るために、購入後すぐに私に連絡してください!  トレンド スキャナーの強力なサポートを利用して、無料のインジケーターを入手し、プライバシーを守ります。あーみー!   設定 矢印を描く - オンオフ。 チャートに矢印を描く。 アラート - 可聴アラートのオンオフ。 メール通知 - オンオフ。 電子メール通知。 プチ通知 - オンオフ。 プッシュ通知。 次に、色域を調整します。 Gold Stuff mt5 は、金専用に設計されたトレンド指標であり、あらゆる金融商品にも使用できます。 インジケーターは再描画せず、遅れません。 推奨時間枠 H1. 設定と個人的なボーナスを得るために、購入後すぐに私に連絡してください!   設定 矢印を描く - オンオフ。 チャートに矢印を描く。 アラート - 可聴アラートのオンオフ。 メール通知 - オンオフ。 電子メール通知。 プチ通知 - オンオ
Quant Direction は、3次元の市場分析ツールです。完全に客観的なアルゴリズムベースの市場分析を提供し、様々なパラメータにわたる正確なパーセンテージ偏差を同時に算出します。高度なAI搭載モデリングツールで開発され、厳密なテストを経て開発されたこのアルゴリズムは、かつてない精度で市場を分析するように設計されています。プラットフォーム上では、あらゆる通貨ペアや金融商品を分析できます。 短期取引、デイトレード、スイングトレードなど、どのような取引スタイルに も、Quant Directionは最適な選択肢です。 オペレーターの本当の利点 Quant Directionの真の利点は、感情、眼精疲労、過剰分析を完全に排除できる点にあります。方向性を探るために何十ものチャートを手作業で精査したり、自分の好みを常に疑ったりする必要がなくなります。このシステムは、8つの時間間隔(5ヶ月から月単位まで)をミリ秒単位で処理します。あらゆる瞬間に市場を支配している主体を正確に明らかにし、常に成功確率が最も高い方向で取引できるようにします。 市場分析の3つの側面 このアルゴリズムは市場を3つの
フィルタ:
Yassou Kalimera
853
Yassou Kalimera 2025.01.10 12:43 
 

well

レビューに返信