• 概要
  • レビュー
  • コメント

Fifty

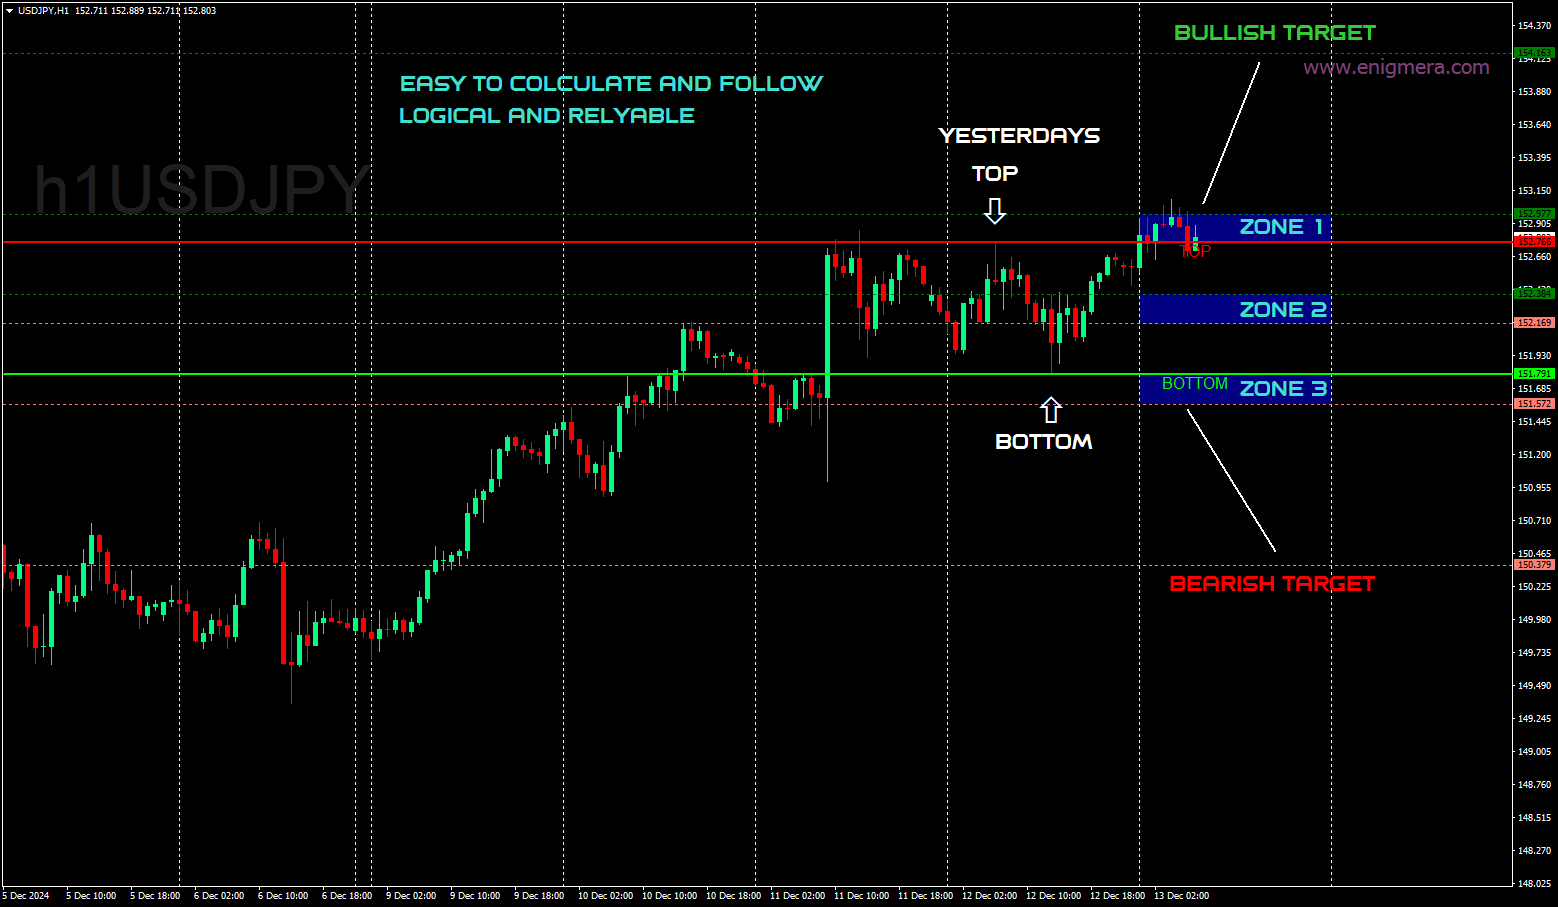
The 50% level holds significant importance in the market because it acts as a dividing line between bullish and bearish movements.

Traders often rely on this midpoint to analyze trends and predict potential reversals.

It is among the most logical and widely recognized concepts in financial markets.

The 50% level also serves as a psychological barrier, influencing decisions of both retail and institutional traders, making it a cornerstone in technical analysis.

One of the few indicators on the market that are not dependent on time frames, but only on price.

Paid pro version of the indicator is available. It draws daily, weekly and monthly zones automatically.


Enjoy!


おすすめのプロダクト
Breakout Box
Claus Dietrich
4.45 (22)
BREAKOUT-SESSION-BOX LONDON EU US ASIA Open watch the expectation of a volatile movement above or under the opening range We take the high of the range as Entry for a long trade and SL will be the low of the range and vice versa the low of the range as Entry for a short trade and the high for SL The size of the range is the distance to the TP (Take Profit) The range of the opening hours should not be larger than about 1/3 of the average daily range 4 breakout examples are already predefined: A
FREE
The  RSI Basket Currency Strenght  brings the RSI indicator to a new level.  Expanding the boundaries of TimeFrames and mono-currency analysis, the RSI Multi Time Frame Currency Strenght take the movements of each currency that composes the cross and confront them in the whole basket of 7 crosses.  The indicator works with any combination of  AUD, CAD, CHF, EUR, GBP, JPY, NZD, USD  pairs and with full automation takes in account every RSI value for the selected Time Frame.  After that, the indic
FREE
Description I think, almost all traders dream about non-lagging MA. I have realized that dream in my indicator. It allows forecasting future MA values! The indicator can be used in four different ways: The first one - forecast for the desired amount of bars. Thus, you are able to evaluate future price behavior. The second one - generating non-lagging "averages". That can be implemented by moving MA back by the half of the averaging period and setting the forecast the necessary amount of bars ahe
FREE
Super trend is one of the best trend indicators in metatrader 4 (MT4). Triple SuperTrend indicator is an indicator that consist of three super trend indicator that can be aranged. This indicator is built by mql4 language and doesn't provided by MT4 platform. Highly recommended using EMA SuperTrend Strategy Indicator if you want to get better result in here: https://www.mql5.com/en/market/product/91664 This indicator is easy to use, power full and has many benefits, there are: Using three indic
FREE
このエキスパートアドバイザーは取引を行いませんが、マーケットウォッチ内のシンボル全体をスキャンし、異なる時間枠で各株を 1 つずつスキャンし、最後に、どの時間枠のどのシンボルが強力な巻き込みローソク足を持っているかを示します。 さらに、MA 期間と RSI の上限と下限を定義でき、どのタイムフレームのどのシンボルが調整済み移動平均を超えるか、また、どのタイムフレームのどのシンボルが調整移動平均の上限または下限を超えるかが表示されます。 RSI。 Kono ekisupātoadobaizā wa torihiki o okonaimasenga, mākettou~otchi-nai no shinboru zentai o sukyan shi, kotonaru jikan-waku de kaku kabu o 1-tsu zutsu sukyan shi, saigo ni, dono toki-waku no dono shinboru ga kyōryokuna makikomi rōsoku ashi o motte iru ka o shimeshimasu. S
FREE
Currency Scoring
Mr Nukool Chanchingchit
5 (4)
What is a tool ? This indicator use for comparison of 8 major currency from 28 pairs and multiple timeframes and calculates a score of strength from 0-100. How to use Place the indicator on any pair any timeframe, And entering only the value of X Y position to be displayed in the graph. Pair   : Any Timeframe   : Any Input Parameter Start X Position   : Value of X on chart Start Y Position  : Value of Y on chart Visit my products Target Profit Magic Target Profit All The Profit Tracker Currency
FREE
MQLTA Candle Timer
MQL4 Trading Automation
5 (1)
MQLTA Candle Timer is an indicator that can show you the details about a symbol/pair and alert you before the close of a candle. Used in swing trading and not only, it can help your strategies knowing and be ready before the close of a candle. How does it work Simply add the indicator to the chart and set the notifications options. You can load a minimalistic interface or a full interface. The alert will be sent once per candle. Parameters All the parameters, that you can see in the picture, a
FREE
This indicator uses a different approach from the previous version to get it's trendlines. This method is derived from Orchard Forex, and the process of making the indicator is demonstrated in there video   https://www.youtube.com/watch?v=mEaiurw56wY&t=1425s . The basic idea behind this indicator is it draws a   tangent line   on the highest levels and lowest levels of the bars used for calculation, while ensuring that the lines don't intersect with the bars in review (alittle confusing? I know
FREE
CYCLE WAVE OSCILLATOR indicator is an indicator based on cyclical price fluctuations. This indicator can help you determine overbought and oversold levels, and help you predict price trends within the cycle. MT5 Version here!  You can combine it with our indicators below to make your trading decisions more accurate: Supply Demand Ribbon MT4 Basic Feature: - Three Trend Types: + Zero + Basic + Advanced
FREE
MT Scanner
Niravkumar Maganbhai Patel
4 (2)
This indicator helps you to Scan symbols which are in the Market Watch Window  and filter out trends with alerts. It works based on the effective indicator "SUPERTREND" which is used by many traders for trading: When box color changes to " Green " or " Red " color, it indicates you for trend change for long and short entry. And also you will get alerted on screen. When it changes to " Green ", it indicates you that trend is going upwards, and you can take the long entry. If the color changes to
FREE
MACD Scanner With Alerts
Niravkumar Maganbhai Patel
4 (2)
MACD Dashboard Panel   This indicator helps you to scan symbols which are in the Market Watch window and filter out a trend according to MACD. Moving Average Convergence Divergence (MACD) is a trend-following momentum indicator that shows the relationship between two moving averages of a security’s price. The MACD is calculated by subtracting the 26-period Exponential Moving Average (EMA) from the 12-period EMA. The result of that calculation is the MACD line. A nine-day EMA of the MACD called
FREE
The Magic SMMA indicator is of great help in determining trend direction. It can be an excellent addition to your existing strategy or the basis of a new one. We humans can make better decisions when we see better visually. So we designed it to show a different color for rising and falling trends. Everyone can customize this in the way that suits them best. By setting the Trend Period, we can optimize it for longer or shorter trends for our strategy. It is great for all time frames. IF YOU NEE
FREE
Bands Plus
Alexander Chertnik
4.42 (12)
Designed mainly for  USDCAD 1H market. Minimum trading account 100 $. Expert advisor operates by unique   Bands strategy and transaction algorithm. settings: minBalance - minimum account balance for trading maxSpread - maximum allowed spread for trading  maxLoss - maximum loss for stop trading lotControl - lot control and auto lot activation bandsPeriod - indicator period tradeProfit - profit for exit USEtradeRange - if true, will operate with range between trades tradeRange - range distance
FREE
Volume MA
Amirhossein Ghasemi Moroodi
After 7 years I decided to release some of my own indicators and EAs for free. If you find them useful please  Show support with a 5-star rating! Your feedback keeps the free tools coming! See other my free tools as well here _________________________________ Volume Moving Average (Volume MA) Indicator for Advanced Forex Market Analysis Introducing the Volume Moving Average (Volume MA) Indicator, meticulously developed in MQL4, a pivotal tool for enhancing your forex trading strat
FREE
NIGHTCrusher Lite FREE
Christian Opperskalski
4.5 (2)
NIGHTCRUSHER is a fully automated expert advisor, designed for scalping on quite market situation. The Lite - Version is limited to minimal Lot per Pair and dont has lot mulitplier and dynamic function you can also run different strategies like swing trading or grid different Trade Entry Signals different Exit Strategies included (MA Cut / Signal Change / Trailing TP) clever Risk & Money management - Balance based - Longrun trades tracking You can also use a Grid function or Lot multipier, if ne
FREE
- This is the exact conversion from TradingView: " 200-EMA Moving Average Ribbon" By "Dale_Ansel". - This indicator plots a series of moving averages to create a "ribbon" that offers a great visual structure to price action. - This indicator lets you read buffers. For information on buffers please contact via message. - This is a non-repaint and light processing load indicator
FREE
This indicator draws on the chart high and low prices of different periods . And If you want, Indicator can alert you when the current price arrive these levels. Alert Options:   Send Mobil Message, Send E-mail, Show Message, Sound Alert Time Periods:  M1, M5, M15, M30, H1, H4, D1, W1, MN Inputs:  TimeShift: You can set start hour for calculating. And that way you can see levels independently from broker server's time-zone. PipDeviation: You can set price sensibility for alert (Default: 3) Lines
FREE
QuantumAlert Stoch Navigator is a free indicator available for MT4/MT5 platforms, its work is to provide "alerts" when the market is inside "overbought and oversold" regions in the form of "buy or sell" signals. This indicator comes with many customization options mentioned in the parameter section below, user can customise these parameters as needful. Join our   MQL5 group , where we share important news and updates. You are also welcome to join our private channel as well, contact me for the p
FREE
Instant Trend Line  this indicator has been designed for multi time frame Buy Call: When the Blue Moving average (MA) line crossed above the Red Moving average (MA) . Sell Call: When the Blue Moving average (MA) line crossed below the Red Moving average (MA) . Happy and profitable trade for ever!!! this indicator is suitable for all time frame, but our recommended time frame is above 15 min chart. Suitable to all the forex chart
FREE
Индикатор отображает скользящие средние на заданном количестве баров ( Count bar for show MA ). Данный способ отображения упрощает анализ, так как график не загромождён лишними линиями. Так же имеется текстовая метка с отображением текущей цены скользящей средней и периода графика. Горячие клавиши служат для упрощения использования индикатора.  Настройки индикатора: Moving average #1 - скользящая средняя #1 Period - период усреднения Mode - метод сглаживания Price - используемая цена для расчё
FREE
Free informative Indicator-helper. It'll be usefull for traders who trade many symbols or using grid systems (Averaging or Martingale). Indicator counts drawdown as percent and currency separate. It has a number of settings: Count deposite drawdown according equity value and send e-mail or notifications to user if DD more than set; Sending e-mail when max open orders reached; Shows price and remaining pips amount before MarginCall on current chart and Account generally; Display summary trade lot
FREE
To get access to MT5 version please click   here . This is the exact conversion from TradingView: "Hammer & ShootingStar Candle Detector" by "MoriFX". This is a light-load processing and non-repaint indicator. All input options are available.  Buffers are available for processing in EAs. You can message in private chat for further changes you need. Thanks.
FREE
Dark Bands
Marco Solito
4.95 (133)
Dark Bands   is an Indicator for intraday trading. This Indicator is based on   Counter Trend  strategy but use also Volatility. We can enter in good price with this Indicator, in order to follow the inversions on the current instrument. Key benefits Easily visible take profit/stop loss lines Reliable bands lines with futuristic colors, and  Intuitive directional arrows Useful   statistics , which indicate the   win rate   of the signals   Plus Package  available, leave a feedback to receive
FREE
please leave 5 stars to me A   support level   is a level where the price tends to find support as it falls. This means that the price is more likely to "bounce" off this level rather than break through it. However, once the price has breached this level, by an amount exceeding some noise, it is likely to continue falling until meeting another support level. A   resistance level   is the opposite of a support level. It is where the price tends to find resistance as it rises. Again, this means t
FREE
Lisek Stochastic
Darius Hans Lischka
2.83 (6)
Lisek Stochastic   oscillator indicator with Alarm, Push Notifications and e-mail  Notifications. The Stochastic indicator is a momentum indicator that shows you how strong or weak the current trend is. It helps you identify overbought and oversold market conditions within a trend. The Stochastic indicator is lagging indicator, which means it don't predict where price is going, it is only providing data on where price has been !!! How to trade with Stochastic indicator: Trend following: As long
FREE
Trend Line Finder will project forward a support and resistance lines using 2 previous highs for resistance and 2 previous lows for support.  It will then signal to the trader by alert making the trader more aware that a possible good move is about to happen.     This is not a stand-alone trading system but is very useful in finding key areas of support resistance levels where price will usually either rebound from or breakthrough. Its down to the trader to decide what to do with use of other s
FREE
Expert description The Expert Advisor's trading system is based on entry and exit at a certain deviation of the asset price from the moving average value. The Expert Advisor has a number of parameters, by manipulating which you can implement different trading systems and also get different results when trading on different assets, keep this in mind when setting up an Expert Advisor and do not use standard settings on all instruments and time frames. Recommendations for use The EA working time
FREE
The principle of this indicator is very simple: detecting the candlestick pattern in M5 timeframe, then monitoring the return point of graph by using the pullback of High-Low of M5 Candlestick and finally predicting BUY and SELL signal with arrows, alerts and notifications. The parameters are fixed and automatically calculated on each time frame. Example: If you install indicator on XAUUSD, timeframe M5: the indicator will detect the reversal, pullback, price action on this timeframe (for exam
FREE
MP Gradient Adaptive RSI oscillator uses AMA with the basic RSI to cover the retracements with minimum lag. Trigger line crossing the oscillator will provide an entry point for trader. Settings: RSI period: period of the oscillator Sensitivity of the oscillator: controls the sensitivity of the oscillator to retracements, with higher values minimizing the sensitivity to retracements. RSI applied price: source input of the indicator Number of bars to draw: is used when the Fill Type option is no
FREE
XOATRHIST
Ainur Sharipov
4.83 (6)
This is one of my first indicators. Slightly improved. The indicator is based on point and figure chart, but their period is equal to ATR indicator values. Parameters: ATRPeriod - ATR period for calculation of steps. XOPips - manual pararmetr, ATR ignoring. Note: The indicator uses closes price, thus it is recommended to consider completed bars. There is a more visual, with the display of lines on the chart and alerts, paid version of XOatrline
FREE
このプロダクトを購入した人は以下も購入しています
Gann Made Easy は、ミスター・ギャンの理論を使用した取引の最良の原則に基づいた、プロフェッショナルで使いやすい外国為替取引システムです。 W・D・ガン。このインジケーターは、ストップロスとテイクプロフィットレベルを含む正確な買いと売りのシグナルを提供します。 PUSH通知を利用して外出先でも取引可能です。 購入後はご連絡ください!私の取引のヒントと素晴らしいボーナスインジケーターを無料で共有します! おそらく、ギャンの取引手法についてはすでに何度も聞いたことがあるでしょう。通常、ギャンの理論は初心者のトレーダーだけでなく、すでにある程度の取引経験がある人にとっても非常に複雑なものです。なぜなら、ギャンの取引手法は理論的にはそれほど簡単に適用できるものではないからです。私はその知識を磨き、最良の原則を私の外国為替インジケーターに組み込むために数年を費やしました。 このインジケーターは非常に簡単に適用できます。必要なのは、それをチャートに添付し、簡単な取引推奨事項に従うだけです。このインジケーターは常に市場分析の仕事を行い、取引の機会を探します。適切なエントリーポイントを検出
FX Power: 通貨の強弱を分析して、より賢い取引を実現 概要 FX Power は主要通貨と金の実際の強弱をあらゆる市場状況で理解するための必須ツールです。強い通貨を買い、弱い通貨を売ることで、 FX Power は取引の意思決定を簡素化し、高い確率の取引機会を見出します。トレンドを追従する場合でも、極端なデルタ値を使用して反転を予測する場合でも、このツールはあなたの取引スタイルに完全に適応します。ただ取引するだけではなく、 FX Power で賢く取引をしましょう。 1. なぜ FX Power がトレーダーにとって非常に有益なのか 通貨と金のリアルタイム強弱分析 • FX Power は主要通貨と金の相対的な強弱を計算し、マーケットダイナミクスに関する明確な洞察を提供します。 • どの資産がリードしているか、または後れを取っているかを監視して、取引するペアを賢く選びましょう。 マルチタイムフレームの包括的なビュー • 短期、中期、長期のタイムフレームで通貨と金の強弱を追跡し、マーケットトレンドに基づいて取引戦略を調整できます。 • スキャルピングからスイングトレード
FX Volume
Daniel Stein
4.59 (34)
FX Volume:ブローカー視点で捉える本物の市場センチメント クイック概要 トレード手法をさらに高めたいとお考えですか? FX Volume は、リテールトレーダーやブローカーのポジション状況をリアルタイムで提供します。これは、COTのような遅延レポートよりもはるかに早く知ることができます。安定した利益を目指す方も、さらなる優位性を求める方も、 FX Volume は大きな不均衡を見極め、ブレイクアウトを確認し、リスク管理を洗練させるのに役立ちます。今すぐ始めて、実際の出来高データがどのように意思決定を変革するかを体感してください! 1. FX Volume がトレーダーにとって非常に有益な理由 高精度の早期警戒シグナル • 各通貨ペアを売買しているトレーダー数を、他者よりも早く、ほぼリアルタイムで把握できます。 • FX Volume は、複数のリテールブローカーから得られる本物の出来高データを収集し、分かりやすい形式で提供する 唯一 のツールです。 強力なリスク管理 • ロングやショートの大きな偏り(インバランス)を特定し、潜在的なトレンド転換を見逃しません。ストップ
!SPECIAL SALE!  An exclusive indicator that utilizes an innovative algorithm to swiftly and accurately determine the market trend. The indicator automatically calculates opening, closing, and profit levels, providing detailed trading statistics. With these features, you can choose the most appropriate trading instrument for the current market conditions. Additionally, you can easily integrate your own arrow indicators into Scalper Inside Pro to quickly evaluate their statistics and profitability
現在26%オフ 初心者やエキスパートトレーダーに最適なソリューション! このインジケーターは、独自の機能と新しい計算式を取り入れた、ユニークで高品質、かつ手頃な価格のトレーディングツールです。たった1枚のチャートで28の為替ペアの通貨強度を読み取ることができます。新しいトレンドやスキャルピングチャンスの引き金となるポイントを正確に特定することができるので、あなたのトレードがどのように改善されるか想像してみてください。 ユーザーマニュアルはこちら  https://www.mql5.com/en/blogs/post/697384 これが最初の1本、オリジナルだ! 価値のないクローンを買わないでください。 特別な サブウィンドウの矢印で強い通貨の勢いを表示 GAPがあなたのトレードを導く! 基準通貨や気配値が売られすぎ・買われすぎのゾーン(外相フィボナッチレベル)にあるとき、個別チャートのメインウィンドウに警告表示。 通貨がレンジの外側から反落した場合、プルバック/リバーサルのアラート。 クロスパターンの特別なアラート 複数の時間枠を選択可能で、トレンドを素早く確認できます
I just sell my products in mql5.com, any other websites are stolen old versions, So no any new updates or support. - Lifetime update free - Real price is 80$ - 40% Discount ( It is 49$ now ) Contact me for instruction, add group and any questions! Related Products:  Bitcoin Expert , Gold Expert - Non-repaint Introduction The breakout and retest strategy is traded support and resistance levels. it involves price breaking through a previous level.  The break and retest strategy is designed to h
Scalper Vault は、スキャルピングを成功させるために必要なすべてを提供するプロフェッショナルなスキャルピング システムです。このインジケーターは、外国為替およびバイナリー オプションのトレーダーが使用できる完全な取引システムです。推奨される時間枠は M5 です。 システムは、トレンドの方向に正確な矢印シグナルを提供します。また、トップとボトムのシグナルとギャン マーケット レベルも提供します。 インジケーターは、プッシュ通知を含むすべてのタイプのアラートを提供します。 インジケータの購入後にご連絡ください。私の個人的な取引の推奨事項と素晴らしいボーナス指標を無料で共有します! 幸せで有益な取引をお祈りします!
Dynamic Forex28 Navigator - 次世代の Forex 取引ツール。 現在 49% オフ。 Dynamic Forex28 Navigator は、長年人気のインジケーターを進化させたもので、3 つの機能を 1 つにまとめています。 Advanced Currency Strength28 インジケーター (レビュー 695 件)  + Advanced Currency IMPULSE with ALERT (レビュー 520 件) + CS28 コンボ シグナル (ボーナス)。 インジケーターの詳細 https://www.mql5.com/en/blogs/post/758844 次世代の Strength インジケーターが提供するもの  オリジナルで気に入っていたすべての機能が、新機能と精度の向上によって強化されました。 主な機能: 独自の通貨強度計算式。 すべての時間枠でスムーズかつ正確な強度ライン。 トレンドの特定と正確なエントリーに最適です。 ダイナミックマーケットフィボナッチレベル (マーケットフィボナッチ)。 このインジケーターに固有
Golden Trend Indicator
Noha Mohamed Fathy Younes Badr
4.9 (10)
Golden Trend indicator  is The best indicator for predicting trend movement this indicator never lags and never repaints and never back paints    and give  arrow buy and sell    before the candle appear  and it will help you and  will make your trading decisions clearer its work on all currencies and  gold and crypto and all time frame This unique  indicator uses very secret algorithms to catch the  trends, so you can trade using this indicator and see the trend clear on charts  manual guide and
TrendMaestro
Stefano Frisetti
5 (3)
note: this indicator is for METATRADER4, if you want the version for METATRADER5 this is the link:  https://www.mql5.com/it/market/product/108106 TRENDMAESTRO ver 2.4 TRENDMAESTRO recognizes a new TREND in the bud, he never makes mistakes. The certainty of identifying a new TREND is priceless. DESCRIPTION TRENDMAESTRO identifies a new TREND in the bud, this indicator examines the volatility, volumes and momentum to identify the moment in which there is an explosion of one or more of these data a
FX Levels: あらゆる市場における非常に高精度なサポート&レジスタンス 概要 通貨ペア、株式指数、個別銘柄やコモディティなど、どのような市場でも信頼できるサポートとレジスタンスを特定したいですか? FX Levels は伝統的な “Lighthouse” メソッドと先進的な動的アプローチを融合し、ほぼ汎用的な精度を実現します。ブローカーの実務経験を活かし、自動化されたデイリー更新とリアルタイム更新を組み合わせることで、 FX Levels は反転ポイントを見つけ、利益目標を設定し、自信をもってトレードを管理するための手助けをします。今すぐ試してみて、サポート/レジスタンス分析の正確性がどれほどトレードを向上させるかを実感してください! 1. FX Levels がトレーダーにとって非常に有用な理由 非常に正確なサポート&レジスタンスゾーン • FX Levels は異なるブローカー環境でもほぼ同一のゾーンを生成するよう設計されており、データフィードの差異や時刻設定のずれによる不一致を解消します。 • つまり、どのブローカーを利用していても一貫したレベルが得られるため、戦
Trend Screener
STE S.S.COMPANY
4.78 (91)
トレンドインジケーター、1つのツールに組み込まれたすべての重要なトレンド機能を備えたトレンドトレーディングとフィルタリングのための画期的なユニークなソリューション! これは、すべてのシンボル/商品(外国為替、商品、暗号通貨、インデックス、株式)で使用できる100%再描画されていないマルチタイムフレームおよびマルチ通貨インジケーターです。 期間限定オファー: サポートおよびレジスタンス スクリーナー インジケーターは、たった 50 ドルで永久的にご利用いただけます。(元の価格 250 ドル) (オファー延長) トレンドスクリーナーは、チャート内のドットで矢印トレンドシグナルを提供するインジケーターに続く効率的なインジケーターです。 トレンド分析インジケーターで使用できる機能: 1.トレンドスキャナー。 2.最大利益分析を備えたトレンドライン。 3.トレンド通貨強度メーター。 4.アラート付きのトレンド反転ドット。 5.アラート付きの強いトレンドドット。 6.トレンド矢印 毎日の分析例、毎日のシグナルパフォーマンス...など、トレンドスクリーナーインジケーターを使用して、ここで見つけること
TPSpro TREND PRO は 、市場を自動的に分析し、トレンドとその各変化に関する情報を提供し、再描画せずに取引に参加するためのシグナルを提供するトレンド指標です。 インディケータは各ローソク足を使用し、個別に分析します。さまざまなインパルス(アップまたはダウンインパルス)を指します。通貨、仮想通貨、金属、株、指数の取引への正確なエントリーポイント! バージョンMT5                   インジケーターの完全な説明   インジケーター -   RFI LEVELS と併用することをお勧めします。 主な機能: レンダリングなしで正確な入力信号! シグナルが表示された場合、それは関連性を維持します。これは、シグナルを提供してからそれを変更する可能性があり、入金時の資金の損失につながる可能性があるリドローインジケーターとの重要な違いです。より高い確率と精度で市場に参入できるようになりました。矢印が表示された後、ターゲットに達する (利益確定) か反転シグナルが表示されるまで、ローソク足を色付けする機能もあります。 STOP LOSS / TAKE PROFITゾー
指示する     ロシア     -        utilizar con   el indicador の ESP 推奨事項 -   TPSpro トレンド プロフェッショナル版 -   MT5のバージョン 最も重要なことは、将来においても最も重要なことです。 機能のプリンシパル: ゾーンのほとんどは、ベンダーとコンプラドールによってアクティブ化されます。 状況を直感的に把握できるよう、初期の衝動を修正します。 LOGIC AI: MUESTRA zonas (círculos) parabuscar puntos de entrada cuando se activa una plantilla 視覚的に優れた視覚効果があり、最も重要な機能がすべて揃っていることに注意してください。 優れたニベレス/ゾーンの視覚化 (modo MTF) 世界で最も人気のある場所/ゾーンです。これを使用するのに最適な方法です (   TPSproTREND PRO   )。 アルゴリズム プロフェッショナル セパラド パソ ア パソ パラ オペラ それは、オペラハウスやコントラ・デ・エラの指導におい
Gold Stuff
Vasiliy Strukov
4.86 (247)
Gold Stuff は、金専用に設計されたトレンド指標であり、あらゆる金融商品にも使用できます。 インジケーターは再描画せず、遅れません。 推奨時間枠 H1. それインディケータでフルオートExpert Advisor EA Gold Stuffが動作します。 あなたは私のプロフィールでそれを見つけることができます. 設定と個人的なボーナスを得るために、購入後すぐに私に連絡してください! トレンド スキャナーの強力なサポートを利用して、無料のインジケーターを入手し、プライバシーを守ります。あーみー!   設定 矢印を描く - オンオフ。 チャートに矢印を描く。 アラート - 可聴アラートのオンオフ。 メール通知 - オンオフ。 電子メール通知。 プチ通知 - オンオフ。 プッシュ通知。 次に、色域を調整します。 Gold Stuff は、金専用に設計されたトレンド指標であり、あらゆる金融商品にも使用できます。 インジケーターは再描画せず、遅れません。 推奨時間枠 H1. それインディケータでフルオートExpert Advisor EA Gold Stuffが動作します。
CONTACT US  after purchase to get a FREE Trading Manual & an Exclusive Trading Tips PDF! Try Now—Limited 50% Discount for First 100 Buyers! Download the  Metatrader 5 Version William Delbert Gann (W.D. Gann) was an exceptional market analyst, whose trading technique was based on a complex blend of mathematics, geometry, astrology, and ancient mathematics which proved to be extremely accurate. A Note from the Developer to all the Traders: Over 15+ years of my journey with WD Gann (William Delb
プレシジョン・インデックス・オシレーター(Pi-Osc)は、Precision Trading SystemsのRoger Medcalfによるものです。 バージョン2は、チャートにスーパーファストでロードされるように注意深く再コードされ、その他の技術的な改良も組み込まれて、エクスペリエンスを向上させています。 Pi-Oscは、市場が強制的に行かなければならない、すべての人のストップを取り除くためのポイントである、極限のエクソースト・ポイントを見つけるために設計された正確な取引タイミング信号を提供するために作成されました。 この製品は、極限のポイントがどこにあるかを知るという古代の問題を解決し、トレーダーの生活をはるかにシンプルにします。 これは、業界標準のオシレーターとは異なる強力な要素を持つ高度なコンセンサス・インジケーターです。 使用されている一部の機能には、需要指数、マネーフロー、RSI、スティリング、パターン認識、出来高分析、標準偏差の極値などがあり、異なる長さでこれらのバリエーションが多く含まれています。 初めて見ると、訓練されていない目には、他のオシレーター
Celebrate Vietnamese Tet 2025 with Special Offer : ALL TOOLS  only $35 ! ICTの 反転フェアバリューギャップ (IFVG) の概念を活用した Inversion Fair Value Gaps Indicator でその力を解放しましょう!この最新ツールは、フェアバリューギャップ (FVG) を次のレベルに引き上げ、反転したFVGゾーンを特定して表示します。これらは、価格修正後に形成される重要なサポートおよびレジスタンスエリアです。スキャルパー、スイングトレーダー、長期投資家のいずれであっても、IFVGインジケーターはリアルタイムでの意思決定にとって貴重な洞察を提供します。 MT5バージョンはこちら:   Inversion Fair Value Gaps MT5 他の製品はこちら:   すべての 製品 IFVGインジケーターとは? IFVGインジケーターは、ICTのフェアバリューギャップ (FVG) とその反転の概念に基づいています。FVGが修正され(価格がそのバイアスの反対方向でその境界を超えてクローズした
After your purchase, feel free to contact me for more details on how to receive a bonus indicator called VFI, which pairs perfectly with Easy Breakout for enhanced confluence!   Easy Breakout is a powerful price action trading system built on one of the most popular and widely trusted strategies among traders: the Breakout strategy ! This indicator delivers crystal-clear Buy and Sell signals based on breakouts from key support and resistance zones. Unlike typical breakout indicators, it levera
Celebrate Vietnamese Tet 2025 with Special Offer : ALL TOOLS  only $35 ! 用の画期的な RSI Kernel Optimized with Scanner をご紹介します。この最先端ツールは、強力なカーネル密度推定 (KDE) アルゴリズムを統合することで、従来の RSI 分析を再定義します。この高度なインジケーターは、リアルタイムでの市場トレンドのインサイトを提供するだけでなく、複数の通貨ペアや時間枠を同時にスキャンできるダッシュボードも備えています。このツールがトレードアーセナルに必須な理由をご紹介します。 See more MT5 version at:   RSI Kernel Optimized with Scanner for MT5 See more products at:   https://www.mql5.com/en/users/ndhsfy/seller See more information about the indicator at:   Enhancing RSI Analys
現在20%OFF! このダッシュボードは、複数のシンボルと最大9つのタイムフレームで動作するソフトウェアの非常に強力な部分です。 このソフトは、弊社のメインインジケーター(ベストレビュー:Advanced Supply Demand)をベースにしています。    Advanced Supply Demand ダッシュボードは、素晴らしい概要を提供します。それは示しています。  ゾーン強度評価を含むフィルタリングされた需給値。 ゾーン内/ゾーンへのPips距離。 ネストされたゾーンがハイライトされます。 選択されたシンボルの4種類のアラートを全ての(9)時間枠で提供します。 それはあなたの個人的なニーズに合わせて高度に設定可能です。 あなたの利益! すべてのトレーダーにとって最も重要な質問です。 市場に参入するのに最適なレベルはどこか? 成功のチャンスとリスク/リターンを得るために、強力な供給/需要ゾーン内またはその近くで取引を開始します。 損切りの最適な位置はどこですか? 最も安全なのは、強力な供給/需要ゾーンの下/上にストップを置くことです。 最適な利益
Bull versus Bear
Mohamed Hassan
4.47 (17)
Enjoy a   50% OFF   Christmas holiday sale!   Send us a message after your purchase to receive more information on how to get your  BONUS  for FREE  that works in great combination with Bull vs Bear ! Bull versus Bear is an easy-to-use Forex indicator that gives traders clear and accurate signals based on clear trend retests . Forget about lagging indicators or staring at charts for hours because  Bull vs Bear provides real-time entries with no lag and no repaint, so you can trade with confide
現在20%OFF! 初心者やエキスパートトレーダーに最適なソリューションです。 このインディケータは、エキゾチックペア・コモディティ・インデックス・先物など、あらゆるシンボルの通貨の強さを表示することに特化したインディケータです。金、銀、原油、DAX、US30、MXN、TRY、CNHなどの通貨の強さを表示するために、9行目にどのシンボルでも追加することができます。独自の機能を多数搭載し、新しい計算式を採用したため、ユニークで高品質、かつ手頃な価格のトレーディングツールとなっています。新しいトレンドやスキャルピングチャンスのトリガーポイントを正確に把握することができるため、あなたのトレードがどのように改善されるか想像してみてください。 ユーザーマニュアル:ここをクリック   https://www.mql5.com/en/blogs/post/708876 すべての時間枠に対応します。あなたはすぐにトレンドを見ることができるようになります! 新しいアルゴリズムに基づいて設計されているため、潜在的な取引の特定と確認がより簡単になります。これは、8つの主要通貨と1つのシンボルの強弱
!SPECIAL SALE! The Reversal Master is an indicator for determining the current direction of price movement and reversal points. The indicator will be useful for those who want to see the current market situation better. The indicator can be used as an add-on for ready-made trading systems, or as an independent tool, or to develop your own trading systems. The Reversal Master indicator, to determine the reversal points,  analyzes a lot of conditions since the combined analysis gives a more accura
現在31%オフ! 初心者やエキスパートトレーダーに最適なソリューション! このインジケータは、独自の機能と秘密の数式を組み込んだ、ユニークで高品質かつ手頃な価格のトレーディングツールです。たった1枚のチャートで28の通貨ペアのアラートを表示します。新しいトレンドやスキャルピングチャンスの引き金となるポイントを正確に把握することができるので、あなたのトレードがどのように改善されるか想像してみてください! 新しい基本的なアルゴリズムに基づいて構築されているため、潜在的な取引の特定と確認がより簡単になります。これは、通貨の強さや弱さが加速しているかどうかをグラフィカルに表示し、その加速のスピードを測定するためです。加速すると物事は明らかに速く進みますが、これはFX市場でも同じです。つまり、反対方向に加速している通貨をペアにすれば、利益を生む可能性のある取引を特定することができるのです。 通貨の勢いを示す縦の線と矢印は、あなたの取引の指針となるでしょう。 ダイナミックマーケットフィボナッチ23レベルはアラートトリガーとして使用され、市場の動きに適応します。もしインパルスが黄色のトリガ
The Grand Signal indicator is a unique tool that not only provides an understanding of market behavior but also precisely identifies trend entry points after intraday correction limits, with accuracy down to a five-minute candlestick! It includes individual settings for each currency pair. After purchasing, be sure to message me directly for instructions! Telegram: @Lapinsania or here in the Market! I
Matrix Arrow Indicator MT4
Juvenille Emperor Limited
5 (3)
マトリックスアローインジケーターMT4は、すべてのシンボル/商品(外国為替、商品、暗号通貨、インデックス、株式)で使用できる100%再描画されていないマルチタイムフレームインジケーターに続くユニークな10in1トレンドです。マトリックスアローインジケーターMT4は、初期段階で現在のトレンドを判断し、最大10の標準インジケーターから情報とデータを収集します。 平均方向移動指数(ADX) 商品チャネルインデックス(CCI) クラシック平研アシキャンドル 移動平均 移動平均収束発散(MACD) 相対活力指数(RVI) 相対力指数(RSI) 放物線SAR ストキャスティクス ウィリアムズのパーセント範囲 すべてのインジケーターが有効な買いまたは売りシグナルを与えると、対応する矢印がチャートに印刷され、次のろうそく/バーの開始時に強い上昇トレンド/下降トレンドを示します。ユーザーは、使用するインジケーターを選択し、各インジケーターのパラメーターを個別に調整できます。マトリックスアローインジケーターMT4は選択されたインディケーターからのみ情報を収集し、それらのデータのみに基づいてアローを印刷
Apollo BuySell Predictor は、いくつかの取引モジュールを含む専門的な取引システムです。独自のブレイクアウト ゾーン、フィボナッチ ベースのサポートとレジスタンス レベル、ピボット トレンド ライン、プルバック ボリューム シグナル、およびトレーダーが日常的に必要とするその他の便利な機能をトレーダーに提供します。システムはどのペアでも機能します。推奨される時間枠は M30、H1、H4 です。インジケーターは、H4 よりも高い時間枠を除いて、他の時間枠でも機能します。 このシステムは、トレーダーが取引を成功させるために必要なすべてを提供するため、普遍的です。システムは複数の方法で使用できます。デイトレード、スイングトレード、さらにはスキャルピングにも使用できます。どのような取引スタイルを好む場合でも、システムは市場を真の姿で見るのに役立ちます。すべての信号は再描画せず、ラグもありません! 取引の好みやタスクに応じて、システムのさまざまなモジュールのオン/オフを切り替えることができます。システムは、PUSH 通知を含むすべてのタイプのアラートを提供します。必要なアラー
Black dragon indicator
Ramil Minniakhmetov
4.85 (117)
トレンド検出インジケーターはあらゆる戦略を補完し、独立したツールとしても使用できます。 インジケーターの操作に関する推奨事項、コメント #8 でダウンロードできます 利点 使いやすく、不要な情報でチャートを過負荷にしません。 あらゆる戦略のフィルターとして使用できます。 利益を得るのとストップロスを設定するの両方に使用できる動的なサポートとレジスタンスのレベルが組み込まれています。 ローソク足が閉じた後、インジケーターの色は変わりません。  株式市場、指数、石油、金、およびすべての時間枠で機能します。 トースト通知、電子メール通知、プッシュ通知、サウンドアラートの機能があります。 私の他の開発はここで見つけることができます: https://www.mql5.com/ja/users/mechanic/seller 入力パラメータ Alert-オン/オフ。アラート; Push Notification-オン/オフ。プッシュ通知; Mail-オン/オフ電子メール通知; Fibo 1,2,3,4,5,6,7,11,21,31,41,51,61,71-動的サポートと抵抗レベルの設定。
The Smart Liquidity Profile is color-coded based on the importance of the traded activity at specific price levels, allowing traders to identify significant price levels such as support and resistance levels, supply and demand zones, liquidity gaps, consolidation zones, Buy-Side/Sell-Side Liquidity and so on.  Smart Liquidity Profile allows users to choose from a number of different time periods including 'Auto,' 'Fixed Range,' 'Swing High,' 'Swing Low,' 'Session,' 'Day,' 'Week,' 'Month,' 'Quar
作者のその他のプロダクト
Enigmera
Ivan Stefanov
5 (4)
エニグメラ:市場の中核 https://www.enigmera.com はじめに このインディケータと取引システムは、金融市場に対する驚くべきアプローチです。ENIGMERAは、フラクタルサイクルを使用して、サポートとレジスタンスレベルを正確に計算します。本格的な蓄積局面を示し、方向性と目標を示します。 トレンド中でも調整中でも機能するシステムです。 どのように作動するのか? ENIGMERAは、支持線・抵抗線、目標線、乖離線の3つのラインで構成されています。このシステムは、過去のデータを現在と未来に外挿する典型的な市場指標とは異なり、現在の完全な画像を提供します。支持線上にある場合、それは本当の支持を意味し、抵抗線上にある場合、それは本当の抵抗を意味する。ある水準が破られた場合、それはトレンドの変化を意味する。再描画はしない。 市場は常に進化しているため、ENIGMERAはその評価ツールを適応させ、定期的に戦略を修正しています。  これにより、すべてのシナリオが徹底的に評価されることが保証されます。この市場指標の独自性は、その能力を見れば明らかです。  ENIGMERAは
このインディケータは、選択した期間における強気と弱気の不均衡を測定し、2 点間の直線を示す。 強気派が弱気派より出来高が多ければ、線は緑色に変わる。 ベアの方が出来高が多い場合、線は赤になる。 線は、出来高の差のパーセンテージも示します。 このインジケーターは、同じデータを別ウィンドウで表示します。また、分割された出来高を見ることもできます。 このインジケーターには2つのモードがあります。 そのために、左上にボタンがあります、  - ボタンを押さなければ、市場の任意のポイントと現在の価格との間の不均衡を測定します。 - ボタンを押すと、市場の任意の2点間のバランスを測定できます。 このインディケータは、選択した期間における強気と弱気の不均衡を測定し、2 点間の直線を示す。 強気派が弱気派より出来高が多ければ、線は緑色に変わる。 ベアの方が出来高が多い場合、線は赤になる。 線は、出来高の差のパーセンテージも示します。 このインジケーターは、同じデータを別ウィンドウで表示します。また、分割された出来高を見ることもできます。 このインジケーターには2つのモードがあります
SENSEは、厳選されたGANN手法とフラクタル計算を組み合わせた自動システムです。このシステムは、どこで取引を開始し、どこで決済するかを教えてくれます。もう複雑な計算に時間を費やす必要はありません。インジケータをインストールするだけです。 基本原則: 価格が白い線の上にある時、市場は強気である。 白い線の上で買い、下で止める 緑線は上値目標 白い線より下にあるときは弱気。 白い線より下で売り、上で止める。 赤線は下値目標 緑または赤の線が二重になっている場合は、強いエリアであることを示す。 なぜSENSEなのか? 利益目標 SENSEは自動的に利益確定のターゲットを設定し、取引の成功を最大化するお手伝いをします。 自動適応: このインディケータは、どのような時間枠に対しても自動的に再計算を行い、手動で調整する必要なく、正確で信頼性の高いシグナルを提供します。 スキャルピングにも最適です。 デモをチェック
TRANSACTION SPEEDは、大口注文がいつどこで市場に集積され、その恩恵を受けているかを示す最高品質の指標です。トレンドの変化を非常に早い段階で検知します。インジケーターであると同時にトレーディングシステムでもあります。そのコンセプトはユニークで、驚くほど収益性が高い。 FXでは、ティックボリュームはボリュームと呼ばれ、誤解を招きやすい。実際は、単位時間当たりの価格変動であり、事実上、取引速度(TRANSACTION SPEED)です。 このインジケーターは、FXにおける出来高の概念を完全に見直し、正しい方法で論理的に定義し、このロジックを適用することで、ユニークで正確なトップレベルの収益ツールになります。 スピードが上がれば、それはより大きな関心とそれに対応するエントリーとエグジットのサインです。 使い方は? このインジケーターは、市場の取引スピードを測定・比較するため、まず最初に行うべきことは以下の通りです。 比較を行う期間を選択することです。 通常、15日前が比較の出発点となります。 インジケータに日付を入力して実行する。 30分または1時間のタイムフレームで、
この指標は実際の経験に基づいている。 トップ/ボトムの日付/時刻を入れてください。 トップ/ボトムから現在までの最も訪問されたレベルを計算します。 ローソク足が更新されるたびに自動的に更新されます。 異なるトレンドと時間枠の複数のインディケータを同時に使用することができます。 長さは常にあなたの期間の開始から現在にプロットされます。 便利なPROツール。 この指標は実際の経験に基づいている。 トップ/ボトムの日付/時刻を入れてください。 トップ/ボトムから現在までの最も訪問されたレベルを計算します。 ローソク足が更新されるたびに自動的に更新されます。 異なるトレンドと時間枠の複数のインディケータを同時に使用することができます。 長さは常にあなたの期間の開始から現在にプロットされます。 便利なPROツール。
FREE
Levelss
Ivan Stefanov
5 (1)
LEVELSSインディケータが示す: - 日足の強気ゾーンと弱気ゾーン。毎日00:00から23:59まで表示。 - 週足の強気・弱気ゾーン。毎週月曜日0:00から金曜日23:59まで表示されます。 - 特定のタイムフレームから特別に計算されたチャネルで、他のすべてのタイムフレームに表示されます。デフォルトでは、これは4時間のタイムフレームで、取引したい他のタイムフレームに変更することができます。これはノンストップで計算されます。 画面の左上には、ゾーンとチャネルが強気、弱気、中立のいずれであるかが表示されています。この3つすべてが強気の場合、現在のローソク足に緑の点が表示されます。3つとも弱気の場合、ピンクの点が表示されます。 このインディケータに制限はありません。
2 SNAKES  is a first class scalping system. As the entries are quite precise, you are likely to become addicted to this system very quickly.  You have 2 snakes. When you see a candle above or below them that does not touch them - that is your scalping signal. Then buy or sell at the green line or close. If you use a larger time frame, scalping can become trend following. The snakes are calculated precisely in relation to the current state of the market. They ARE NOT moving averages.  You decide
GANNの正確な目標は、彼の時代を超えた方法に基づいて計算され、目の前に提示されます。このツールは、取引をよりスムーズで直感的にするために設計されています。白いラインを上に、または緑のラインを下に動かすことで、なぜGANNの技法が取引の世界で今なお影響力を持っているのかがすぐにわかるでしょう。 GANNの戦略は、市場の動きを高精度で予測することに焦点を当てており、このツールはその力をあなたの手元に提供します。経験豊富なトレーダーであっても、初心者であっても、ラインを操作することで、彼の手法がなぜ時の試練に耐えてきたのかを深く理解することができるでしょう。 GANNの正確な目標は、彼の時代を超えた方法に基づいて計算され、目の前に提示されます。このツールは、取引をよりスムーズで直感的にするために設計されています。白いラインを上に、または緑のラインを下に動かすことで、なぜGANNの技法が取引の世界で今なお影響力を持っているのかがすぐにわかるでしょう。 GANNの戦略は、市場の動きを高精度で予測することに焦点を当てており、このツールはその力をあなたの手元に提供します。経験豊富なトレーダーであっ
このインディケータは、外為市場のティックボリュームを強気と弱気に効果 的に分けます。  さらに、選択した任意の期間の強気と弱気のティックボリュームの合計を計算し、表示する機能を提供します。  チャート上の2本の青い線を動かすことで簡単に期間を調整でき、お客様の取引ニーズに合わせたカスタマイズ可能で正確な出来高分析が可能です。  もしお役に立つようでしたら、レビューをお寄せください!  それでは、良いお取引を! このインディケータは、外為市場のティックボリュームを強気と弱気に効果 的に分けます。 さらに、選択した任意の期間の強気と弱気のティックボリュームの合計を計算し、表示する機能を提供します。 チャート上の2本の青い線を動かすことで簡単に期間を調整でき、お客様の取引ニーズに合わせたカスタマイズ可能で正確な出来高分析が可能です。 もしお役に立つようでしたら、レビューをお寄せください! それでは、良いお取引を!
FREE
トレーディングの世界では、45度の角度をたどるトレンドは持続可能であると考えられている。 しかし、この重要な角度を正確に測定することは、明確な方法が記載されていないため、依然として難しい。トレーダーは、この角度の計算方法、ローソク足の本数、適切なチャートのズームを推測するしかありません。 私たちはこの問題を解決し、すべての条件を論理的に定義しました。これは、サポート、ターゲット、全体的な動きなど、様々な市場要因の複雑な分析に基づいて45度のトレンドラインを視覚化するツールです。 45度線はトレードの神話や伝承とみなされがちですが、トレンド・アングル45は今や私たちのトレードの武器であり、機能する貴重なツールです。トレンドのニュアンスを反映し、トレンドの始まりと終わりの変化を予測するその能力は  トレンドの始まりと終わりの変化を予測する能力は、評価に理想的です。 まさに魔法のような時間です! さまざまな市場トレンドの深く正確な分析に直面することになります。 市場サイクルの間、価格は45度線の上下に動くことがあり、サイクルの異なる段階を示します。 トレンドの始まりでは、価格はライン
これはMetaTrader用のRolling VWAPインジケーターです。特定の数のキャンドルに基づいてティックボリュームで加重された平均価格(VWAP)を計算し、市場分析をより深く行うためのオプションの標準偏差バンドを持っています。このインジケーターは再描画されず、アンカーされません。 インジケーター概要 Rolling VWAPの計算 : 主要なライン(アクア色)は、特定の数のバー( barsToCalculate )のVWAPを計算します。このVWAPは、各バーのティックボリュームを考慮して調整され、典型的な価格に適切に重みを付けます。 偏差バンド : このインジケーターには、上部(ライム色)と下部(赤色)の標準偏差バンドを表す追加の2つのラインが含まれています。これらのバンドは、ユーザー定義の偏差乗数( DEV1 )に基づいて計算され、VWAPの周囲に視覚的な境界を提供します。 DEV1 のデフォルト設定は3.0で、これはバンドがVWAPラインから三つの標準偏差の距離にあることを意味し、必要に応じて調整することができます。 ユーザー入力 : DEV1 : 標準偏差バンドの乗数。
The indicator displays support and resistance zones defined logically using the MACD. The entire concept is explained in the video, with specific examples shown. The indicator works on any instruments and timeframes. It does not repaint. After placing it on the chart, please go through all the timeframes sequentially, from monthly to 1-minute, so that all lines load correctly. After that, you can start using it. The concept is unique and has not been seen in other systems or indicators.
Versussは特別なツールです。インジケーターは、あなたの分析に新しいツールを作成することができます。プラットフォーム上で任意の2つのインストルメントを比較することが可能です。 例1   もしあなたがUSDJPYを取引している場合、分析にはSP500やNIKKEI225も含めることができます。   Versussを使えば、1つの指数が他の指数と比較してどのように動くかを確認し、それをUSDJPYペアと比較することができます。 為替市場が指数の動きに追随している場合、次に何が起こるかを明確に予測し、事前に決定を下すことができます。 同じアプローチを他の為替ペアにも適用し、対応する指数を使って比較することができます。 例2   あなたの取引ポートフォリオに似たインストルメントが含まれている場合、それらを比較することができます。この方法で、どのインストルメントが上昇トレンドにあり、どれが下降トレンドにあるかを確認できます。 ADIDAS / NIKE   GOOGLE / MICROSOFT   金 / 銀 例3   為替クロスの比較:   AUDNZD / EURGBP  
FREE
The FIFTY indicator now comes in an automated version, removing the need for manual level drawing. This version automatically plots daily, weekly, and monthly levels on the chart, ensuring accuracy and saving time. Additionally, buttons are provided for toggling the visibility of these levels, offering full customization. For those who prefer, the free version of the indicator remains available and fully functional, allowing users to choose between manual and automated tools based on their tradi
フィルタ:
レビューなし
レビューに返信