• 概要
  • レビュー (6)
  • コメント (8)
  • 最新情報

Suleiman Levels

5

重要な注意:スクリーンショットに表示されている画像は、私の2つのインジケーター、「スレイマンレベル」インジケーターと「RSI Trend V」インジケーターです。
「RSI Trend V1」インジケーターと併用することを推奨しました。特に、カラードクラウドの確認と一致、および矢印のシグナルに加えて、フィボナッチインジケーターとその優れたレベルも重要です。
https://www.mql5.com/en/market/product/132080

「スレイマンレベル」インジケーターは、高度なオールインワンのプロフェッショナル分析ツールです。約9,800行のコードを備えたこのインジケーターは、革新性、精度、シンプルさを組み合わせて、チャートをこれまで以上に明確にします。これは単なるインジケーターではありません。

「スレイマンレベル」を際立たせる強力な機能:

  1. 黄色のボックス(資金流の検出):特定のろうそく足における銀行や機関からの資金流入を検出します。これらのボックスは、このインジケーター独自の重要な資金活動を表します。

  2. チャート上のカラーレベル – 比類のない精度:再描画されない独自のカラーレベルシステム。

  3. ダイナミックなサイドトレンドライン:ろうそく足の芯または実体を使用してトレンドを自動的に検出します。チャート分析の好みに合わせて完全にカスタマイズ可能。

  4. ダイナミックなサポートラインとレジスタンスライン:価格の動きに適応するインテリジェントなライン…ろうそく足の実体または芯を簡単に切り替えられます。

  5. 太いカラーのサポートラインとレジスタンスライン:主要なゾーンに非常に効果的です。

  6. RSIの敏感なレベルを示す四角形:RSIゾーンの重要な領域を強調し、明確さを増します。

  7. エンベロープと反転ろうそく足パターン:完全にカスタマイズ可能なエンベロープろうそく足で、重要な反転シグナルを特定します。

  8. 高度なクラウドシステム:チャートのポジティブまたはネガティブな状況を迅速に評価し、意思決定を迅速化します。

完全な柔軟性:ほとんどの要素の色、幅、可視性、設定を簡単に変更できます。
テストを繰り返し、以下の実際の画像を確認し、ビデオを見て、分析と取引の方法をどのように簡素化するかを確認してください。通貨ペアのチャート上の価格変動を継続的に監視し、レベルラインがどのように形成されるか、価格が実際にそれらとどのように相互作用するか(反発するか、突破するか、またはその周辺で推移するか)を、インジケーターが提供する他の多くの要素とともに観察します。

注:インジケーターのデフォルト設定が必ずしも最良とは限りません。すべての設定は、あなたの経験に基づいて完全にカスタマイズ可能です。個人的には、デフォルトとは異なる設定を使用しており、自分のチャート分析の好みに合わせて調整しています。

説明を注意深く読み、このインジケーターがチャートを分析し、理解し、研究するために設計されていることを理解してください。取引を開始するかどうかの決定は、完全にあなた自身に委ねられています。

皆さんの成功と利益のある取引を願っています。


レビュー 6
purcemputpcp
57
purcemputpcp 2025.03.18 05:21 
 

Good indicator with helpful support 👍

Zone William
51
Zone William 2025.02.24 09:08 
 

I am completely satisfied with this indicator; there is effort and solid underlying content behind it. I am also satisfied with the creator; he is helpful.

David T
303
David T 2024.12.23 06:22 
 

After only 1 day of testing and now seeing this during live market conditions I can already see that this performs as intended . The Engulfing signals do align with the trend and multi time frame confluence is suggested to go with the higher TF...can be used for scalping as well . Seller was every responsive and welcomed my suggestion for an update...looking forward to that if it can be implemented due to the already complexity of the original code. Even though I am 99% on MT4 this indicator made me use my MT5 terminal more and more as I see the potential in this indicator. Got the full version at a great price. Highly recommended

おすすめのプロダクト
Control Trading Support And Resistance Es un indicador independiente del TimeFrame que permite proyectar niveles más relevantes del mercado en función del plazo de tiempo de la operativa. Los colores del indicador están escogidos para diferenciar entre los diferentes tipos de niveles y destacar a los más relevantes. Este indicador permite visualizar en un mismo gráfico los posibles objetivos relevantes que los diferentes traders pueden emplear siguiendo diferentes tipos de operativas en funció
CandleBot
Mithlesh Kumar Mandal
キャンドルボットのご紹介 - ローソク足パターンを認識しトレードするための究極の無料ツール!キャンドルボットを使用して、簡単に高値と低値の両方に認識できる牛さんと熊さんのエングルフィング、モーニングスター、イブニングスター、そしてハンマーシグナルを活かし、市場で優位性を得ましょう。特定の期間にわたる始値、高値、安値、終値から導き出されたローソク足パターンは、価格動向の視覚的な表現となり、トレーダーが市場センチメントを分析し、潜在的な逆転や継続を予測するのに役立ちます。 ローソク足パターンの理解: エングルフィングパターン: 二つのローソク足から成り立ち、二つ目のローソクが完全に最初のものを覆います。ベアッシュエングルフィングは下降トレンドの終わりにおいて上昇トレンドの反転の可能性を示し、ブルッシュエングルフィングは上昇トレンドの終わりにおいて下降トレンドの反転の可能性を示唆します。エングルフィングキャンドルの本体が大きいほど、そのシグナルは強力です。 ハンマーパターン: 一本のローソク足で、本体が上部近くに小さく、下部に長い尾を持つハンマーのような形です。ブルッシュハンマーは下降トレン
FREE
This indicator is stand alone version from  MP Pivot Levels  (All in one) containing Woodie Pivots. Woodie’s pivot points are made up of multiple key levels, calculated from past price points, in order to frame trades in a simplistic manner. The key levels include the ‘pivot’ itself, and multiple support and resistance levels (usually up to three each). Traders use these levels as a guide for future price movements when setting up trades. The pivot : (Previous high + previous low + 2 x previous
FREE
The   Pivot Point indicator   automatically calculates and displays the pivot point line and support and resistance levels. Pivot can be calculated according to the Classic, Floor, Fibonacci, Woodie, Camarilla or DeMark formula. It is also possible to select the period for calculating the indicator. A trader can choose from daily, weekly, monthly, or user-defined periods. Types of pivots Classic Floor Fibonacci Woodie Camarilla DeMark Main features The indicator shows the current and historic
FREE
Simple Indicator that shows the Buy and Sell volume in percent. Settings: Font size for percentage labels Horizontal offset from right edge (pixels) Vertical offset for Signal label from bottom (pixels) Vertical offset for Buy label from bottom (pixels) Vertical offset for Sell label from bottom (pixels) Color for Buy label Color for Sell label Color for Strong Buy signal Color for Buy signal Color for Strong Sell signal Color for Sell signal Color for Neutral signal Default to every tick
FREE
Big Figure Indicator MT5
Vonjinirina Alfred Randrianiaina
4.33 (3)
「BIG FIGURE INDICATOR」は、価格チャート上で整数や半分の数字(たとえば、通貨取引での1.0000や1.5000など)など特定のレベルで自動的に水平線を識別して描画します。これらのレベルは心理的に重要であると考えられており、大口トレーダーや投資家が注目する可能性がある丸められた数字を表しており、潜在的なサポートまたはレジスタンスレベルにつながります。ビッグフィギュアインジケーターは、トレーダーが重要な価格レベルを特定し、これらのレベルに基づいて取引決定を行うのに役立ちます。 ラインはM1からH8のタイムフレームチャートにのみ表示されます。 ラインの色は入力パラメータタブで変更できます。 すべての通貨ペアで使用できます。 MT4バージョン: https://www.mql5.com/fr/market/product/96747 注意:当社のインジケーターを最適に機能させるには、まずデイリー(D1)タイムフレームを読み込む必要があります
FREE
Free automatic Fibonacci is an indicator that automatically plots a Fibonacci retracement based on the number of bars you select on the BarsToScan setting in the indicator. The Fibonacci is automatically updated in real time as new highest and lowest values appears amongst the selected bars. You can select which level values to be displayed in the indicator settings. You can also select the color of the levels thus enabling the trader to be able to attach the indicator several times with differe
FREE
This Pivot Points Indicator can be switched between the following well-known types: Standard/Classic (7 levels)  Woodie (5 levels)  Fibonacci (7 levels)  DeMark (3 levels) Pivot Points are calculated based on the previous day's values - according to the most common formulas on the web - and serve as an important tool for many traders, especially in day trading. They indicate possible resistance and support where increased buyer and seller interest can be expected. A common trading approach, for
Pivot Points are used by Forex traders to find support and resistance levels based on the previous day's price action. There are various ways to calculate pivot points, including averaging the open, high, low, and close of the previous day's chart price. Forex Traders use a combination of pivot points with moving averages to find trading opportunities in the currency markets. Pivot points are very useful tools that use the previous bars' highs, lows and closings to project support and resist
FREE
Horizontal Level indicator - reflects, using a histogram, the horizontal volumes of transactions at a certain price without reference to time. At the same time, the histogram appears directly in the terminal window, and each column of the volume is easily correlated with the quote value of the currency pair. The volume of transactions is of great importance in exchange trading, usually an increase in the number of concluded contracts confirms the trend, and their reduction indicates an imminent
Camarilla Swing Trade Indicator is an Indicator. Support and resistance points are calculated from the High Low Close of the previous TF Week's price. What are Camarilla Pivot Points? 1.Camarilla Pivot Points is a modified version of the classic Pivot Point. 2.Camarilla Pivot Points was launched in 1989 by Nick Scott, a successful bond trader. 3.The basic idea behind Camarilla Pivot Points is that price tends to revert to its mean until it doesn't. 4.Camarilla Pivot Points is a mathematical pr
FREE
トレンドキャッチャー: アラートインジケーター付きのトレンドキャッチャーストラテジーは、市場トレンドやポテンシャルなエントリーポイントやエグジットポイントを特定するのに役立つ多目的な技術分析ツールです。動的なトレンドキャッチャーストラテジーを備えており、市場状況に適応してトレンドの方向を明確に視覚化します。トレーダーは、自身の好みやリスク許容度に合わせてパラメーターをカスタマイズできます。このインジケーターはトレンドの識別を支援し、ポテンシャルなリバーサルをシグナルし、トレイリングストップのメカニズムとして機能し、市場への迅速な対応のためのリアルタイムアラートを提供します。 特徴: - トレンドの識別:上昇トレンドと下降トレンドをシグナルします。 - トレンドのリバーサル:ローソク足の色が上昇から下降に変わった場合やその逆の場合に、ポテンシャルなリバーサルを警告します。 - リアルタイムアラート:新しいトレンドの識別に対するアラートを生成します。 推奨事項: - 通貨ペア:EURUSD、AUDUSD、XAUUSDなど... - タイムフレーム:H1。 - アカウントタイプ:
FREE
特徴 価格別の取引量を確認するためのインジケーターです。 主にEURUSDに適用され、他の通貨ペアでは機能しないか、計算に時間がかかる可能性があります。 スムーズな使用のために、「チャートの右端からチャート境界をシフトする」オプションをオンにします(スクリーンショットに表示されています)。 新しいバーが表示されると、データがリセットされます。 変数 COlOR: インジケーターの色の設定 WIDTH: インジケーターの幅の設定 PERIOD: データを計算するための期間の設定 ---------------------------------------------------------------------------------------------------------------------------------------------------------------------------
FREE
Auto Fib Retracements
Ross Adam Langlands Nelson
4.2 (5)
Automatic Fibonacci Retracement Line Indicator. This indicator takes the current trend and if possible draws Fibonacci retracement lines from the swing until the current price. The Fibonacci levels used are: 0%, 23.6%, 38.2%, 50%, 61.8%, 76.4%, 100%. This indicator works for all charts over all timeframes. The Fibonacci levels are also recorded in buffers for use by other trading bots. Any comments, concerns or additional feature requirements are welcome and will be addressed promptly. 
FREE
機能 フィボナッチ・リトレースメント・トレーディングのためのインジケータ 1時間、4時間、1日、1週間の前のバーから選択されたバーに基づいてフィボナッチ・チャートが描かれます。 市場価格がフィボナッチ・レベルに触れると、色が変わり、タッチした時間が表示されます。 フィボナッチ・グラフは、-23.6、0、23.6、38.2、50、61.8、76.4、100、123.6のレベルに描かれ、バーが更新されるとチャートがリフレッシュされます。 変数 タイムフレーム:1時間、4時間、1日、1週間から選択されたタイムフレームでフィボナッチ・チャートが描かれます。 FiboWidth:レベルの太さを決定します。 FiboStyle:ピボット・レベルのスタイルを設定します。 TouchedColor:タッチしたときに変わる色です。 エラーがある場合や改善点がある場合はコメントしてください。 評価は開発者にとって大きな助けになります。満足していただける場合は5つ星をお願いいたします。
FREE
Online Accounts Manager MT5
Kyra Nickaline Watson-gordon
5 (1)
OneClick Online Account Manager is a powerful utility that helps you to manage all your accounts from a centralized panel. It is suitable for all single account traders and specially for multiple accounts traders. The utility help you to : Monitor status of all accounts on a private web page. Some information such as account connection status, account profit, DD, Balance, Equity, Margin Level, Number of positions and orders, Daily and Weekly profit/loss and also overall summation of all these p
Supercharge Your MetaTrader Analysis and Trading with Meta Sync Tools! Struggling to analyze price action across different timeframes? Meta Sync Tools eliminates the frustration of unsynced crosshairs and charts, allowing seamless multi-timeframe analysis. Missing key correlations between assets and constantly switching between charts? Meta Sync Tools empowers you to visualize relationships between instruments effortlessly.  Tired of wasting time on repetitive tasks? With 30+ Customizable Short
The indicator draws actual Fibonacci levels for your trading activity. The levels are redrawn every time after the price touches the low (0%) or the 100% fibonacci level. In the parameters, select the trading activity: Long term investor Medium term investor Medium-term investor active Short term investor Short-term investor active Speculator Speculator active Scalper Scalper active Try this indicator in action, and you will no longer have to look for coordinates for drawing fibonacci levels.
FREE
Volume Trade Levels
Mahmoud Sabry Mohamed Youssef
The idea behind this indicator is very simple , First it contains 2 mechanisms to place your trades: 1- Enter the Pips you want to duplicate to price levels. 2- Automatically let the indicator specify the largest Buy / Sell Volume Candle and place duplicated levels based on the candle itself. How it works: 1- Enter the Pips you want to duplicate to price levels:    1- once the indicator is loaded you will need first to Specify the number of pips in the indicator Configuration window ,you can g
Stop Loss with Profit Free Version*. Complete Version here. This utility / expert for MetaTrader 5 modifies the stop loss of all your operations dynamically and automatically to ensure the minimum benefits you want, and be able to operate with or without Take Profit. Maximize your benefits, by being able to trade with Unlimited Take Profit. You will ensure the number of minimum points you want to earn in each operation and the stop loss will be adjusted as long as the benefit of the operatio
FREE
AliPivot Points is a Meta Trader 5 Indicator that draws you the latest pivot points. You can choose from timeframes ranging from 1 Minute to 1 Month. Calculation methods for pivot points includes: Classic Pivot Points Camarilla Pivot Points Fibonacci Pivot Points Woodie Pivot Points You can personalize the line colors, style, and width to suit your preference. The indicator displays values on the right side of the chart. AliPivot Points values can also be utilized by developers for creating Expe
FREE
The Easy Trend Trading Indicator delivers quick and accurate BUY/SELL signals, ensuring that traders can make timely decisions. It works flawlessly across various timeframes and supports all symbols, making it a versatile tool for any market. Whether you're trading short-term or long-term, this indicator adapts to your needs with ease. Quick Setup: Simply "Enable" the indicator via input settings With a low memory footprint, the indicator is designed for efficiency, ensuring smooth performance e
概要 外国為替や金融市場では、迅速な反応と正確な意思決定が非常に重要です。しかし、標準のMetaTrader 5端末は最小でも1分のチャートしかサポートしておらず、トレーダーが市場の変動に敏感であることを制限しています。この問題を解決するために、 秒単位チャートキャンドルインジケーター を導入しました。このインジケーターを使用すれば、1秒から30秒の市場の動向をサブチャートで簡単に表示・分析できます。 主な機能 複数の秒単位タイムフレームのサポート :このインジケーターは、以下のタイムフレームを選択でき、さまざまな取引戦略に対応します: S1 : 1秒 S2 : 2秒 S3 : 3秒 S4 : 4秒 S5 : 5秒 S10 : 10秒 S15 : 15秒 S20 : 20秒 S30 : 30秒 リアルタイム更新 :秒単位チャートはリアルタイムで更新され、各瞬間に最新の市場情報を提供します。これにより、迅速な取引判断が可能になります。 ユーザーフレンドリーなインターフェース :インジケーターはサブチャートに表示され、直感的で使いやすいです。異なるタイムフレームに素早く切り替えて市場を迅速
TransitTrendlines
Bonginkosi Innocent Khumalo
TransitTrendlines this is a automatically trendline drawer, it draw both horizontal and diagonal trendlines. The horizontal trendlines are the pivot points of the day timeframe and the diagonal trendlines are based on the current time frames. You can adjust the diagonal trendlines by increasing the number of bars to draw the diagonal trendline and can also adjust the steepness. Note that the Horizontal trendlines are based on the day pivot points not currant time frame. Join mql5 transitbk98 cha
FREE
An indicator of pattern #54 ("Dead cat bounce") from Encyclopedia of Chart Patterns by Thomas N. Bulkowski. Parameters: Alerts - show alert when an arrow appears   Push - send a push notification when an arrow appears (requires configuration in the terminal) PeriodBars - indicator period ArrowType - a symbol from 1 to 17 ArrowVShift - vertical shift of arrows in pixels. Note. Arrows appear on a forming bar and do not disappear.   It cannot be guaranteed that the indicator recognizes the patter
Fibonacci automatically draws Fibonacci retracement, Because Fibonacci automatically draws Fibonacci retracement, you can know at a glance the price to buy at a push or sell back. Therefore, you can trade in favorable conditions in a trending market. We are live-streaming the actual operation of the system. Please check for yourself if it is usable. Please check it out for yourself. https://www.youtube.com/@ganesha_forex We do not guarantee your investment results. Investments should be made
The utility draws pivot levels for the selected timefram in classic method. Pivot = (high + close + low) / 3 R1 = ( 2 * Pivot) - low S1 = ( 2 * Pivot) - high R2 = Pivot + ( high - low ) R3 = high + ( 2 * (Pivot - low)) S2 = Pivot - (high - low) S3 = low - ( 2 * (high - Pivot)) you can change the timeframe, colors and fontsize. also you can change the text for the levels. Have fun and give feedback...
FREE
How the day starts
Sergio Antoni Escudero Tirado
This indicator draws the high intraday price and the low intraday price of the first n minutes of the day. The chart shows the days with vertical lines and two horizontal lines to indicate the max and the min close price of the n first minutes of the day. The max/min lines start and end with the day calculated. With this indicator you can see how starts the day compared with the previous days. It is valid for any market inasmuch as the start time is calculated with the data received. Parameter
FREE
TS Time Remaining
Aurelio Manuel Peral Garcia
TS Time Remaining - Indicador de Cuenta Regresiva para Velas en MetaTrader 5 El TS Time Remaining es un indicador gratuito diseñado para la plataforma MetaTrader 5 que permite a los traders visualizar en tiempo real el tiempo restante de la vela actual. Esta herramienta es especialmente útil para aquellos operadores que trabajan con estrategias basadas en la acción del precio y patrones de velas japonesas, ya que les permite anticiparse al cierre de la vela y tomar decisiones con mayor precisión
FREE
Pivot Points Levels Description The Pivot Points Levels indicator is an advanced and comprehensive tool for technical analysis based on support and resistance levels calculated from pivot points. This free indicator combines 6 different calculation methods with support for multiple timeframes, offering a robust solution for identifying key price reversal and continuation areas. Key Features 6 Calculation Methods : Traditional, Fibonacci, Woodie, Classic, DeMark (DM), and Camarilla Multi-Timefram
FREE
このプロダクトを購入した人は以下も購入しています
このインジケーターを購入された方には、以下の特典を 無料 で提供しています: 各トレードを自動で管理し、ストップロスとテイクプロフィットを設定し、戦略ルールに基づいてポジションを決済する補助ツール 「Bomber Utility」 様々な銘柄に合わせたインジケーターの設定ファイル(セットファイル) 「最小リスク」、「バランスリスク」、「待機戦略」 の3つのモードで使用できる Bomber Utility 用の設定ファイル このトレーディング戦略をすぐに導入・設定・開始できる ステップバイステップのビデオマニュアル ご注意: 上記の特典を受け取るには、MQL5のプライベートメッセージシステムを通じて販売者にご連絡ください。 オリジナルのカスタムインジケーター 「Divergence Bomber(ダイバージェンス・ボンバー)」 をご紹介します。これは、MACDのダイバージェンス(乖離)戦略に基づいた 「オールインワン」型のトレーディングシステム です。 このテクニカルインジケーターの主な目的は、価格とMACDインジケーターの間に発生するダイバージェンスを検出 し、将来の価格の動きを示す
PUMPING STATION – あなた専用の「オールインワン」戦略 PUMPING STATIONは、あなたのトレードをより楽しく、そして効果的に変えてくれる革新的なFXインジケーターです。ただの補助ツールではなく、強力なアルゴリズムを備えた本格的なトレーディングシステムで、より安定したトレードのスタートをサポートします。 この商品をご購入いただくと、以下の特典を無料でお付けします: 専用セットファイル:自動設定による最大パフォーマンスを実現。 ステップバイステップのビデオマニュアル:PUMPING STATION戦略の使い方を学べます。 Pumping Utility:PUMPING STATION専用の半自動トレードボットで、より快適かつシンプルな運用を可能にします。 ※ご購入後すぐにご連絡ください。追加リソースへのアクセスを提供いたします。 PUMPING STATIONの仕組み: トレンド管理:市場のトレンド方向を即座に判断。トレンドはあなたの最高の味方です。 エントリーサイン:チャート上の矢印で、取引のタイミングと方向を明確に示します。 明確な目標設定:インジケーターが自
Golden Trend Indicator MT5
Noha Mohamed Fathy Younes Badr
4.89 (18)
Golden Trend indicator  is The best indicator for predicting trend movement this indicator never lags and never repaints and never back paints    and give  arrow buy and sell    before the candle appear  and it will help you and  will make your trading decisions clearer its work on all currencies and  gold and crypto and all time frame This unique  indicator uses very secret algorithms to catch the  trends, so you can trade using this indicator and see the trend clear on charts  manual guide and
VERSION MT4        —        ИНСТРУКЦИЯ RUS           —        INSTRUCTIONS  ENG 主な機能: レンダリングなしで正確な入力信号! シグナルが表示されると、それは関連性を維持します。これは、シグナルを提供してからそれを変更し、その結果、入金された資金が失われる可能性があるリドローインジケーターとの重要な違いです。より高い確率と精度で市場に参入できるようになりました。矢印が表示された後、ターゲットに到達する (利益確定) か反転シグナルが表示されるまで、ローソク足に色を付ける機能もあります。 STOP-LOSS/TAKE-PROFITゾーンの表示 エントリーポイントを検索する際の視覚的な明瞭さを改善するために、最適な市場エントリーポイントが検索される購入/販売ゾーンを最初に表示するモジュールが作成されました。ストップロスレベルを操作するための追加のインテリジェントロジックは、時間の経過とともにそのサイズを縮小するのに役立ち、それによって取引に参加するときの初期リスクを軽減します(Move SL)。 より高いタイ
反転ゾーン / ピークボリューム / 主要プレーヤーのアクティブゾーン =       TS TPSプロシステム 説明書 RUS       /       説明書     英語     /           バージョン MT4        このインジケーターを購入したすべての購入者は、さらに以下を無料で受け取ります: RFI SIGNALS サービスからの取引シグナルへの 6 か月間のアクセス - TPSproSYSTEM アルゴリズムに従った既製のエントリ ポイント。 定期的に更新されるトレーニング資料 - 戦略に没頭し、プロフェッショナル レベルを高めます。 平日は 24 時間 365 日サポート、非公開のトレーダー チャットへのアクセス - コミュニケーション、サポート、市場状況の分析。 著者の設定ファイル - 余分な労力をかけずに最大の結果を達成するための自動インジケーター設定。 主な機能: 売り手と買い手のアクティブなゾーンを表示します。 このインジケーターは、購入と販売の正しい最初のインパルス レベル/ゾーンをすべて表示します。これらのレベル/ゾーンがアクティブに
今、147ドル(いくつかの更新後に499ドルに増加します) - 無制限のアカウント(PCSまたはMac) RelicusRoad ユーザー マニュアル + トレーニング ビデオ + プライベート Discord グループへのアクセス + VIP ステータス 市場の新しい見方 RelicusRoad は、外国為替、先物、暗号通貨、株式、および指数の世界で最も強力な取引インジケーターであり、トレーダーに収益を維持するために必要なすべての情報とツールを提供します。初心者から上級者まで、すべてのトレーダーが成功するためのテクニカル分析と取引計画を提供します。これは、将来の市場を予測するのに十分な情報を提供する重要な取引指標です。意味をなさないチャート上のいくつかの異なる指標ではなく、完全な解決策を信じています.これは、信号、矢印 + 価格アクション情報を表示するオールインワンのインジケーターで、他に類を見ない非常に正確です。 強力な AI に基づいて、RelicusRoad は不足している情報とツールを提供して、あなたを教育し、トレーディングのプロ、成功したトレーダーにします。 ほと
Quantum TrendPulse を ご紹介します。これは、   SuperTrend   、   RSI   、および Stochastic のパワーを 1 つの包括的なインジケーターに組み合わせて、取引の可能性を最大限に引き出す究極の取引ツールです。精度と効率を求めるトレーダー向けに設計されたこのインジケーターは、市場のトレンド、勢いの変化、最適なエントリー ポイントとエグジット ポイントを自信を持って特定するのに役立ちます。 主な特徴: SuperTrend 統合: 現在の市場動向に簡単に追従し、収益性の波に乗ることができます。 RSI精度: 買われすぎと売られすぎのレベルを検出し、市場の反転のタイミングに最適で、SuperTrendのフィルターとして使用されます。 確率的精度: 確率的振動を活用して、変動の激しい市場で隠れたチャンスを見つけます。SuperTrend のフィルターとして使用されます。 マルチタイムフレーム分析:   M5 から H1 または H4 まで、さまざまなタイムフレームで市場を常に把握します。 カスタマイズ可能なアラート: カスタム取引条件が満たされ
FX Volume MT5
Daniel Stein
4.82 (17)
FX Volume:ブローカー視点で捉える本物の市場センチメント クイック概要 トレード手法をさらに高めたいとお考えですか? FX Volume は、リテールトレーダーやブローカーのポジション状況をリアルタイムで提供します。これは、COTのような遅延レポートよりもはるかに早く知ることができます。安定した利益を目指す方も、さらなる優位性を求める方も、 FX Volume は大きな不均衡を見極め、ブレイクアウトを確認し、リスク管理を洗練させるのに役立ちます。今すぐ始めて、実際の出来高データがどのように意思決定を変革するかを体感してください! 1. FX Volume がトレーダーにとって非常に有益な理由 高精度の早期警戒シグナル • 各通貨ペアを売買しているトレーダー数を、他者よりも早く、ほぼリアルタイムで把握できます。 • FX Volume は、複数のリテールブローカーから得られる本物の出来高データを収集し、分かりやすい形式で提供する 唯一 のツールです。 強力なリスク管理 • ロングやショートの大きな偏り(インバランス)を特定し、潜在的なトレンド転換を見逃しません。ストップ
MetaBands M5
Vahidreza Heidar Gholami
4.5 (2)
MetaBandsは、強力でユニークなアルゴリズムを使用してチャンネルを描画し、トレンドを検出して、トレーダーに取引の入出ポイントを提供することができます。チャンネル指標に加えて、強力なトレンド指標でもあります。入力パラメータを使用して新しいチャンネルを作成するために、異なるタイプのチャンネルを統合することができます。MetaBandsは、市場のイベントについてユーザーに通知するために、すべてのタイプのアラートを使用します。 特徴 ほとんどのチャンネルアルゴリズムをサポート 強力なトレンド検出アルゴリズム 異なるタイプのチャンネルを統合する能力 マルチタイムフレームおよびマルチカレンシー(シグナルマトリックス) すべてのタイプのアラート機能(サウンド、画面フラッシャー、プッシュ通知、メール、ポップアップ、矢印) 再描画しない トレンド検出 MetaBandsは、チャネル内を振動する青いラインを使用してトレンドを検出します。ラインがチャネルの上部バンドに達すると、下降トレンドの開始を示し、下部バンドに達すると上昇トレンドの開始を示します。青いラインが中心ラインに近づくと、市場はコンソリ
MonetTrend — Премиум-индикатор для торговли по тренду (M30, H1, H4) MonetTrend — это мощный и визуально понятный трендовый индикатор, созданный для торговли на таймфреймах M30, H1 и H4. Он идеально подходит для работы с волатильными инструментами, такими как: • Золото (XAUUSD) • Криптовалюты (BTCUSD) • Валютные пары (EURUSD, USDJPY и др.) Ключевые особенности MonetTrend: • Автоматическое отображение Take Profit 1 (TP1) и Stop Loss (SL): После появления сигнала индикатор сразу показывает: • TP
これはほぼ間違いなく、MetaTraderプラットフォームで見つけることができる最も完全な調和価格形成自動認識インジケーターです。 19種類のパターンを検出し、フィボナッチプロジェクションをあなたと同じように真剣に受け止め、潜在的逆転ゾーン(PRZ)を表示し、適切なストップロスとテイクプロフィットレベルを見つけます。 [ インストールガイド | 更新ガイド | トラブルシューティング | よくある質問 | すべての製品 ] 19の異なる調和価格形成を検出します プライマリ、派生および補完フィボナッチ投影(PRZ)をプロットします 過去の価格行動を評価し、過去のすべてのパターンを表示します この指標は、独自の品質とパフォーマンスを分析します 適切なストップロスとテイクプロフィットのレベルを表示します ブレイクアウトを使用して適切な取引を通知します すべてのパターン比をグラフにプロットします 電子メール/音声/視覚アラートを実装します スコット・M・カーニーの本に着想を得て、この指標は最も純粋で急を要するトレーダーのニーズを満たすように設計されています。ただし、トレードを容易にする
MONEYTRON – ТВОЙ ЛИЧНЫЙ СИГНАЛ НА УСПЕХ! XAUUSD | AUDUSD | USDJPY | BTCUSD Поддержка таймфреймов: M5, M15, M30, H1 Почему трейдеры выбирают Moneytron? 82% успешных сделок — это не просто цифры, это результат продуманной логики, точного алгоритма и настоящей силы анализа. Автоматические сигналы на вход — не нужно гадать: когда покупать, когда продавать. 3 уровня Take Profit — ты сам выбираешь свой уровень прибыли: безопасный, уверенный или максимум. Четкий Stop Loss — контролируешь риск
Was: $299  Now: $149  Supply Demand uses previous price action to identify potential imbalances between buyers and sellers. The key is to identify the better odds zones, not just the untouched ones. Blahtech Supply Demand indicator delivers functionality previously unavailable on any trading platform. This 4-in-1 indicator not only highlights the higher probability zones using a multi-criteria strength engine, but also combines it with multi-timeframe trend analysis, previously confirmed swings
このダッシュボードは、選択されたシンボルの最新の利用可能なハーモニックパターンを表示するので、時間を節約し、より効率的に /   MT4バージョン 。 無料インジケーター:   Basic Harmonic Pattern インジケーター列 Symbol : 選択したシンボルが表示されます。 Trend :   強気または弱気 Pattern : パターンの種類(ガートレー、バタフライ、バット、カニ、サメ、サイファー、ABCD) Entry : エントリー価格 SL: ストップロス価格 TP1: 1回目の利食い価格 TP2: 2回目の利食い価格 TP3:   3回目の利食い価格 Current price :   現在値 Age (in bars):    最後に描画されたパターンの年齢 主な入力項目 Symbols:   "28 Major Currency Pairs "または "Selected Symbols "から選択。 Selected Symbols:   カンマで区切られた監視したいシンボル("EURUSD,GBPUSD,XAUUSD")。ブローカーがペアに接
まず最初に、このトレーディングインジケーターは「再描画なし」「再描画なし」「遅延なし」であることを強調する価値があります。これにより、手動取引とアルゴリズム取引の両方に最適です。 ユーザーマニュアル、プリセット、オンラインサポートが含まれています。 AI Trend Pro Maxは、精度、力、シンプルさを求めるトレーダーのために設計された洗練されたオールインワンのトレーディングシステムです。以前のインジケーターを通じて何年もの開発を経ており、これは現在までの最も進化したバージョンで、複数の信号層、プロフェッショナルグレードのフィルター、およびスマートなユーザーインターフェースを備えています。 初心者でもプロのトレーダーでも、AI Trend Pro Maxは、どんな市場状況でも自信を持って取引するために必要なすべてを提供します。 主要な戦略とシステムのロジック: マルチレイヤー信号エンジン:トレンドモメンタム、価格強度、ボリューム、RSI、ボリンジャーバンド、そしてキャンドルカラー論理を組み合わせ、高確率のエントリーを提供します。 トレンドモメンタム:トレンドが強化されているの
Elliott Wave Trend was designed for the scientific wave counting. This tool focuses to get rid of the vagueness of the classic Elliott Wave Counting using the guideline from the template and pattern approach. In doing so, firstly Elliott Wave Trend offers the template for your wave counting. Secondly, it offers Wave Structural Score to assist to identify accurate wave formation. It offers both impulse wave Structural Score and corrective wave Structure Score. Structural Score is the rating to sh
優れたテクニカルインジケーター「Grabber」をご紹介します。これは、すぐに使える「オールインワン」トレーディング戦略として機能します。 ひとつのコードに、市場のテクニカル分析ツール、取引シグナル(矢印)、アラート機能、プッシュ通知が強力に統合されています。 このインジケーターを購入された方には、以下の特典を無料で提供します: Grabberユーティリティ:オープンポジションを自動で管理するツール ステップバイステップのビデオマニュアル:インジケーターのインストール、設定、取引方法を解説 カスタムセットファイル:インジケーターをすばやく自動設定し、最大限の成果を出すための設定ファイル 他の戦略はもう忘れてください!Grabberだけが、あなたを新たなトレードの高みへと導いてくれるのです。 Grabber戦略の主な特徴: 推奨タイムフレーム:M5〜H4 対応通貨ペア・資産:どれでも使用可能ですが、私が実際に検証した以下を推奨します(GBPUSD、GBPCAD、GBPCHF、AUDCAD、AUDUSD、AUDSGD、AUDCHF、NZDUSD、NZDCAD、EURCAD、EURUSD、E
次世代の自動化された需要と供給のゾーン。どのチャートでも機能する新しい革新的なアルゴリズム。すべてのゾーンは、市場の価格行動に従って動的に作成されています。 2種類のアラート --> 1) 価格がゾーンに達したとき 2) 新しいゾーンが形成されたとき もう 1 つの役に立たない指標はありません。実績のある完全な取引戦略を手に入れることができます。     新機能:     価格が需給ゾーンに達したときにアラートを出す     新しい需給ゾーンが作成されたときにアラートを発します     プッシュ通知アラート     ピップ単位のゾーン幅ラベル     MTF のもう 1 つのタイムフレーム。したがって、現在より 2 時間足高いのではなく、現在より 3 時間足し上に見えるようになります。     アラート/ゾーン/MTF 機能を有効/無効にするボタン あなたが得る利点:     取引から感情を取り除きます。     取引エントリをオブジェクト化します。     確率の高いセットアップで利益を上げましょう。     描画ゾーンから時間を節約します。
Royal Scalping Indicator is an advanced price adaptive indicator designed to generate high-quality trading signals. Built-in multi-timeframe and multi-currency capabilities make it even more powerful to have configurations based on different symbols and timeframes. This indicator is perfect for scalp trades as well as swing trades. Royal Scalping is not just an indicator, but a trading strategy itself. Features Price Adaptive Trend Detector Algorithm Multi-Timeframe and Multi-Currency Trend Low
これはMT5のインジケーターで、再描画なしで取引に参入するための正確なシグナルを提供します。 外国為替、暗号通貨、金属、株式、インデックスなど、あらゆる金融資産に適用できます。かなり正確な見積もりを提供し、取引を開始して終了するのに最適な時期を教えてくれます。1つのシグナルを処理しただけでインジケーターの元が取れた例の 動画 (6:22)をご覧ください。Entry PointsPro インジケーターの助けを借りたほとんどのトレーダーの最初の1週間の結果が改善しています。 Telegramグループ に登録してください。Entry Points Proインジケーターのメリットは次の通りです。 再描画のないエントリーシグナル 再描画されるインジケーターでは一度表示されたシグナルが削除されて大きな金銭的損失につながることがありますが、これと異なり、表示されて確認されたシグナルは消えることがありません。 エラーなしの取引開始 インジケーターアルゴリズムによって取引を開始する(資産を売買する)理想的な瞬間を見つけることができます。それを使用するすべてのトレーダーの成功率が向上します。 あら
初心者やエキスパートトレーダーに最適なソリューション! このインジケータは、独自の機能と秘密の数式を組み込んだ、ユニークで高品質かつ手頃な価格のトレーディングツールです。たった1枚のチャートで28の通貨ペアのアラートを表示します。新しいトレンドやスキャルピングチャンスの引き金となるポイントを正確に把握することができるので、あなたのトレードがどのように改善されるか想像してみてください! 新しい基本的なアルゴリズムに基づいて構築されているため、潜在的な取引の特定と確認がより簡単になります。これは、通貨の強さや弱さが加速しているかどうかをグラフィカルに表示し、その加速のスピードを測定するためです。加速すると物事は明らかに速く進みますが、これはFX市場でも同じです。つまり、反対方向に加速している通貨をペアにすれば、利益を生む可能性のある取引を特定することができるのです。 通貨の勢いを示す縦の線と矢印は、あなたの取引の指針となるでしょう。 ダイナミックマーケットフィボナッチ23レベルはアラートトリガーとして使用され、市場の動きに適応します。もしインパルスが黄色のトリガーラインに当たった場
IQ Gold Gann Levels a non-repainting, precision tool designed exclusively for XAUUSD/Gold intraday trading. It uses W.D. Gann’s square root method to plot real-time support and resistance levels, helping traders spot high-probability entries with confidence and clarity. William Delbert Gann (W.D. Gann) was an exceptional market analyst, whose trading technique was based on a complex blend of mathematics, geometry, astrology, and ancient mathematics which proved to be extremely accurate. Download
発見が困難で頻度が少ないため、分岐は最も信頼できる取引シナリオの1つです。このインジケーターは、お気に入りのオシレーターを使用して、通常の隠れた分岐点を自動的に見つけてスキャンします。 [ インストールガイド | 更新ガイド | トラブルシューティング | よくある質問 | すべての製品 ] 取引が簡単 通常の隠れた発散を見つけます 多くのよく知られている発振器をサポート ブレイクアウトに基づいて取引シグナルを実装します 適切なストップロスおよび利益レベルを表示します 設定可能なオシレーターパラメーター カスタマイズ可能な色とサイズ バー単位でサイズ別に分岐をフィルタリング パフォーマンス統計を実装します 電子メール/音声/視覚アラートを実装します 幅広い市場の見通しを提供するために、異なるオシレーターを使用して、干渉なしで同じチャートにインジケーターを何度もロードできます。このインジケーターは、次のオシレーターをサポートしています。 RSI CCI MACD オスマ 確率的 勢い 素晴らしい発振器 加速器発振器 ウィリアムズパーセントレンジ 相対活力指数 特に外国為替市場では、
The Trend Forecaster indicator utilizes a unique proprietary algorithm to determine entry points for a breakout trading strategy. The indicator identifies price clusters, analyzes price movement near levels, and provides a signal when the price breaks through a level. The Trend Forecaster indicator is suitable for all financial assets, including currencies (Forex), metals, stocks, indices, and cryptocurrencies. You can also adjust the indicator to work on any time frames, although it is recommen
MetaForecast M5
Vahidreza Heidar Gholami
5 (3)
MetaForecastは、価格データのハーモニクスに基づいて、どんな市場の未来を予測し視覚化します。市場が常に予測可能ではありませんが、価格にパターンがある場合、MetaForecastは可能な限り正確な未来を予測できます。他の類似製品と比較して、MetaForecastは市場のトレンドを分析することでより正確な結果を生成することができます。 入力パラメータ Past size (過去のサイズ) MetaForecastが将来の予測を生成するために使用するバーの数を指定します。モデルは選択したバー上に描かれた黄色の線で表されます。 Future size (将来のサイズ) 予測すべき将来のバーの数を指定します。予測された将来は、ピンクの線で表示され、その上に青い回帰線が描かれます。 Degree (程度) この入力は、MetaForecastが市場で行う分析のレベルを決定します。 Degree 説明  0 Degree 0の場合、価格の全てのピークや谷、そして詳細をカバーするために、「Past size」の入力に大きな値を使用することが推奨されています。  1 (推奨) Degre
if you want to test it : private message me ( MT5 demo testing doesn't work ) Designed to help traders gain a deeper understanding of the market’s true order flow dynamics . By visualizing the “ footprints ” left by candles, this indicator reveals how the delta ( the difference between buying and selling pressure ) changes during the candle formation, as well as how volume fluctuates at different price levels. These insights are essential for traders seeking to identify reversals, breakouts, and
WHY IS OUR FXACCCURATE LS MT5 THE PROFITABLE ? PROTECT YOUR CAPITAL WITH RISK MANAGEMENT Gives entry, stop and target levels from time to time. It finds Trading opportunities by analyzing what the price is doing during established trends. POWERFUL INDICATOR FOR A RELIABLE STRATEGIES We have made these indicators with a lot of years of hard work. It is made at a very advanced level. Established trends provide dozens of trading opportunities, but most trend indicators completely ignore them! The
CBT Quantum Maverick 高効率バイナリーオプション取引システム CBT Quantum Maverickは、高いパフォーマンスとシンプルさを追求するトレーダー向けに設計されたバイナリーオプション取引システムです。カスタマイズの必要がなく、最適化された状態で使用を開始できます。シグナルに従うだけで、少しの練習でマスターできます。 主な特徴: シグナルの精度: 現在のローソク足を基に次のローソク足の取引シグナルを生成し、頻繁な再描画がありません。 多様な市場対応: バイナリーオプション取引に特化し、さまざまなブローカーや資産クラスに対応しています。 対応可能: Deriv Synthetic Charts :すべてのタイムフレームで使用可能。 OTCチャート :Quotex、PocketOption、Binomo、Stockity、IQOption、Exnova、OlympTrade、Deriv、Binolla、Homebrokerなどのブローカーに対応。MT5へのインポートは最初の1週間無料、その後は有料サービス。 FX、仮想通貨、商品市場 :幅広い資産利用が可能
初心者やエキスパートトレーダーに最適なソリューション! このインジケーターは、独自の機能と新しい計算式を取り入れた、ユニークで高品質、かつ手頃な価格のトレーディングツールです。たった1枚のチャートで28の為替ペアの通貨強度を読み取ることができます。新しいトレンドやスキャルピングチャンスの引き金となるポイントを正確に特定することができるので、あなたのトレードがどのように改善されるか想像してみてください。 ユーザーマニュアルはこちら  https://www.mql5.com/en/blogs/post/697384 これが最初の1本、オリジナルだ! 価値のないクローンを買わないでください。 特別な サブウィンドウの矢印で強い通貨の勢いを表示 GAPがあなたのトレードを導く! 基準通貨や気配値が売られすぎ・買われすぎのゾーン(外相フィボナッチレベル)にあるとき、個別チャートのメインウィンドウに警告表示。 通貨がレンジの外側から反落した場合、プルバック/リバーサルのアラート。 クロスパターンの特別なアラート 複数の時間枠を選択可能で、トレンドを素早く確認できます。通貨強度のライン
IVISTscalp5
Vadym Zhukovskyi
5 (6)
iVISTscalp5インジケーターをご紹介します。このインジケーターは、トレーディングにおいて独自でありながら効果的です。時間データに基づくこのインジケーターは、多年にわたる経験と金融市場の深い分析の結果です。iVISTscalp5インジケーターは、手動トレーディングにとって優れたツールです。便利さ、簡単さ、可視化 - すべての複雑さが内部に隠されています。私たちは、iVISTscalp5インジケーターの設定と使用を最大限に簡素化しました。このインジケーターは、MT5ターミナルにあるすべての金融商品に適しています。 稼働時間は、4時から20時(UTC+3)です。 iVISTscalp5インジケーターメニュー(スクリーンショット1を参照): History - 引用を計算する週数 dT_min - 時間間隔の選択(分) TFline - 水平ボリュームの作成(時間枠) BARSline - 水平ボリュームの作成(バー数) TFtrend1 - デイリーチャンネルの作成(時間枠) BARStrend1 - デイリーチャンネルの作成(バー数) TFtrend2 - 週次チャンネルの作成(時
作者のその他のプロダクト
ポジティブなレビューを残してください。 重要な注意 :スクリーンショットに表示されている画像は、私のインジケーターである「Suleiman Levels」インジケーターと「RSI Trend V」インジケーターのものであり、もちろん「Time Candle」も含まれています。これは、高度な分析と独占的なレベルを提供する包括的なインジケーター「Suleiman Levels」の一部です。 気に入ったら、「RSI Trend V」インジケーターを試してみてください: https://www.mql5.com/en/market/product/132080 また、気に入ったら「Suleiman Levels」インジケーターを試してみてください: https://www.mql5.com/en/market/product/128183 「Time Candle Suleiman」インジケーターは、現在のキャンドルの残り時間をスムーズかつエレガントに表示するように設計されています。すべての時間軸で、カウントダウンの外観を完全にカスタマイズするオプションを提供しており、フォントの種類、サイズ
FREE
重要な注意事項: スクリーンショットに表示されている「一部の画像」は、私のインジケーターである Suleiman Levels Indicator および RSI Trend V Indicator のものです。 RSI Trend V Indicator はトレンドの識別を目的として設計されており、フィボナッチと統合して目標ゾーンや潜在的な反転ポイントを特定します。これは、全体的なトレンドの方向を判断するための非常に強力で厳格かつ有用なインジケーターです。価格の反転が予想される領域に、強気と弱気の矢印が表示されます。しかし、注目すべき重要な要素は以下の通りです。 Thick blue line - Uptrend Thick yellow line - Downtrend Green cloud above the thick green line Red cloud below the thick yellow line Bullish and bearish arrows 新しい矢印が表示される際に現れるフィボナッチレベルを考慮することが不可欠です。そのため、その他の詳細にも注
重要:このエキスパートはデータダウンロード専用であり、いかなる取引操作も実行しません。 エキスパートアドバイザーの機能:正確に、正しく、迅速に過去データをダウンロードします。 必要性:時々、図形、グラフィック、線、矢印を含む特定のインジケーターがチャートに配置されたり、時間枠を切り替えたりする際に奇妙な動作をすることがあります。図形や線がメイン画面で不自然に動くことがあります。この問題は、一部のインジケーターが必要とするデータが不足しているために発生します。 使用手順: 新しいウィンドウで新しい通貨ペアを開きます。 エキスパートアドバイザーを新しい通貨ペアにドラッグします。 短時間で必要な過去データがダウンロードされます。 プラットフォーム画面の下部にあるToolBoxセクションのExpertsタブ(説明画像に示されている通り)に、メッセージと通知が表示されます。ダウンロードが成功したことを示す確認メッセージが表示されます: 「通貨ペアが正常にダウンロードされました。」 終了したらウィンドウを閉じてください。 重要な警告: エキスパートアドバイザーの設定には、DownloadAllSy
FREE
フィルタ:
purcemputpcp
57
purcemputpcp 2025.03.18 05:21 
 

Good indicator with helpful support 👍

Suleiman Alhawamdah
6867
開発者からの返信 Suleiman Alhawamdah 2025.03.19 20:27
Thank you my friend.. You are welcome and I wish you all the best
Zone William
51
Zone William 2025.02.24 09:08 
 

I am completely satisfied with this indicator; there is effort and solid underlying content behind it. I am also satisfied with the creator; he is helpful.

Suleiman Alhawamdah
6867
開発者からの返信 Suleiman Alhawamdah 2025.02.24 15:02
All my thanks to you my friend Zone. Your words reflect your nobility and character... I wish you all the best.
Boluwatife_06
30
Boluwatife_06 2025.01.30 12:37 
 

ユーザーは評価に対して何もコメントを残しませんでした

Suleiman Alhawamdah
6867
開発者からの返信 Suleiman Alhawamdah 2025.01.30 14:10
thank you Boluwatife for your support and review.
I truly appreciate it. At the moment, I don’t have a group, as managing one requires time and responsibility. However, I think the idea of a group for sharing ideas is great, especially since using the indicator and Levels with certain trading and financial analysis methods, such as ICT or other, leads to very positive results.
Sebastian Schmidt
1266
Sebastian Schmidt 2025.01.20 12:59 
 

ユーザーは評価に対して何もコメントを残しませんでした

Suleiman Alhawamdah
6867
開発者からの返信 Suleiman Alhawamdah 2025.01.25 19:24
Thank you very much, Mr. Sebastian, for your kind review...truly appreciate your encouragement.
I wish you success and good luck in your chart analysis.
micllAblen
65
micllAblen 2025.01.12 19:06 
 

ユーザーは評価に対して何もコメントを残しませんでした

Suleiman Alhawamdah
6867
開発者からの返信 Suleiman Alhawamdah 2025.01.13 22:06
Thank you so much. I was pleased with your review. I wish you all the best with your strategy.
David T
303
David T 2024.12.23 06:22 
 

After only 1 day of testing and now seeing this during live market conditions I can already see that this performs as intended . The Engulfing signals do align with the trend and multi time frame confluence is suggested to go with the higher TF...can be used for scalping as well . Seller was every responsive and welcomed my suggestion for an update...looking forward to that if it can be implemented due to the already complexity of the original code. Even though I am 99% on MT4 this indicator made me use my MT5 terminal more and more as I see the potential in this indicator. Got the full version at a great price. Highly recommended

Suleiman Alhawamdah
6867
開発者からの返信 Suleiman Alhawamdah 2024.12.23 09:43
Thank David so much, for your kind review.
I will try to add the timeframes soon, but as I mentioned, this might take some time since the code for the levels is very large, complex, and interconnected with other codes.
I wish you all the best and success in your trading!
レビューに返信
バージョン 7.7 2025.03.21
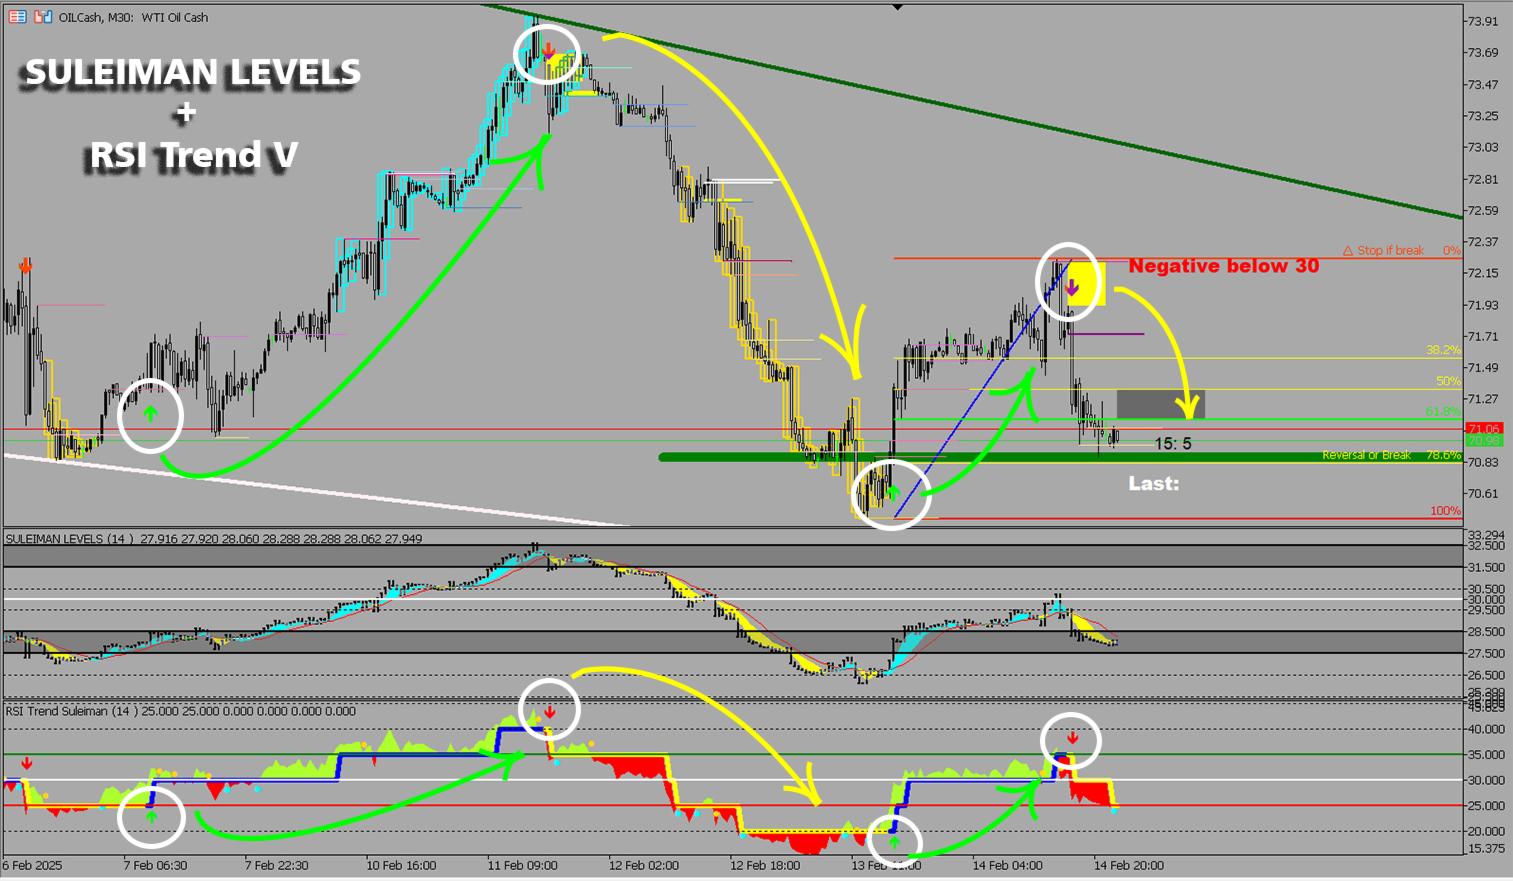
SULEIMAN LEVELS v 7.7:

A minor fix for the previous update v 7.6, related to two types of side trendlines.
バージョン 7.6 2025.03.21
SULEIMAN LEVELS v7.6:

1- Reconstruction of two types of side trendlines (which are usually in light colors: Uptrend in Honeydew color and Downtrend in LavenderBlush). These trendlines have been completely rebuilt to draw their lines using a different mechanism than before, based on new peak and trough detection rules.
The other dark trendlines (green or brown) still operate using the same mechanism.

2-Updates to the default settings for black support and resistance lines: The number of past candles will now be 20-30-40, with Line #3 enabled by default.."You can hide the third line or make any modifications through the control panel".

3-Various fixes and improvements.
バージョン 7.5 2025.03.14
SULEIMAN LEVELS v 7.5:

-Keeping the manual drawing of rectangles and trend lines without automatic deletion after changing the time frame or switching between pairs.
-Some improvements and fixes for minor issues.
バージョン 7.4 2025.03.09
SULEIMAN LEVELS v 7.4:

Some minor fixes and improvements.
バージョン 7.3 2025.03.07
SULEIMAN LEVELS v 7.3:

1-Added floating buttons for quick switching between candle bodies or wicks for side trendlines.
2-Added floating buttons for quick switching between candle bodies or wicks for support and resistance lines.
"There may sometimes be a very slight delay due to data processing" so Still under testing and improvements.

The market must be open for the switching to take effect.
The focus of switching is on side trendlines because the chart may sometimes rely on wicks for its movements or on the candle body.
3-Adjustments and Enhancements:
-Reset some default settings (All settings are adjustable according to your analysis preferences).
-Adjusted the previous candle check settings for side trendlines to 10-15-30-45.
-Adjusted the previous candle check settings for support and resistance lines to 20-30-50.
Note:
It is not necessary to enable all features in the indicator at once. Doing so may cause analysis confusion and overwhelm you. Essential elements such as colored level lines, side trendlines, support and resistance lines, pullbacks, and thick-colored support and resistance lines might be sufficient.

The remaining settings are optional—you can enable them and assess whether they add value to your analysis or serve as extra precautions for all possible scenarios.
バージョン 7.1 2025.02.24
SULEIMAN LEVELS v 7.1:

1- Updating the option related to "thick colored lines" for displaying Touching Sup/Res Line or Retesting Previous Top/Bottom.
2- Controlling the number of previous candles used to calculate Sup/Res Line or Retesting Previous Top/Bottom for "thick colored lines".
3- Option to display only the last two thick colored lines or all lines (default: last two thick lines, which is recommended).
- and Control over line colors.
- Adding explanatory notes about Modes for the Touch Line level types.
4- Changing the default settings for the number of previous candles used to calculate Support/Resistance Lines and Side Trend Lines from 15-30-60 to 10-15-30. Of course, you can choose different values as you see fit to display Support/Resistance Lines and Side Trend Lines.
5- General improvements.
バージョン 7.0 2025.02.16
SULEIMAN LEVELS v7.00:
Some improvements to enhance the efficiency and accuracy of the indicator.
Added an option to show or hide the "white text for tips."
Updated some default settings of the indicator.
バージョン 6.0 2025.01.16
SULEIMAN LEVELS v 6.00
Fixing some errors, and disappearance of some lines due to chart update.
バージョン 5.0 2025.01.14
SULEIMAN LEVELS v 5.00

Fixed some minor bugs.
バージョン 4.0 2025.01.11
SULEIMAN LEVELS v 4.00

Fixing some minor bugs, removing remnants of some old and accumulated touchline lines.


バージョン 3.0 2025.01.04
SULEIMAN LEVELS v 3.00
Now you can draw manual trend lines on the chart without them being automatically deleted after changing the time frame or switching to another pair.
バージョン 2.0 2024.12.17
SULEIMAN LEVELS v 2.00
Full control over lower cloud settings:
Line Cloud 1
Line Cloud 2
Line Cloud 3
Line Cloud 4