• 概要
  • レビュー (2)
  • コメント (5)
  • 最新情報

Laguerre RSI MT5

5

If you love this indicator, please leave a positive rating and comment, it will be a source of motivation to help me create more products <3

Key Takeaways

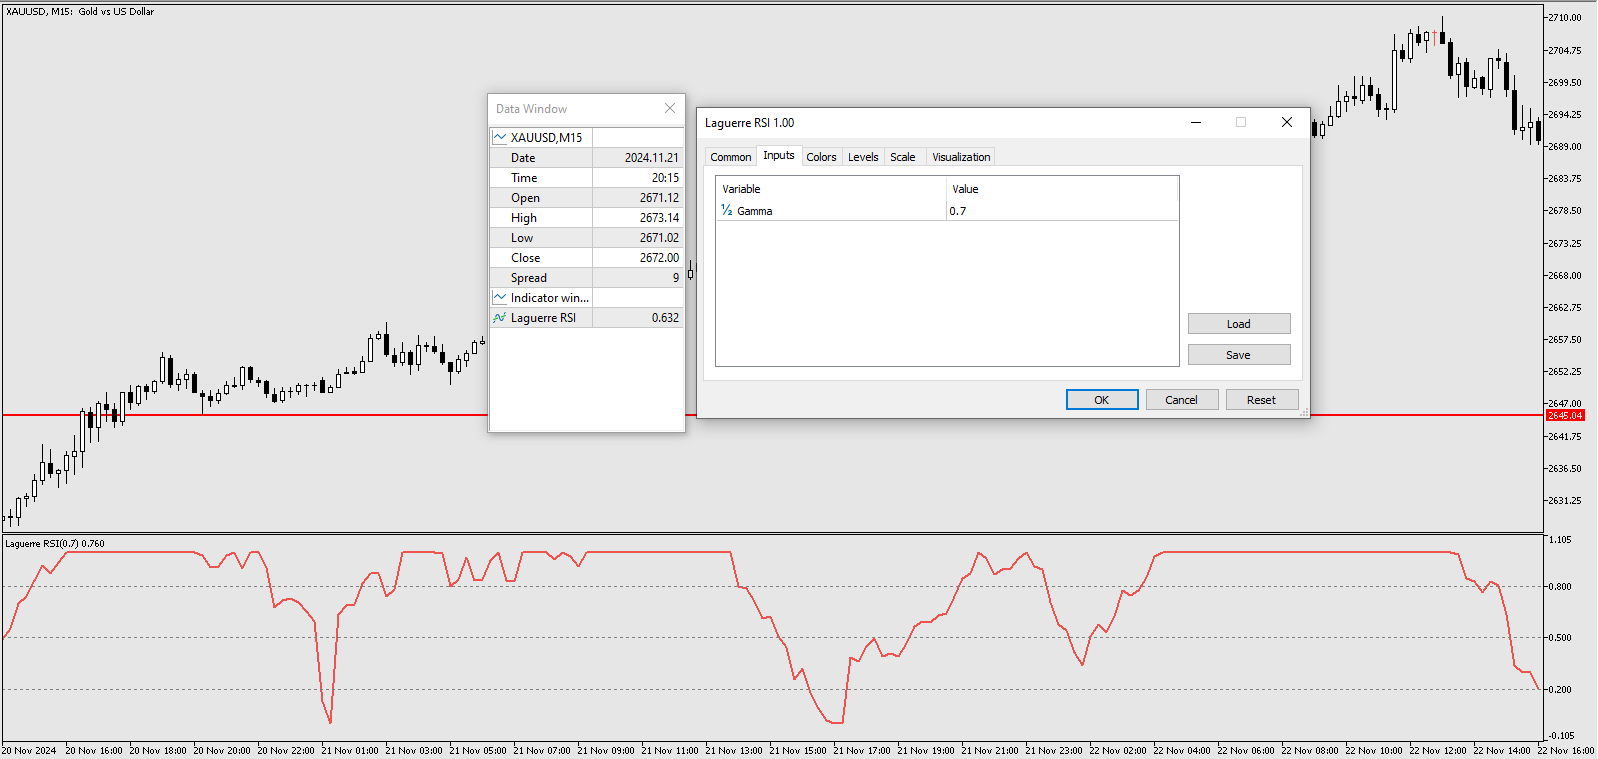
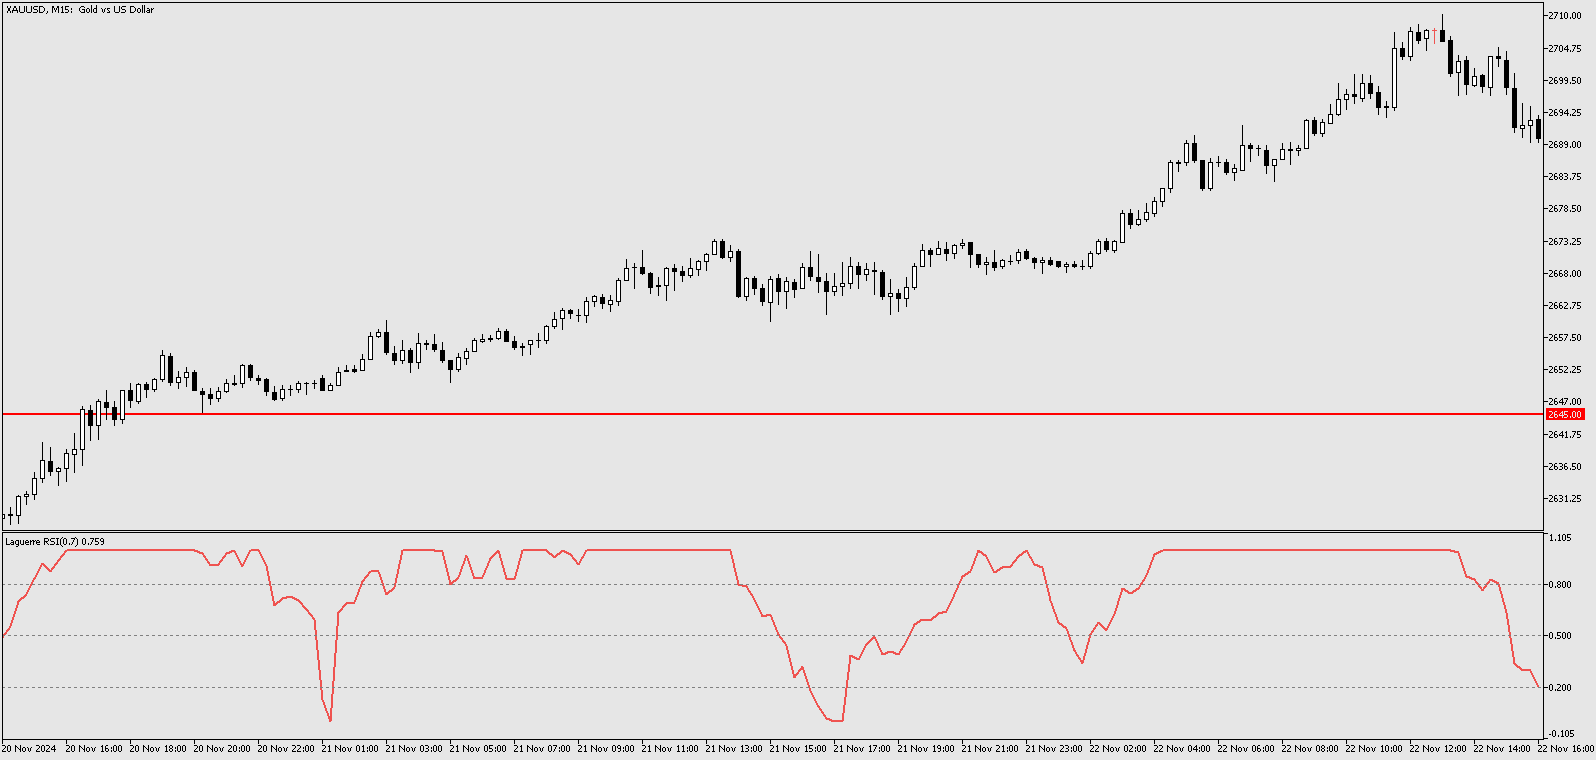
  • The Laguerre RSI is an enhanced version of the traditional Relative Strength Index (RSI) that incorporates Laguerre filters to smooth the price data. This helps reduce the noise and volatility that are often seen in the standard RSI, providing a cleaner and more reliable indicator for spotting trends, reversals, and overbought or oversold conditions.
  • One use of the Laguerre RSI is to identify trends. This is done by looking for sustained periods when the indicator is above or below the 0.5 line.
  • Also, a buy signal is generated when the Laguerre RSI line crosses above the 0.15 level, while a sell signal is generated when the Laguerre RSI line crosses below the 0.85 level.
However, like all indicators, it isn't foolproof, to avoid false signals, it's best to use the Laguerre RSI indicator with other indicators. Technical indicators should always be used with others for confirmation.


レビュー 2
1001035938
245
1001035938 2025.04.08 17:27 
 

Muito bom indicador ! Parabéns ao desenvolvedor!

AHMED NOUR ELDEEN
700
AHMED NOUR ELDEEN 2024.12.24 16:51 
 

A valuable tool for trend and reversal analysis but should be used with complementary indicators to avoid false signals.

おすすめのプロダクト
An ICT fair value gap is a trading concept that identifies market imbalances based on a three-candle sequence. The middle candle has a large body while the adjacent candles have upper and lower wicks that do not overlap with the middle candle. This formation suggests that there is an imbalance where buying and selling powers are not equal. Settings Minimum size of FVG (pips) -> FVGs less than the indicated pips will be not be drawn Show touched FVGs Normal FVG color -> color of FVG that hasn't
FREE
To download MT4 version please click here . - This is the exact conversion from TradingView: "Trend Direction Force Index - TDFI [wm]" By "causecelebre". - The screenshot shows similar results from tradingview and Metatrader when tested on ICMarkets on both platforms. - This indicator uses multiple levels of averaging to detect trend strength. - You can optimize filter low and filter high levels to achieve best results. - You have access to buffers to use in EAs. - This is a light-load processin
Your Pointer is no ordinary Forex channel. This corridor is built on the basis of the analysis of several candles, starting from the last one, as a result of which the extremes of the studied interval are determined. They are the ones who create the channel lines. Like all channels, it has a middle line as well as a high and low line. This channel is worth watching for its unusual behavior. The use of the Your Pointer indicator allows the trader to react in time to the price going beyond the bo
The indicator determines the ATR value (points) in a   classic way   (taking into calculation paranormal bars/candles) and   more correctly   -   ignoring   paranormal movements of the Instrument. Correctly it is excluding paranormal bars from the calculation, extremely small bars (less than 5%( customizable ) of the standard ATR) and extremely large bars (more than 150% ( customizable ) of the standard ATR) are ignored. This is a  Extended   version - allows you to set calculation parameters a
Introduction to Chart Pattern MT Chart Pattern MT is a chart pattern scanner to detect the triangle pattern, falling wedge pattern, rising wedge pattern, channel pattern and so on. Chart Pattern MT uses highly sophisticated chart pattern detection algorithm. However, we have designed it in the easy to use with intuitive user interface. Chart Pattern MT will show all the patterns in your chart in the most efficient format for your trading. You do not have to do tedious manual pattern detection an
The volume profile indicator of the market + a S mart oscillator . It works on almost all instruments - currency pairs , stocks , futures , cryptocurrency , on real volumes and on tick ones . You can set both the automatic definition of the profile range , for example , for a week or a month , etc . , and set the range manually by moving the boundaries ( two vertical lines red and blue ) . It is shown as a histogram . The width of the histogram at this level means , conditionally , the number of
Trend and Signals MT5  indicator scans  30 trading Instruments (Forex, Metals and Indices).     It uses special algorithm on the  current market   based on   Pure Price Action   and display the overall trend and signal on the dashboard. When signals are produced the indicator sends alert and notification. Strategy for Signals This indicator uses the daily timeframe to determine the direction of the trend. The hourly timeframe is used to identify possible entries. Main trend and is determined by
バイナリーオプションのインジケーターです。移動平均シグナル確認を使用して巻き込みローソク足を計算します。緑の買い矢印と赤の売り矢印がチャートに表示されます。 複数のペア(EUR/USD、EUR/JPY、USD/JPY...など)の3分足チャートと5分足チャートでテストされています。 EUR/JPY OTC や EUR/USD OTC などの Pocketoption OTC 市場でも機能します。 初心者向け、 マーチンゲールを使用している場合、推奨される設定は次のとおりです。 初期投資: $1.00 マーチンゲール乗数: 2.5 マーチンゲールステップ: 5 エキスパートトレーダーにとって、 マーチンゲールを使用する場合、初期投資はリスク管理戦略に従って決定されます。ただし、2.5 マルチプライヤーを強くお勧めし、ステップは 5 に維持します。 インジケーターはおそらく 5 番目のステップに到達しないでしょうが、インジケーターが売買できる余地をある程度与える必要があります。 添付のスクリーンショットをご覧ください。そして  ご質問がございましたら、お気軽にお問い合わせくだ
This indicator will help you track performance of your trades, even scalping trades.  You can use it with the Arab, and many other traders.  This indicator displays essential trading account information directly on your chart. It positions itself in one of the four corners of the screen and showcases details such as: Symbol: The symbol of the asset currently displayed on the chart. Profit/Loss: The total profit or loss in dollars for the current symbol. Pips: The total number of pips gained or
FREE
Breakeven line calculator
Wafa Mohammed Omar Abou Alwafa
5 (2)
This indicator shows the breakeven line level for the total number of open positions of the current symbol with P/L value and total volume. This indicator is helpful to decide the exit level when using a trading grid strategy. The style of the breakeven line is customizable to choose the color, line shape and font size of the positions description. Send mobile notification when crossing a positive P/L target
FREE
The Accumulation and Distribution indicator is a volume-based indicator that was essentially designed to measure underlying supply and demand. This is accomplished by trying to determine whether traders are actually accumulating (buying) or distributing (selling). This is accomplished by plotting a cumulative total of the money flow volume for each period. This indicator can reveal divergences between volume flow and actual price to primarily affirm a current trend or to anticipate a future reve
Version for MetaTrader 5. The indicator is based on point and figure chart, but their period is equal to ATR indicator values. Displays in the form of steps. Steps above zero indicate an uptrend. Below zero on a downtrend. Parameters: ATRPeriod - ATR period for calculation of steps. Note: The indicator uses closes price, thus it is recommended to consider completed bars.
Was: $249  Now: $149   Market Profile defines a number of day types that can help the trader to determine market behaviour. A key feature is the Value Area, representing the range of price action where 70% of trading took place. Understanding the Value Area can give traders valuable insight into market direction and establish the higher odds trade. It is an excellent addition to any system you may be using. Inspired by Jim Dalton’s book “Mind Over Markets”, this indicator is designed to suit the
Orion Vwap Bands
Joao Paulo Botelho Silva
Fundamentação teórica   A VWAP é uma média móvel ajustada pelo volume, ou seja, o peso de cada preço corresponde ao volume de ações negociadas no período, dando mais importância ao período em que se tenha mais negociações. A Orion Vwap Bands permite que o usuário use plote 8 bandas que podem ser utilizadas como suportes e resistências para o preço. Cada banda é calculada a partir da Vwap Tradicional: Ex.: Se escolhermos o valor 0.25 para a plotagem da Banda 1, pega-se o preço da Vwap e acrescent
The   Visual Volatility Clustering   indicator clusters the market based on volatility. The indicator does not redraw and gives accurate data, does not use closing prices. Uses the opening prices or the highs or lows of the previous completed bar. Therefore, all information will be clear and unambiguous. The essence of the indicator is to divide the price market into certain areas according to a similar type of volatility. This can be done in any way. In this example, the indicator is configure
If you use the MFI (Money Flow Index) indicator, the waiting time till the next signal can be long enough. Now you can avoid sitting in front of the monitor by using MFI Alerts. This is an addition or a replacement to the standard MFI oscillator . Once there appears an MFI signal on the required level, the indicator will notify you with a sound or push, so you will never miss a signal. This is especially significant if you follow the indicator in different timeframes and currency pairs, which ca
**  All Symbols  x  All Timeframes  scan just by pressing scanner button ** *** Contact me  to send you instruction and add you in "Wolfe Wave Scanner group" for sharing or seeing experiences with other users. Introduction: A Wolfe Wave is created with five-wave patterns in price. It shows supply and demand and a fight towards a balance price. T hese waves of price actions can help traders identify the boundaries of   the trend . Also  It helps forecast how the price will move in the near futur
Gold instrument scanner is the chart pattern scanner to detect the triangle pattern, falling wedge pattern, rising wedge pattern, channel pattern and so on. Gold instrument scanner uses highly sophisticated pattern detection algorithm. However, we have designed it in the easy to use and intuitive manner. Advanced Price Pattern Scanner will show all the patterns in your chart in the most efficient format for your trading. You do not have to do tedious manual pattern detection any more. Plus you
This indicator is a classic implementation of the Market Profile (Volume Profile Visible Range), allowing for the display of price density over time while highlighting the most significant price levels, the value area, and the control price within a specific trading session. MT4-version:   https://www.mql5.com/en/market/product/125261 The indicator can be applied across timeframes from M1 to D1, enabling the analysis of market profiles for daily, weekly, monthly, or intraday trading. Utilizing
Volumes Direction MT5
William Oswaldo Mayorga Urduy
ボリューム方向MT5 通常、現在の音量が前の音量よりも大きい場合、音量インジケーターにはデフォルトの色の変化があります。これは重要ですが、あまり役に立ちません。 このため、このインジケーターは、通常のボリュームに加えて、ろうそくが強気または弱気の場合、異なる色をペイントするように作成されました。デフォルトでは、強気の場合は青、弱気の場合は赤ですが、これらの色は トレーダーの好み。 あなたがあなたの取引を改善するのを助ける私の他の指標をチェックすることを忘れないでください。 ボリューム方向MT5 通常、現在の音量が前の音量よりも大きい場合、音量インジケーターにはデフォルトの色の変化があります。これは重要ですが、あまり役に立ちません。 このため、このインジケーターは、通常のボリュームに加えて、ろうそくが強気または弱気の場合、異なる色をペイントするように作成されました。デフォルトでは、強気の場合は青、弱気の場合は赤ですが、これらの色は トレーダーの好み。 あなたがあなたの取引を改善するのを助ける私の他の指標をチェックすることを忘れないでください。
Based on the trading model/strategy/system of gold double-position hedging and arbitrage launched by Goodtrade Brokers, problems encountered in daily operations: 1. Account B immediately places an order immediately following account A. 2: After account A places an order, account B will automatically copy the stop loss and take profit. 3: Account A closes the position of Account B and closes the position at the same time. 4: When account B closes the position, account A also closes the position.
Bull bear pressure indicator - is the manual system which defines bull/bear market. When lines is above zero level - market is strong bullish, and when lines below zero level - market is bearish. First line represents global trend and second one are smoothed and shows local market's mood. Main inputs are : MainPeriod- main indicator's period for global trend calculation; SignalPeriod - period for smoothed and shows local market's trend; Main Indicator's Features Signals are not repaint,non-late
WAPV Weis Wave Chart Forex
Eduardo Da Costa Custodio Santos
The Weis Wave Chart Forex for MT5 is a Price and Volume indicator. The Price and Volume reading was widely disseminated through Richard Demille Wyckoff based on the three laws created by him: Supply and Demand, Cause and Effect and Effort vs. Result. In 1900 R.Wyckoff already used the wave chart in his analyses. Many years later, around 1990, David Weis Automated R. Wyckoff's wave chart and today we bring you the evolution of David Weis' wave chart. It shows the amount of Volume and the amount o
UR Vortex MT5 The Probabilistic UR Vortex Formula: An Accurate System for Predictive Market Analysis using Volatility and Standard Deviation Calculations. The UR Vortex MT5 indicator is a technical analysis tool that uses volatility and standard deviation calculations to predict potential tops and bottoms in a market. It measures the strength of a trend by calculating the distance between the current price and a moving average, and then standardizing this distance by dividing it by the average t
Our new indicator is an important part of the Smart Money Concepts (SMC) system It uses a modern market vision and fast calculation methods. As a result, the trader has a complete picture of the trade at every moment in time, which makes the process of obtaining results easier and faster. Our new indicator displays the following important patterns:   Order Blocks. Imbalance – Fair Value Gap (FVG). Break Of Structures (BoS). Change of character (CHoCH). Equal highs & lows. Premium , Equilibrium
True Weis Wave
Atila Goncalves Firmino
A version based on David Waves' description in his book 'Trade About to Happen' of his adaptation of the Wyckoff wave chart. The indicator directionally accumulates volume, adding to each brick or candle close, with color indication for up and down. it can be used it with tick or real volume, it also changes color when the accumulated value of the previous wave is exceeded, being the trade signal. Yellow color is used for doji candlestick, it will continue with accumulation without zero the sum
The market is unfair if only because 10% of participants manage 90% of funds. An ordinary trader has slim changes to stand against these "vultures". This problem can be solved. You just need to be among these 10%, learn to predict their intentions and move with them. Volume is the only preemptive factor that faultlessly works on any timeframe and symbol. First, the volume appears and is accumulated, and only then the price moves. The price moves from one volume to another. Areas of volume accumu
RSI Dashboard  uses the value of Relative Strength Index indicator. The parameters can be adjusted via the Edit boxes of this dashboard. The monitoring pairs will be selected by adding to the Market Watch (no need to set  prefixes or suffixes) , you can monitor many pairs as you like. This dashboard will check almost popular time frame (M1,M5,M15,M30,H1,H4 and D1). The colors can be customized. We can have a look at many pairs and many time frames without opening the chart. In addition, we can
This indicator shows a candle combination based on dodge, dodge and pin bar. The logic of the pattern is to stand on the side of strength, after uncertainty. The indicator is universal and is useful for trading binary options, forex, ETFs, cryptocurrency, stocks. The indicator supports timeframes from M5 to MN, including non-standard TF presented in MT5. (М5,М6,М10,M12, M15, M20, M30, H1, H2, H3, H4, H6, H8, H12, D1, W1, MN). The ability to enable and disable TF is implemented. Sound alerts and
The ChanLun or Chan theory is one of the most popular trading theories in China. But it seems like that it has little influence in western countries. Actually, the Chan Theory is based on a sophisticated mathematical model. The basic idea ChanLun is to simplify the bar chart by its model. With the help of ChanLun, a trader can analyze and predict the trend of future goods, stocks. In ChanLun, there are several basic elements called fractals, strokes, line segments and pivots . A trader should pa
このプロダクトを購入した人は以下も購入しています
トレンド スクリーナー インジケーターでトレンド取引の力を解き放ちます。ファジー ロジックと複数通貨システムを活用した究極のトレンド取引ソリューションです。 ファジー ロジックを活用した革新的なトレンド インジケーターである Trend Screener を使用して、トレンド取引を向上させます。 これは、13 を超えるプレミアム ツールと機能、および 3 つの取引戦略を組み合わせた強力なトレンド追跡インジケーターであり、Metatrader をトレンド アナライザーにする多用途の選択肢となります。 期間限定オファー : トレンド スクリーナー インジケーターは、わずか 100 ドルで生涯ご利用いただけます。 (元の価格 50$ ) (オファー延長) Trend Screener の 100% 非再描画精度の揺るぎない精度を体験して、取引の決定が過去の価格変動の影響を受けないようにしてください。 マルチタイムフレームおよびマルチ通貨機能の多用途性を解放し、比類のない自信を持って外国為替、商品、暗号通貨、インデックスの世界を取引できるようにします。 Trend Screener の包括的な
このインジケーターを購入された方には、以下の特典を 無料 で提供しています: 各トレードを自動で管理し、ストップロスとテイクプロフィットを設定し、戦略ルールに基づいてポジションを決済する補助ツール 「Bomber Utility」 様々な銘柄に合わせたインジケーターの設定ファイル(セットファイル) 「最小リスク」、「バランスリスク」、「待機戦略」 の3つのモードで使用できる Bomber Utility 用の設定ファイル このトレーディング戦略をすぐに導入・設定・開始できる ステップバイステップのビデオマニュアル ご注意: 上記の特典を受け取るには、MQL5のプライベートメッセージシステムを通じて販売者にご連絡ください。 オリジナルのカスタムインジケーター 「Divergence Bomber(ダイバージェンス・ボンバー)」 をご紹介します。これは、MACDのダイバージェンス(乖離)戦略に基づいた 「オールインワン」型のトレーディングシステム です。 このテクニカルインジケーターの主な目的は、価格とMACDインジケーターの間に発生するダイバージェンスを検出 し、将来の価格の動きを示す
PUMPING STATION – あなた専用の「オールインワン」戦略 PUMPING STATIONは、あなたのトレードをより楽しく、そして効果的に変えてくれる革新的なFXインジケーターです。ただの補助ツールではなく、強力なアルゴリズムを備えた本格的なトレーディングシステムで、より安定したトレードのスタートをサポートします。 この商品をご購入いただくと、以下の特典を無料でお付けします: 専用セットファイル:自動設定による最大パフォーマンスを実現。 ステップバイステップのビデオマニュアル:PUMPING STATION戦略の使い方を学べます。 Pumping Utility:PUMPING STATION専用の半自動トレードボットで、より快適かつシンプルな運用を可能にします。 ※ご購入後すぐにご連絡ください。追加リソースへのアクセスを提供いたします。 PUMPING STATIONの仕組み: トレンド管理:市場のトレンド方向を即座に判断。トレンドはあなたの最高の味方です。 エントリーサイン:チャート上の矢印で、取引のタイミングと方向を明確に示します。 明確な目標設定:インジケーターが自
Golden Trend Indicator MT5
Noha Mohamed Fathy Younes Badr
4.89 (18)
Golden Trend indicator  is The best indicator for predicting trend movement this indicator never lags and never repaints and never back paints    and give  arrow buy and sell    before the candle appear  and it will help you and  will make your trading decisions clearer its work on all currencies and  gold and crypto and all time frame This unique  indicator uses very secret algorithms to catch the  trends, so you can trade using this indicator and see the trend clear on charts  manual guide and
VERSION MT4        —        ИНСТРУКЦИЯ RUS           —        INSTRUCTIONS  ENG 主な機能: レンダリングなしで正確な入力信号! シグナルが表示されると、それは関連性を維持します。これは、シグナルを提供してからそれを変更し、その結果、入金された資金が失われる可能性があるリドローインジケーターとの重要な違いです。より高い確率と精度で市場に参入できるようになりました。矢印が表示された後、ターゲットに到達する (利益確定) か反転シグナルが表示されるまで、ローソク足に色を付ける機能もあります。 STOP-LOSS/TAKE-PROFITゾーンの表示 エントリーポイントを検索する際の視覚的な明瞭さを改善するために、最適な市場エントリーポイントが検索される購入/販売ゾーンを最初に表示するモジュールが作成されました。ストップロスレベルを操作するための追加のインテリジェントロジックは、時間の経過とともにそのサイズを縮小するのに役立ち、それによって取引に参加するときの初期リスクを軽減します(Move SL)。 より高いタイ
反転ゾーン / ピークボリューム / 主要プレーヤーのアクティブゾーン =       TS TPSプロシステム 説明書 RUS       /       説明書     英語     /           バージョン MT4        このインジケーターを購入したすべての購入者は、さらに以下を無料で受け取ります: RFI SIGNALS サービスからの取引シグナルへの 6 か月間のアクセス - TPSproSYSTEM アルゴリズムに従った既製のエントリ ポイント。 定期的に更新されるトレーニング資料 - 戦略に没頭し、プロフェッショナル レベルを高めます。 平日は 24 時間 365 日サポート、非公開のトレーダー チャットへのアクセス - コミュニケーション、サポート、市場状況の分析。 著者の設定ファイル - 余分な労力をかけずに最大の結果を達成するための自動インジケーター設定。 主な機能: 売り手と買い手のアクティブなゾーンを表示します。 このインジケーターは、購入と販売の正しい最初のインパルス レベル/ゾーンをすべて表示します。これらのレベル/ゾーンがアクティブに
Gold Stuff mt5
Vasiliy Strukov
4.93 (179)
Gold Stuff mt5 は、金専用に設計されたトレンド指標であり、あらゆる金融商品にも使用できます。 インジケーターは再描画せず、遅れません。 推奨時間枠 H1. 設定と個人的なボーナスを得るために、購入後すぐに私に連絡してください!  トレンド スキャナーの強力なサポートを利用して、無料のインジケーターを入手し、プライバシーを守ります。あーみー!   設定 矢印を描く - オンオフ。 チャートに矢印を描く。 アラート - 可聴アラートのオンオフ。 メール通知 - オンオフ。 電子メール通知。 プチ通知 - オンオフ。 プッシュ通知。 次に、色域を調整します。 Gold Stuff mt5 は、金専用に設計されたトレンド指標であり、あらゆる金融商品にも使用できます。 インジケーターは再描画せず、遅れません。 推奨時間枠 H1. 設定と個人的なボーナスを得るために、購入後すぐに私に連絡してください!   設定 矢印を描く - オンオフ。 チャートに矢印を描く。 アラート - 可聴アラートのオンオフ。 メール通知 - オンオフ。 電子メール通知。 プチ通知 - オンオ
サポートとレジスタンススクリーナーは、1つのインジケーター内に複数のツールを提供するMetaTraderの1つのレベルインジケーターにあります。 利用可能なツールは次のとおりです。 1.市場構造スクリーナー。 2.強気のプルバックゾーン。 3.弱気プルバックゾーン。 4.デイリーピボットポイント 5.毎週のピボットポイント 6.毎月のピボットポイント 7.ハーモニックパターンとボリュームに基づく強力なサポートとレジスタンス。 8.銀行レベルのゾーン。 期間限定オファー:HVサポートおよびレジスタンスインジケーターは、50ドルと生涯でのみご利用いただけます。 (元の価格125 $) MQL5ブログにアクセスすると、分析例を含むすべてのプレミアム指標を見つけることができます。 ここをクリックしてください。 主な機能 ハーモニックおよびボリュームアルゴリズムに基づく強力なサポートおよびレジスタンスゾーン。 ハーモニックおよびボリュームアルゴリズムに基づく強気および弱気のプルバックゾーン。  市場構造スクリーナー 毎日、毎週、毎月のピボットポイント。 ドキュメント すべてのサポートおよび
今、147ドル(いくつかの更新後に499ドルに増加します) - 無制限のアカウント(PCSまたはMac) RelicusRoad ユーザー マニュアル + トレーニング ビデオ + プライベート Discord グループへのアクセス + VIP ステータス 市場の新しい見方 RelicusRoad は、外国為替、先物、暗号通貨、株式、および指数の世界で最も強力な取引インジケーターであり、トレーダーに収益を維持するために必要なすべての情報とツールを提供します。初心者から上級者まで、すべてのトレーダーが成功するためのテクニカル分析と取引計画を提供します。これは、将来の市場を予測するのに十分な情報を提供する重要な取引指標です。意味をなさないチャート上のいくつかの異なる指標ではなく、完全な解決策を信じています.これは、信号、矢印 + 価格アクション情報を表示するオールインワンのインジケーターで、他に類を見ない非常に正確です。 強力な AI に基づいて、RelicusRoad は不足している情報とツールを提供して、あなたを教育し、トレーディングのプロ、成功したトレーダーにします。 ほと
Quantum TrendPulse を ご紹介します。これは、   SuperTrend   、   RSI   、および Stochastic のパワーを 1 つの包括的なインジケーターに組み合わせて、取引の可能性を最大限に引き出す究極の取引ツールです。精度と効率を求めるトレーダー向けに設計されたこのインジケーターは、市場のトレンド、勢いの変化、最適なエントリー ポイントとエグジット ポイントを自信を持って特定するのに役立ちます。 主な特徴: SuperTrend 統合: 現在の市場動向に簡単に追従し、収益性の波に乗ることができます。 RSI精度: 買われすぎと売られすぎのレベルを検出し、市場の反転のタイミングに最適で、SuperTrendのフィルターとして使用されます。 確率的精度: 確率的振動を活用して、変動の激しい市場で隠れたチャンスを見つけます。SuperTrend のフィルターとして使用されます。 マルチタイムフレーム分析:   M5 から H1 または H4 まで、さまざまなタイムフレームで市場を常に把握します。 カスタマイズ可能なアラート: カスタム取引条件が満たされ
Matrix Arrow Indicator MT5
Juvenille Emperor Limited
5 (13)
マトリックスアローインジケーターMT5は、すべてのシンボル/商品(外国為替、商品、暗号通貨、インデックス、株式)で使用できる100%再描画されていないマルチタイムフレームインジケーターに続くユニークな10in1トレンドです。マトリックスアローインジケーターMT5は、初期段階で現在のトレンドを判断し、最大10の標準インジケーターから情報とデータを収集します。 平均方向移動指数(ADX) 商品チャネルインデックス(CCI) クラシック平研アシキャンドル 移動平均 移動平均収束発散(MACD) 相対活力指数(RVI) 相対力指数(RSI) 放物線SAR ストキャスティクス ウィリアムズのパーセント範囲 すべてのインジケーターが有効な買いまたは売りシグナルを与えると、対応する矢印がチャートに印刷され、次のろうそく/バーの開始時に強い上昇トレンド/下降トレンドを示します。ユーザーは、使用するインジケーターを選択し、各インジケーターのパラメーターを個別に調整できます。マトリックスアローインジケーターMT5は選択されたインディケーターからのみ情報を収集し、それらのデータのみに基づいてアローを印刷
FX Power: 通貨の強弱を分析して、より賢い取引を実現 概要 FX Power は主要通貨と金の実際の強弱をあらゆる市場状況で理解するための必須ツールです。強い通貨を買い、弱い通貨を売ることで、 FX Power は取引の意思決定を簡素化し、高い確率の取引機会を見出します。トレンドを追従する場合でも、極端なデルタ値を使用して反転を予測する場合でも、このツールはあなたの取引スタイルに完全に適応します。ただ取引するだけではなく、 FX Power で賢く取引をしましょう。 1. なぜ FX Power がトレーダーにとって非常に有益なのか 通貨と金のリアルタイム強弱分析 • FX Power は主要通貨と金の相対的な強弱を計算し、マーケットダイナミクスに関する明確な洞察を提供します。 • どの資産がリードしているか、または後れを取っているかを監視して、取引するペアを賢く選びましょう。 マルチタイムフレームの包括的なビュー • 短期、中期、長期のタイムフレームで通貨と金の強弱を追跡し、マーケットトレンドに基づいて取引戦略を調整できます。 • スキャルピングからスイングトレード
FX Volume MT5
Daniel Stein
4.82 (17)
FX Volume:ブローカー視点で捉える本物の市場センチメント クイック概要 トレード手法をさらに高めたいとお考えですか? FX Volume は、リテールトレーダーやブローカーのポジション状況をリアルタイムで提供します。これは、COTのような遅延レポートよりもはるかに早く知ることができます。安定した利益を目指す方も、さらなる優位性を求める方も、 FX Volume は大きな不均衡を見極め、ブレイクアウトを確認し、リスク管理を洗練させるのに役立ちます。今すぐ始めて、実際の出来高データがどのように意思決定を変革するかを体感してください! 1. FX Volume がトレーダーにとって非常に有益な理由 高精度の早期警戒シグナル • 各通貨ペアを売買しているトレーダー数を、他者よりも早く、ほぼリアルタイムで把握できます。 • FX Volume は、複数のリテールブローカーから得られる本物の出来高データを収集し、分かりやすい形式で提供する 唯一 のツールです。 強力なリスク管理 • ロングやショートの大きな偏り(インバランス)を特定し、潜在的なトレンド転換を見逃しません。ストップ
FourAverageは、トレンド検出の新しい単語です。 情報技術の発展と多数の参加者に伴い、金融市場は時代遅れの指標による分析にあまり適していなくなっています。 移動平均や確率などの従来のテクニカル分析ツールは、純粋な形でトレンドの方向やその反転を決定することはできません。 1つの指標は、14年の歴史に基づいて、そのパラメータを変更することなく、将来の価格の正しい方向を示すことができますか? 同時に、横向きの市場の動きで妥当性を失うことはありませんか? 答え:はい、それはできます。 私たちのチームは、変化する市場の状況に適応するためのかなり強力で効果的なメカニズムを持つ指標を開発しました。 2025年には、主要なトレンド指標"Four平均"は開発の新しい段階に入っています。 現代の暗号通貨と株式市場は、この指標のために作成されたようです。 独自の平滑化式を使用すると、通貨ペアまたは他の楽器の任意の機能のための指標を調整(パターンを識別)することができます。 さて、利益を上げるためには、1つの指標で十分であり、これはほんの始まりに過ぎません。 他のツールと組み合わせて、または信号フィル
「Entry In The Zone」と「SMC Multi Timeframe」は、スマートマネーコンセプト(SMC)に基づいたリアルタイム市場分析ツールです。このツールは、反転信号を効果的に統合し、マルチタイムフレーム構造検出を通じて主要な反転ゾーンを自動的に識別します。また、注目すべきポイント(POI)の識別も行います。これにより、トレーダーはより自信を持って、より構造化されたアプローチで取引計画を立て、意思決定を行うことができます。 主な機能: 自動市場構造検出(BOS CHoCH、mBOS mCHoCH) オーダーブロック、供給と需要ゾーン、フェアバリューギャップ(FVG)の識別 流動性ゾーン、プレミアムおよびディスカウントエリア、同一高値および同一安値 注目すべき同一高値 & 同一安値イント(POI) 取引セッションのタイミング(東京、ロンドン、ニューヨーク) 独自の取引スタイルに合わせたカスタマイズ可能なダッシュボード リアルタイムでの動作、シグナルの再描画なし。完全なマルチタイムフレームカバレッジで 自信を持った取引決定をサポートします。 *** SMC | スマー
FX Levels: あらゆる市場における非常に高精度なサポート&レジスタンス 概要 通貨ペア、株式指数、個別銘柄やコモディティなど、どのような市場でも信頼できるサポートとレジスタンスを特定したいですか? FX Levels は伝統的な “Lighthouse” メソッドと先進的な動的アプローチを融合し、ほぼ汎用的な精度を実現します。ブローカーの実務経験を活かし、自動化されたデイリー更新とリアルタイム更新を組み合わせることで、 FX Levels は反転ポイントを見つけ、利益目標を設定し、自信をもってトレードを管理するための手助けをします。今すぐ試してみて、サポート/レジスタンス分析の正確性がどれほどトレードを向上させるかを実感してください! 1. FX Levels がトレーダーにとって非常に有用な理由 非常に正確なサポート&レジスタンスゾーン • FX Levels は異なるブローカー環境でもほぼ同一のゾーンを生成するよう設計されており、データフィードの差異や時刻設定のずれによる不一致を解消します。 • つまり、どのブローカーを利用していても一貫したレベルが得られるため、戦
MetaBands M5
Vahidreza Heidar Gholami
4.5 (2)
MetaBandsは、強力でユニークなアルゴリズムを使用してチャンネルを描画し、トレンドを検出して、トレーダーに取引の入出ポイントを提供することができます。チャンネル指標に加えて、強力なトレンド指標でもあります。入力パラメータを使用して新しいチャンネルを作成するために、異なるタイプのチャンネルを統合することができます。MetaBandsは、市場のイベントについてユーザーに通知するために、すべてのタイプのアラートを使用します。 特徴 ほとんどのチャンネルアルゴリズムをサポート 強力なトレンド検出アルゴリズム 異なるタイプのチャンネルを統合する能力 マルチタイムフレームおよびマルチカレンシー(シグナルマトリックス) すべてのタイプのアラート機能(サウンド、画面フラッシャー、プッシュ通知、メール、ポップアップ、矢印) 再描画しない トレンド検出 MetaBandsは、チャネル内を振動する青いラインを使用してトレンドを検出します。ラインがチャネルの上部バンドに達すると、下降トレンドの開始を示し、下部バンドに達すると上昇トレンドの開始を示します。青いラインが中心ラインに近づくと、市場はコンソリ
まず第一に、この取引インジケーターは再描画されず、再描画されず、遅延しないことを強調する価値があります。これにより、手動取引とロボット取引の両方に理想的なものになります。 ユーザーマニュアル:設定、入力、戦略。 アトミックアナリストは、価格の強さとモメンタムを利用して市場でより良いエッジを見つけるためのPA価格アクションインジケーターです。ノイズや誤ったシグナルを除去し、取引ポテンシャルを高めるための高度なフィルターを備えています。複雑なインジケーターの複数のレイヤーを使用して、アトミックアナリストはチャートをスキャンし、複雑な数学的計算をシンプルなシグナルと色に変換します。これにより、どのような初心者トレーダーでも理解して使用し、一貫した取引の決定を行うことができます。 「アトミックアナリスト」は、新規および経験豊富なトレーダー向けにカスタマイズされた包括的な取引ソリューションです。プレミアムインジケーターとトップノッチの機能を1つの取引戦略に組み合わせ、すべてのタイプのトレーダーにとって汎用性のある選択肢にします。 デイリートレーディングとスキャルピング戦略:高速で正確なデイ
まず第一に、この取引ツールはノンリペイント、ノンリドロー、ノンラグの指標であり、プロの取引に理想的ですことを強調する価値があります。 オンラインコース、ユーザーマニュアル、デモ。 スマートプライスアクションコンセプトインジケーターは、新米から経験豊富なトレーダーまで、非常 に強力なツールです。Inner Circle Trader AnalysisやSmart Money Concepts Trading Strategiesなど、20以上の有用な指標を1つに組み合わせています。このインジケーターはスマートマネーコンセプトに焦点を当て、大手機関の取引方法を提供し、彼らの動きを予測するのに役立ちます。 特に、流動性分析に優れており、機関がどのように取引しているかを理解しやすくしています。市場のトレンドを予測し、価格の動きを慎重に分析するのに優れています。機関の戦略とトレードを合わせることで、市場の動向についてより正確な予測ができます。このインジケーターは多目的であり、市場構造を分析し、重要な注文ブロックを特定し、さまざまなパターンを認識するのに優れています。 このインジケーター
MonetTrend — Премиум-индикатор для торговли по тренду (M30, H1, H4) MonetTrend — это мощный и визуально понятный трендовый индикатор, созданный для торговли на таймфреймах M30, H1 и H4. Он идеально подходит для работы с волатильными инструментами, такими как: • Золото (XAUUSD) • Криптовалюты (BTCUSD) • Валютные пары (EURUSD, USDJPY и др.) Ключевые особенности MonetTrend: • Автоматическое отображение Take Profit 1 (TP1) и Stop Loss (SL): После появления сигнала индикатор сразу показывает: • TP
これはほぼ間違いなく、MetaTraderプラットフォームで見つけることができる最も完全な調和価格形成自動認識インジケーターです。 19種類のパターンを検出し、フィボナッチプロジェクションをあなたと同じように真剣に受け止め、潜在的逆転ゾーン(PRZ)を表示し、適切なストップロスとテイクプロフィットレベルを見つけます。 [ インストールガイド | 更新ガイド | トラブルシューティング | よくある質問 | すべての製品 ] 19の異なる調和価格形成を検出します プライマリ、派生および補完フィボナッチ投影(PRZ)をプロットします 過去の価格行動を評価し、過去のすべてのパターンを表示します この指標は、独自の品質とパフォーマンスを分析します 適切なストップロスとテイクプロフィットのレベルを表示します ブレイクアウトを使用して適切な取引を通知します すべてのパターン比をグラフにプロットします 電子メール/音声/視覚アラートを実装します スコット・M・カーニーの本に着想を得て、この指標は最も純粋で急を要するトレーダーのニーズを満たすように設計されています。ただし、トレードを容易にする
トレンド検出インジケーターはあらゆる戦略を補完し、独立したツールとしても使用できます。 インジケーターの操作に関する推奨事項、コメント   #8   でダウンロードできます 利点 使いやすく、不要な情報でチャートを過負荷にしません。 あらゆる戦略のフィルターとして使用できます。 利益を得るのとストップロスを設定するの両方に使用できる動的なサポートとレジスタンスのレベルが組み込まれています。 ローソク足が閉じた後、インジケーターの色は変わりません。  株式市場、指数、石油、金、およびすべての時間枠で機能します。 トースト通知、電子メール通知、プッシュ通知、サウンドアラートの機能があります。 私の他の開発はここで見つけることができます: https://www.mql5.com/ja/users/mechanic/seller 入力パラメータ Alert-オン/オフ。アラート; Push Notification-オン/オフ。プッシュ通知; Mail-オン/オフ電子メール通知; Fibo 1,2,3,4,5,6,7,11,21,31,41,51,61,71-動的サポートと抵抗レベル
IX Power: 指数、商品、暗号資産、外国為替市場の洞察を発見 概要 IX Power は、指数、商品、暗号資産、外国為替市場の強弱を分析するための多用途ツールです。 FX Power が全ての利用可能な通貨ペアデータを活用して外為ペアで最高の精度を提供する一方、 IX Power は基礎資産の市場データにのみ焦点を当てています。この特性により、 IX Power は非外為市場に最適であり、単純な外為分析にも信頼性の高いツールです。どのチャートでもスムーズに機能し、取引判断を向上させるための明確で実行可能な洞察を提供します。 1. IX Power がトレーダーにとって価値がある理由 複数市場での強弱分析 • IX Power は指数、商品、暗号資産、外為シンボルの強弱を計算し、それぞれの市場に合わせた洞察を提供します。 • US30、WTI、ゴールド、ビットコイン、または通貨ペアなどの資産を監視して取引機会を発見できます。 幅広い市場に適応 • 外為取引では、 FX Power が関連する全ての通貨ペアを分析することで比類のない精度を提供します。 • IX Power
ICT, SMC, SMART MONEY CONCEPTS, SMART MONEY, Smart Money Concept, Support and Resistance, Trend Analysis, Price Action, Market Structure, Order Blocks, BOS/CHoCH,   Breaker Blocks ,  Momentum Shift,   Supply&Demand Zone/Order Blocks , Strong Imbalance,   HH/LL/HL/LH,    Fair Value Gap, FVG,  Premium  &   Discount   Zones, Fibonacci Retracement, OTE, Buy Side Liquidity, Sell Side Liquidity, BSL/SSL Taken, Equal Highs & Lows, MTF Dashboard, Multiple Time Frame, BigBar, HTF OB, HTF Market Structure
MONEYTRON – ТВОЙ ЛИЧНЫЙ СИГНАЛ НА УСПЕХ! XAUUSD | AUDUSD | USDJPY | BTCUSD Поддержка таймфреймов: M5, M15, M30, H1 Почему трейдеры выбирают Moneytron? 82% успешных сделок — это не просто цифры, это результат продуманной логики, точного алгоритма и настоящей силы анализа. Автоматические сигналы на вход — не нужно гадать: когда покупать, когда продавать. 3 уровня Take Profit — ты сам выбираешь свой уровень прибыли: безопасный, уверенный или максимум. Четкий Stop Loss — контролируешь риск
FX Dynamic: カスタマイズ可能なATR分析でボラティリティとトレンドを把握 概要 FX Dynamic は平均的な真のレンジ(ATR)の計算を活用して、日次および日中ボラティリティに関する卓越した情報をトレーダーに提供する強力なツールです。80%、100%、130%などのボラティリティ閾値を設定することで、通常の範囲を超えた際にすぐに警告を受け取ったり、有望な利益機会を素早く捉えられます。 FX Dynamic はブローカーのタイムゾーンに合わせて調整でき、安定したボラティリティ測定を維持しながら、リアルタイム分析のためにMetaTraderとシームレスに連携します。 1. なぜFX Dynamicがトレーダーにとって非常に有益か リアルタイムのATRインサイト • 日次・日中のボラティリティをひと目で把握。価格がATRの80%、100%、130%などに達したときに警告を受け取り、重要な水準にあるかどうかを確認できます。 • ボラティリティが完全に爆発する前に潜在的な反転やブレイクアウトを先取り可能。 幅広いマーケットへの適用 • 外国為替、コモディティ、株価指数な
Special offer : ALL TOOLS , just $35 each! New tools   will be   $30   for the   first week   or the   first 3 purchases !  Trading Tools Channel on MQL5 : Join my MQL5 channel to update the latest news from me ICTの 反転フェアバリューギャップ (IFVG) の概念を活用した Inversion Fair Value Gaps Indicator でその力を解放しましょう!この最新ツールは、フェアバリューギャップ (FVG) を次のレベルに引き上げ、反転したFVGゾーンを特定して表示します。これらは、価格修正後に形成される重要なサポートおよびレジスタンスエリアです。スキャルパー、スイングトレーダー、長期投資家のいずれであっても、IFVGインジケーターはリアルタイムでの意思決定にとって貴重な洞察を提供します。 MT4バージョンはこちら:  Inversion Fair Val
Was: $299  Now: $149  Supply Demand uses previous price action to identify potential imbalances between buyers and sellers. The key is to identify the better odds zones, not just the untouched ones. Blahtech Supply Demand indicator delivers functionality previously unavailable on any trading platform. This 4-in-1 indicator not only highlights the higher probability zones using a multi-criteria strength engine, but also combines it with multi-timeframe trend analysis, previously confirmed swings
このダッシュボードは、選択されたシンボルの最新の利用可能なハーモニックパターンを表示するので、時間を節約し、より効率的に /   MT4バージョン 。 無料インジケーター:   Basic Harmonic Pattern インジケーター列 Symbol : 選択したシンボルが表示されます。 Trend :   強気または弱気 Pattern : パターンの種類(ガートレー、バタフライ、バット、カニ、サメ、サイファー、ABCD) Entry : エントリー価格 SL: ストップロス価格 TP1: 1回目の利食い価格 TP2: 2回目の利食い価格 TP3:   3回目の利食い価格 Current price :   現在値 Age (in bars):    最後に描画されたパターンの年齢 主な入力項目 Symbols:   "28 Major Currency Pairs "または "Selected Symbols "から選択。 Selected Symbols:   カンマで区切られた監視したいシンボル("EURUSD,GBPUSD,XAUUSD")。ブローカーがペアに接
まず第一に、このトレーディングシステムがノンリペイント、ノンリドロー、ノンラグのインジケーターであることを強調する価値がある。これにより、手動取引とロボット取引の両方に理想的なものになっています。 オンラインコース、マニュアル、プリセットのダウンロード。 「スマートトレンドトレーディングシステム MT5」は、新規および経験豊富なトレーダー向けにカスタマイズされた包括的なトレーディングソリューションです。10以上のプレミアムインジケーターを組み合わせ、7つ以上の堅実なトレーディング戦略を備えており、多様な市場状況に対応する多目的な選択肢となっています。 トレンドフォロー戦略:トレンドを効果的に乗り越えるための正確なエントリーとストップロス管理を提供します。 リバーサル戦略:潜在的なトレンドの反転を特定し、トレーダーがレンジ相場を活用できるようにします。 スキャルピング戦略:高速で正確なデイトレードおよび短期取引のために設計されています。 安定性:すべてのインジケーターはノンリペイント、ノンリドロー、ノンラグであり、信頼性の高いシグナルを保証します。 カスタマイズ:個々の取引の嗜好に合わせ
作者のその他のプロダクト
If you love this indicator, please leave a positive rating and comment, it will be a source of motivation to help me create more products <3 Key Takeaways VWAP is a trading benchmark that typically is most useful to short-term traders. VWAP is used in different ways by traders  . Traders may use it as   a trend confirmation tool   and build trading rules around it. Also, If prices below VWAP and move above it, c an be used by traders as a sell signal. If prices above VWAP and move below it,  ca
FREE
If you love this indicator, please leave a positive rating and comment, it will be a source of motivation to help me create more products <3 Key Takeaways The Zig Zag  Advanced   indicator plot points on a chart whenever prices reverse by the percentage the trader sets in the input section. The Zig Zag Advanced indicator lowers the impact of random price fluctuations and is used to identify trends and changes in trends. The indicator lowers noise levels, highlighting trends higher and lower. Th
FREE
If you love this indicator, please leave a positive rating and comment, it will be a source of motivation to help me create more products <3 How to use SuperTrend? When the price crosses above the supertrend line it signals a buy signal and when the price crosses below the supertrend line it signals a sell signal. The supertrend indicator which acts as a dynamic level of support or resistance and helps traders make informed decisions about entry and exit points.  When prices are above s upertre
FREE
If you love this indicator, please leave a positive rating and comment, it will be a source of motivation to help me create more products <3 How to use QQE? Determine trend when RSI MA ​​above 50 indicate a bullish market, while RSI MA ​​below 50 indicate a bearish market and   can server as a trend filter. Identify short-term up/down momentum, when the RSI MA crosses up Smoothed signals bullish momentum, and when the RSI MA crosses down Smoothed signals bearish momentum. It is also possible to
FREE
If you love this indicator, please leave a positive rating and comment, it will be a source of motivation to help me create more products <3 How to use Gann High-Low Activator? The Gann HiLo Activator helps the trader identify the current trend of the market. When the indicator is below the closing price, it can indicate that an uptrend is taking place. Conversely, when the indicator is above the closing price, it can indicate a downtrend. The Gann HiLo Activator also generates buy and sell sig
FREE
If you love this indicator, please leave a positive rating and comment, it will be a source of motivation to help me create more products <3 How to use Aroon Indicator? The AroonUp and the AroonDown measure the strength of the uptrend and the strength of the downtrend, respectively. These lines fluctuate between zero and 100. Values close to 100 indicate a strong trend and values near zero indicate a weak trend where the lower the AroonUp, the weaker the uptrend and the stronger the downtrend,
FREE
If you love this indicator, please leave a positive rating and comment, it will be a source of motivation to help me create more products <3 What is  Schaff Trend Cycle indicator? The Schaff Trend Cycle (STC) is a technical analysis indicator used in trading and investing to identify trends and generate trading signals. The STC is designed to identify trends and trend reversals by measuring the strength of the trend and the speed of price changes. The STC indicator helps to identify trends in a
FREE
Key Takeaways This timer does not lag like other timer indicators Show the time end of candlesticks and spread Hide or Show Spread depending on user needs Works on all timeframes Adjust Text Size Adjust Text Color Adjust Text Font  If you love this indicator, please leave a positive rating and comment, it will be a source of motivation to help me create more products <3
FREE
If you love this indicator, please leave a positive rating and comment, it will be a source of motivation to help me create more products <3 Key Takeaways Bulls Bears Eyes is another version of Laguerre RSI. Use Bull/Bear Power to calculate. One use of the  Bulls Bears Eyes is to identify trends. This is done by looking for sustained periods when the indicator is above or below the 0.5 line. Also, a buy signal is generated when the   Bulls Bears Eyes line crosses above the 0.15 level, while a s
FREE
If you love this indicator, please leave a positive rating and comment, it will be a source of motivation to help me create more products <3 Key Takeaways Fisher is a repaint indicator. It recalculates previous bars when new bars become available. Modified to avoid repainting to accommodate some merchants. Fisher indicator is quite a simple histogram indicator that detects the trend's direction and strength and signals about trend changes. Traders look for extreme readings to signal potential p
FREE
If you love this indicator, please leave a positive rating and comment, it will be a source of motivation to help me create more products <3 How to use  Slope Direction Line Uptrend: When the SDL line slopes up and turns from red to green, it shows that the price is trending up. This is also considered a buy signal. Downtrend: When the SDL line slopes down and turns from green to red, it shows that the price is trending down. This is also considered a sell signal. Sideways: When the SDL line mo
FREE
Introducing the Sniper EURJPY Sniper EURJPY is a strategy specifically designed for the EURJPY pair.  It utilizes advanced technical analysis to find entry points. Sniper EURJPY is using a ratio of 1:2 with this ratio you only need to have a win rate of over 33% to make a profit. Sniper EURJPY is very suitable for traders who like safety and sustainability. Key Features: NO   Grid and   NO   martingale Risk and Reward: 1:2  gives you a long-term advantage in the market. Trailingstops:  Helps you
FREE
Introducing the Sniper AUDUSD Trading Strategy Sniper AUDUSD is a highly accurate forex trading strategy specifically designed for the AUD/USD currency pair. It leverages advanced technical analysis to identify high-probability entry points, aiming to maximize profits while minimizing risk.  The Sniper AUDUSD strategy uses complex algorithms to analyze and identify trends to generate highly accurate buy and sell signals. Once the signal is activated, the system will automatically execute trades
FREE
フィルタ:
1001035938
245
1001035938 2025.04.08 17:27 
 

Muito bom indicador ! Parabéns ao desenvolvedor!

AHMED NOUR ELDEEN
700
AHMED NOUR ELDEEN 2024.12.24 16:51 
 

A valuable tool for trend and reversal analysis but should be used with complementary indicators to avoid false signals.

レビューに返信
バージョン 1.1 2024.12.17
Fix bugs