• 概要
  • レビュー
  • コメント
  • 最新情報

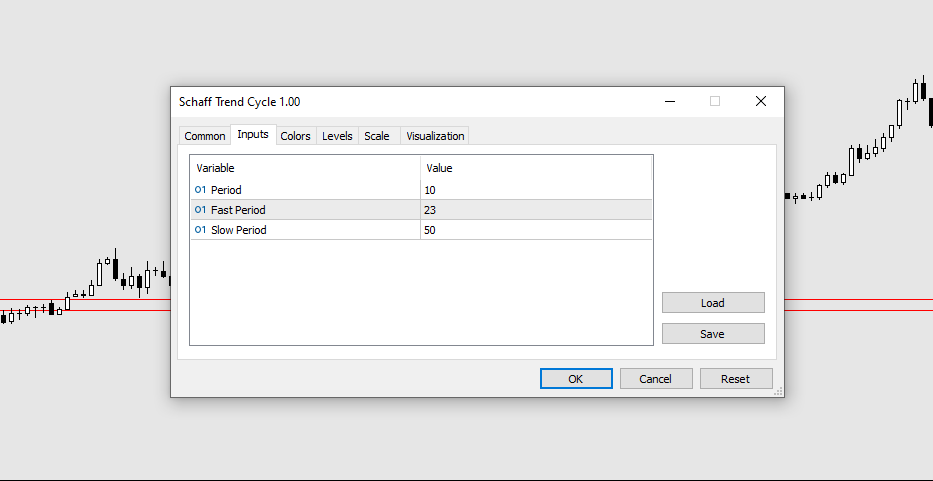
Schaff Trend Cycle MT5

If you love this indicator, please leave a positive rating and comment, it will be a source of motivation to help me create more products <3

What is Schaff Trend Cycle indicator?

  1. The Schaff Trend Cycle (STC) is a technical analysis indicator used in trading and investing to identify trends and generate trading signals.
  2. The STC is designed to identify trends and trend reversals by measuring the strength of the trend and the speed of price changes.
  3. The STC indicator helps to identify trends in a smoother and more responsive manner compared to traditional MAs and even under certain parameters.

    How to use Schaff Trend Cycle indicator?

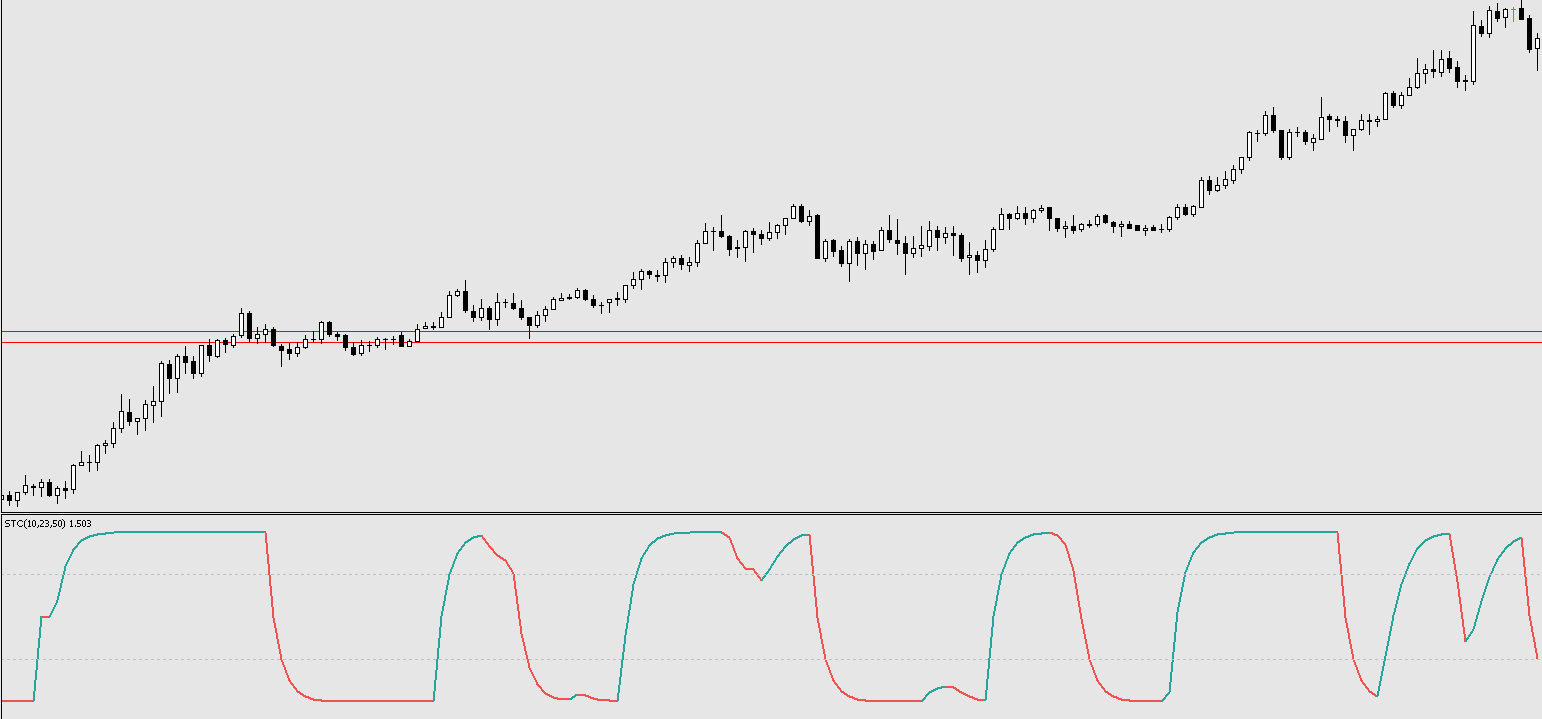
    1. One use of the STC is to identify trends. This is done by looking for sustained periods when the indicator is above or below the zero line.
    2. Another use of the STC is to identify overbought and oversold conditions. This is done by observing periods when the indicator is above or below the 25 and 75 levels. An STC line that is above the 75 level indicates an overbought condition, while an STC line that is below the 25 level indicates an oversold condition.
    3. Also, a buy signal is generated when the STC line crosses above the zero line or the 25 level, while a sell signal is generated when the STC line crosses below the zero line or the 75 level.

    It is important to note that the STC indicator is not perfect and it can sometimes produce false signals. This indicator should be used in conjunction with other technical analysis indicators to confirm any signals it generates.

      おすすめのプロダクト
      Best SAR MT5
      Ashkan Hazegh Nikrou
      4.33 (3)
      説明 :  外国為替市場(PSAR)で専門的で人気のあるインジケーターの1つに基づいた新しい無料インジケーターをご紹介します。このインジケーターは元のパラボリックSARインジケーターの新しい変更です。プロSARインジケーターでは、ドットと価格チャートのクロスオーバーを見ることができます。クロスオーバーはシグナルではありませんが、動きの終わりの可能性について話します。新しい青いドットで購入を開始し、最初の青いドットの1 atr前にストップロスを配置し、最後にドットが価格チャートを横切るとすぐに終了できます。 売買シグナルを開く方法は? 最初の青い点によるオープンバイトレードと最初の赤いドットによるオープンセルトレード 正しいストップロスはどこにありますか? 安全なストップロスは最初のドットにある可能性があります(最初の青いドットの買いの場合と最初の赤い点の売りの場合) 正しいテイクプロフィットはどこにありますか? テイクプロフィットはストップロス距離とRRに基づいて調整できるので、私の提案は2 RRで、ストップロスの2倍です。 利益を上げているのにtpを達成できなかった場合
      FREE
      Order Book, known also as Market Book, market depth, Level 2, - is a dynamically updated table with current volumes of orders to buy and to sell specific financial instument at price levels near Bid and Ask. MetaTrader 5 provides the means for receiving market book from your broker, but in real time only, without access to its history. The indicator OrderBook Cumulative Indicator accumulates market book data online and visualizes them on the chart. In addition, the indicator can show the market
      トレンドキャッチャー: アラートインジケーター付きのトレンドキャッチャーストラテジーは、市場トレンドやポテンシャルなエントリーポイントやエグジットポイントを特定するのに役立つ多目的な技術分析ツールです。動的なトレンドキャッチャーストラテジーを備えており、市場状況に適応してトレンドの方向を明確に視覚化します。トレーダーは、自身の好みやリスク許容度に合わせてパラメーターをカスタマイズできます。このインジケーターはトレンドの識別を支援し、ポテンシャルなリバーサルをシグナルし、トレイリングストップのメカニズムとして機能し、市場への迅速な対応のためのリアルタイムアラートを提供します。 特徴: - トレンドの識別:上昇トレンドと下降トレンドをシグナルします。 - トレンドのリバーサル:ローソク足の色が上昇から下降に変わった場合やその逆の場合に、ポテンシャルなリバーサルを警告します。 - リアルタイムアラート:新しいトレンドの識別に対するアラートを生成します。 推奨事項: - 通貨ペア:EURUSD、AUDUSD、XAUUSDなど... - タイムフレーム:H1。 - アカウントタイプ:
      FREE
      The Magic SMA indicator is of great help in determining trend direction. It can be an excellent addition to your existing strategy or the basis of a new one. We humans can make better decisions when we see better visually. So we designed it to show a different color for rising and falling trends. Everyone can customize this in the way that suits them best. By setting the Trend Period, we can optimize it for longer or shorter trends for our strategy. It is great for all time frames. IF YOU NEED
      FREE
      Indicator and Expert Adviser  EA Available in the comments section of this product. Download with Indicator must have indicator installed for EA to work. Mt5 indicator alerts for bollinger band and envelope extremes occurring at the same time. Buy signal alerts occur when A bullish candle has formed below both the lower bollinger band and the lower envelope  Bar must open and close below both these indicators. Sell signal occur when A bear bar is formed above the upper bollinger band and upper
      FREE
      This indicator is especially for the binary trading. Time frame is 1 minutes and exp time 5 or 3 minutes only. You must be use martingale 3 step. So you must put lots size is 10 % at most. You should use Mt2 trading platform to connect with my indicator to get more signal without human working. This indicator wining rate is over 80% but you may get 100% of profit by using martingale 3 step. You should use MT2 Trading Platform to connect meta trader platform and binary platform . You can get mt2
      FREE
      Free automatic Fibonacci is an indicator that automatically plots a Fibonacci retracement based on the number of bars you select on the BarsToScan setting in the indicator. The Fibonacci is automatically updated in real time as new highest and lowest values appears amongst the selected bars. You can select which level values to be displayed in the indicator settings. You can also select the color of the levels thus enabling the trader to be able to attach the indicator several times with differe
      FREE
      Follow The Line MT5
      Oliver Gideon Amofa Appiah
      4.52 (29)
      This indicator obeys the popular maxim that: "THE TREND IS YOUR FRIEND" It paints a GREEN line for BUY and also paints a RED line for SELL. (you can change the colors). It gives alarms and alerts of all kinds. IT DOES NOT REPAINT and can be used for all currency pairs and timeframes. Yes, as easy and simple as that. Even a newbie can use it to make great and reliable trades. NB: For best results, get my other premium indicators for more powerful and reliable signals. Get them here: https://www.m
      FREE
      Donchian Channel DC is the indicator of Donchian Channels, that plots maximum and minimum values of a specific period, besides mean value line. It´s possible to configure simple period for analysis and the indicator will plot all three values. You can trade with this indicator as trend or reversal, according to each strategy. Do not let to test others indicators as soon as others expert advisors.
      Easy GOLD MT5
      Franck Martin
      4 (33)
      Easy Gold is the latest addition to the BotGPT family. It is surprising and very powerful. It is ideal for beginners due to its simplicity.  There is absolutely nothing to do, it's 100% automated, simply indicate the percentage of risk you want to take per trade and the EA is ready. Whatever your capital, the EA takes care of everything. Optimized on (XAUUSD).  Unleash all the power with the professional version (AGI Gold) and its connection to the neural network, available in my store. My othe
      FREE
      Important Lines
      Terence Gronowski
      4.86 (21)
      This indicator displays Pivot-Lines, preday high and low, preday close and the minimum and maximum of the previous hour. You just have to put this single indicator to the chart to have all these important lines, no need to setup many single indicators. Why certain lines are important Preday high and low : These are watched by traders who trade in a daily chart. Very often, if price climbs over or falls under a preday low/high there is an acceleration in buying/selling. It is a breakout out of a
      FREE
      インジケーター   "Haven Key Levels PDH PDL"   は、トレーダーがチャート上の重要なレベルを視覚化するのを支援します。次のレベルを自動的にマークします: DO (Daily Open)   — 日の開始レベル。 NYM (New York Midnight)   — ニューヨークの真夜中レベル。 PDH (Previous Day High)   — 前日の最高値。 PDL (Previous Day Low)   — 前日の最安値。 WO (Weekly Open)   — 週の開始レベル。 MO (Monthly Open)   — 月の開始レベル。 PWH (Previous Week High)   — 前週の最高値。 PWL (Previous Week Low)   — 前週の最安値。 その他の製品 ->  ここ ツールのカスタマイズオプション: 色とラインの太さの選択: レベルの色設定:   NYM, DO, WO, MO, PDH, PDL, PWH, PWL. ラインの太さの調整。 レベルの表示制御: レベルのライン表示のオン/オフ:
      FREE
      RSI abcd
      Francisco Gomes Da Silva
      RSI ABCDパターンファインダー:テクニカル戦略 1. インジケーターの仕組み 古典的RSI と ABCD調和パターン の自動検出を組み合わせたものです。 主要コンポーネント 標準RSI (調整可能な期間) 高値・安値マーカー (矢印) ABCDパターン (緑/赤の線) 過買(70)・過売(30)フィルター 2. MT5設定 period = 14 ; // RSI期間 size = 4 ; // 最大パターンサイズ OverBought = 70 ; // 過買水準 OverSold = 30 ; // 過売水準 Filter = USE_FILTER_ YES ; // 確認フィルター 3. 取引戦略 3.1. 買いエントリー(強気ABCD) 条件: RSIが以下を形成: 谷( A )→ 山( B )→ より高い谷( C ) D が過売域(30)より上だが C より下 確認:A-B-C-Dを結ぶ緑色の線 目標: TP1: B-Cの61.8% TP2: B-Cの100% ストップロス: D より下 3.2. 売りエントリー(弱気ABCD) 条件: RSIが以下を形成: 山( A
      FREE
      Necessary for traders: tools and indicators Waves automatically calculate indicators, channel trend trading Perfect trend-wave automatic calculation channel calculation , MT4 Perfect trend-wave automatic calculation channel calculation , MT5 Local Trading copying Easy And Fast Copy , MT4 Easy And Fast Copy , MT5 Local Trading copying For DEMO Easy And Fast Copy , MT4 DEMO Easy And Fast Copy , MT5 DEMO Can set the cycle for other varieties of K line graph covered this window, fluctuations obser
      FREE
      Do you, like me, like to trade with the trend? Then this indicator will help you! Rainbow Trend is a trend indicator, which uses several Moving Averages on the chart. It measures different trend strenght zones for different periods: very long term, long term, mid term, short term and very short term. Each zone has its color, and it is possible to have sound alert when the prices leaves a zone and enters another. Its configuration is very simple. If you find any bug or have any suggestions, conta
      Necessary for traders: tools and indicators Waves automatically calculate indicators, channel trend trading Perfect trend-wave automatic calculation channel calculation , MT4 Perfect trend-wave automatic calculation channel calculation , MT5 Local Trading copying Easy And Fast Copy , MT4 Easy And Fast Copy , MT5 Local Trading copying For DEMO Easy And Fast Copy , MT4 DEMO Easy And Fast Copy , MT5 DEMO 高度なボリンジャーバンド: 1.ボリンジャーレールは方向によって色が変わります」 2.ボリンジャーアウターレールの伸縮はアウターレールの色の変化でマークされます。」 3.ボリンジャーミ
      FREE
      インディケータは現在のクオートを作成し、これを過去のものと比較して、これに基づいて価格変動予測を行います。インジケータには、目的の日付にすばやく移動するためのテキスト フィールドがあります。 オプション: シンボル - インジケーターが表示するシンボルの選択; SymbolPeriod - 指標がデータを取る期間の選択; IndicatorColor - インジケータの色; HorisontalShift - 指定されたバー数だけインディケータによって描画されたクオートのシフト; Inverse - true は引用符を逆にします。false - 元のビュー。 ChartVerticalShiftStep - チャートを垂直方向にシフトします (キーボードの上下矢印)。 次は日付を入力できるテキストフィールドの設定で、「Enter」を押すとすぐにジャンプできます。
      Tops & Bottoms Indicator FREE   Tops abd Bottoms:   An effective indicator for your trades The tops and bottoms indicator helps you to find  ascending and descending channel formations with indications of ascending and/or descending tops and bottoms. In addition, it  show possibles  opportunities with a small yellow circle when the indicator encounters an impulse formation. This indicator provide to you  more security and speed in making entry decisions. Also test our FREE advisor indicator:  
      FREE
      Tired of adjusting the indicator settings losing precious time? Tired of the uncertainty regarding their efficiency? Afraid of the uncertainty in their profitability? Then the indicator ACI (automatically calibrateable indicator) is designed exactly for you. Launching it, you can easily solve these three issues just performing the simplest action: clicking a single Calibrate button. To achieve the highest efficiency, you should perform another additional action: move the power slider to the maxi
      FREE
      The indicator highlights the points that a professional trader sees in ordinary indicators. VisualVol visually displays different volatility indicators on a single scale and a common align. Highlights the excess of volume indicators in color. At the same time, Tick and Real Volume, Actual range, ATR, candle size and return (open-close difference) can be displayed. Thanks to VisualVol, you will see the market periods and the right time for different trading operations. This version is intended f
      FREE
      This indicator calculates the volume profile and places labels that correspond to the VAH, VAL and POC levels, for each candle individually. Indicator operation features The indicator works on the timeframes from M3 to MN, but it uses the history data of smaller periods: M1 - for periods from M3 to H1, M5 - for periods from H2 to H12, M30 - for the D1 period, H4 - for the W1 period, D1 - for the MN period. The color and location of the VAL, VAH and POC labels on the current candle are considere
      FREE
      Bounce Zone MT5
      Nguyen Thanh Cong
      4.43 (7)
      Introduction The Bounce Zone indicator is a cutting-edge non-repainting technical tool built to identify key areas on the price chart where market sentiment is likely to cause a significant price reversal. Using advanced algorithms and historical price data analysis, this indicator pinpoints potential bounce zones. Combined with other entry signal, this indicator can help forex traders place the best trades possible Signal A possible buy signal is generated when price is in the green zone an
      FREE
      平均足(ヘイキンアシ)MT5インジケーター 平均足(ヘイキンアシ)MT5インジケーターは、標準的な価格データをより滑らかでトレンドに沿ったローソク足に変換し、市場トレンドや潜在的な反転ポイントをより簡単に識別できるようにする強力なツールです。 主な特徴: 明確なトレンド識別: 異なるローソク足の色で上昇トレンドと下降トレンドを視覚的に区別します。 ノイズの低減: 価格変動をフィルタリングし、 市場の主要な動きをより明確に表示します。 早期トレンド検出: 標準チャートでトレンドの変化が明らかになる前に、 潜在的なトレンド変化を予測します。 汎用性: 単独で使用することも、 他のテクニカル指標と組み合わせて総合的な分析を行うこともできます。 カスタマイズ可能な設定: インジケーターを特定の取引設定や戦略に合わせて調整できます。 メリット: トレンドを特定し、 潜在的なエントリーポイントと出口ポイントを識別する能力を向上させます。 市場ノイズの影響を減らし、 重要な価格変動に集中します。 市場ダイナミクスをより明確に理解することで、 より情報に基づいた取引決定を行うことができます。 検証済
      FREE
      The indicator analyzes the volume scale and splits it into two components - seller volumes and buyer volumes, and also calculates the delta and cumulative delta. The indicator does not flicker or redraw, its calculation and plotting are performed fairly quickly, while using the data from the smaller (relative to the current) periods. The indicator operation modes can be switched using the Mode input variable: Buy - display only the buyer volumes. Sell - display only the seller volumes. BuySell -
      FREE
      About the indicator: DALA Forecast is a universal tool for predicting the dynamics of time series of any nature. For prediction, modified methods of nonlinear dynamics analysis are used, on the basis of which a predictive model is built using machine learning methods.  To get the trial version of the indicator, you can contact me in private messages. How to use the indicator: Apply the indicator to your chosen financial instrument or indicator with the settings you need. The prediction will be
      FREE
      Necessary for traders: tools and indicators Waves automatically calculate indicators, channel trend trading Perfect trend-wave automatic calculation channel calculation , MT4 Perfect trend-wave automatic calculation channel calculation , MT5 Local Trading copying Easy And Fast Copy , MT4 Easy And Fast Copy , MT5 Local Trading copying For DEMO Easy And Fast Copy , MT4 DEMO Easy And Fast Copy , MT5 DEMO The homeopathic indicator is also called the CCI indicator. The CCI indicator was proposed
      FREE
      Market Maker X Model Indicator MMXM MT5 The Market Maker X Model Indicator (MMXM) is a strategic trading tool designed to detect price movement patterns and trend reversals. This indicator analyzes market flow, tracking the interaction between buyers and sellers to help traders understand liquidity shifts and key price zones more effectively. «Indicator Installation & User Guide» MT5 Indicator Installation  |  Market Maker X Model mmxm ICT MT4  | ALL Products By   TradingFinderLab  | Best MT5 In
      FREE
      Point Black
      Ignacio Agustin Mene Franco
      Black Card Pack indicator 5/1 point black It has the strategy of professional bollingers where each arrow gives you a different entry signal. It is used to operate in m1 and in d1 It is used for scalping and intraday, modified for forex markets ! suitable for all pairs modified for synthetic index markets suitable for all pairs! Ideal for volatility and jumps!
      Introducing   Order Blocks Breaker , a brand-new way to identify and leverage order blocks in your trading strategy. After developing multiple order block tools with unique concepts, I’m proud to present this tool that takes things to the next level. Unlike previous tools,   Order Blocks Breaker   not only identifies order blocks but also highlights   Breaker Order Blocks —key areas where the price is likely to retest after a breakout. MT4 -  https://www.mql5.com/en/market/product/124101/ This t
      The indicator identifies when a divergence occurs between price and an indicator or oscillator. It identifies both regular and hidden divergences. Combined with your own rules and techniques, this indicator will allow you to create (or enhance) your own powerful system. Features Can detect divergences for the following oscillators/indicators:   MACD, OsMA, Stochastics, RSI, CCI, RVI, Awesome, ADX, ATR, OBV, Composite index, MFI and Momentum. Only one oscillator/indicator can be selected. Draws
      FREE
      このプロダクトを購入した人は以下も購入しています
      トレンド スクリーナー インジケーターでトレンド取引の力を解き放ちます。ファジー ロジックと複数通貨システムを活用した究極のトレンド取引ソリューションです。 ファジー ロジックを活用した革新的なトレンド インジケーターである Trend Screener を使用して、トレンド取引を向上させます。 これは、13 を超えるプレミアム ツールと機能、および 3 つの取引戦略を組み合わせた強力なトレンド追跡インジケーターであり、Metatrader をトレンド アナライザーにする多用途の選択肢となります。 期間限定オファー : トレンド スクリーナー インジケーターは、わずか 100 ドルで生涯ご利用いただけます。 (元の価格 50$ ) (オファー延長) Trend Screener の 100% 非再描画精度の揺るぎない精度を体験して、取引の決定が過去の価格変動の影響を受けないようにしてください。 マルチタイムフレームおよびマルチ通貨機能の多用途性を解放し、比類のない自信を持って外国為替、商品、暗号通貨、インデックスの世界を取引できるようにします。 Trend Screener の包括的な
      PUMPING STATION – あなた専用の「オールインワン」戦略 PUMPING STATIONは、あなたのトレードをより楽しく、そして効果的に変えてくれる革新的なFXインジケーターです。ただの補助ツールではなく、強力なアルゴリズムを備えた本格的なトレーディングシステムで、より安定したトレードのスタートをサポートします。 この商品をご購入いただくと、以下の特典を無料でお付けします: 専用セットファイル:自動設定による最大パフォーマンスを実現。 ステップバイステップのビデオマニュアル:PUMPING STATION戦略の使い方を学べます。 Pumping Utility:PUMPING STATION専用の半自動トレードボットで、より快適かつシンプルな運用を可能にします。 ※ご購入後すぐにご連絡ください。追加リソースへのアクセスを提供いたします。 PUMPING STATIONの仕組み: トレンド管理:市場のトレンド方向を即座に判断。トレンドはあなたの最高の味方です。 エントリーサイン:チャート上の矢印で、取引のタイミングと方向を明確に示します。 明確な目標設定:インジケーターが自
      Golden Trend Indicator MT5
      Noha Mohamed Fathy Younes Badr
      4.89 (18)
      Golden Trend indicator  is The best indicator for predicting trend movement this indicator never lags and never repaints and never back paints    and give  arrow buy and sell    before the candle appear  and it will help you and  will make your trading decisions clearer its work on all currencies and  gold and crypto and all time frame This unique  indicator uses very secret algorithms to catch the  trends, so you can trade using this indicator and see the trend clear on charts  manual guide and
      このインジケーターを購入された方には、以下の特典を 無料 で提供しています: 各トレードを自動で管理し、ストップロスとテイクプロフィットを設定し、戦略ルールに基づいてポジションを決済する補助ツール 「Bomber Utility」 様々な銘柄に合わせたインジケーターの設定ファイル(セットファイル) 「最小リスク」、「バランスリスク」、「待機戦略」 の3つのモードで使用できる Bomber Utility 用の設定ファイル このトレーディング戦略をすぐに導入・設定・開始できる ステップバイステップのビデオマニュアル ご注意: 上記の特典を受け取るには、MQL5のプライベートメッセージシステムを通じて販売者にご連絡ください。 オリジナルのカスタムインジケーター 「Divergence Bomber(ダイバージェンス・ボンバー)」 をご紹介します。これは、MACDのダイバージェンス(乖離)戦略に基づいた 「オールインワン」型のトレーディングシステム です。 このテクニカルインジケーターの主な目的は、価格とMACDインジケーターの間に発生するダイバージェンスを検出 し、将来の価格の動きを示す
      サポートとレジスタンススクリーナーは、1つのインジケーター内に複数のツールを提供するMetaTraderの1つのレベルインジケーターにあります。 利用可能なツールは次のとおりです。 1.市場構造スクリーナー。 2.強気のプルバックゾーン。 3.弱気プルバックゾーン。 4.デイリーピボットポイント 5.毎週のピボットポイント 6.毎月のピボットポイント 7.ハーモニックパターンとボリュームに基づく強力なサポートとレジスタンス。 8.銀行レベルのゾーン。 期間限定オファー:HVサポートおよびレジスタンスインジケーターは、50ドルと生涯でのみご利用いただけます。 (元の価格125 $) MQL5ブログにアクセスすると、分析例を含むすべてのプレミアム指標を見つけることができます。 ここをクリックしてください。 主な機能 ハーモニックおよびボリュームアルゴリズムに基づく強力なサポートおよびレジスタンスゾーン。 ハーモニックおよびボリュームアルゴリズムに基づく強気および弱気のプルバックゾーン。  市場構造スクリーナー 毎日、毎週、毎月のピボットポイント。 ドキュメント すべてのサポートおよび
      反転ゾーン / ピークボリューム / 主要プレーヤーのアクティブゾーン =       TS TPSプロシステム 説明書 RUS       /       説明書     英語     /           バージョン MT4        このインジケーターを購入したすべての購入者は、さらに以下を無料で受け取ります: RFI SIGNALS サービスからの取引シグナルへの 6 か月間のアクセス - TPSproSYSTEM アルゴリズムに従った既製のエントリ ポイント。 定期的に更新されるトレーニング資料 - 戦略に没頭し、プロフェッショナル レベルを高めます。 平日は 24 時間 365 日サポート、非公開のトレーダー チャットへのアクセス - コミュニケーション、サポート、市場状況の分析。 著者の設定ファイル - 余分な労力をかけずに最大の結果を達成するための自動インジケーター設定。 主な機能: 売り手と買い手のアクティブなゾーンを表示します。 このインジケーターは、購入と販売の正しい最初のインパルス レベル/ゾーンをすべて表示します。これらのレベル/ゾーンがアクティブに
      今、147ドル(いくつかの更新後に499ドルに増加します) - 無制限のアカウント(PCSまたはMac) RelicusRoad ユーザー マニュアル + トレーニング ビデオ + プライベート Discord グループへのアクセス + VIP ステータス 市場の新しい見方 RelicusRoad は、外国為替、先物、暗号通貨、株式、および指数の世界で最も強力な取引インジケーターであり、トレーダーに収益を維持するために必要なすべての情報とツールを提供します。初心者から上級者まで、すべてのトレーダーが成功するためのテクニカル分析と取引計画を提供します。これは、将来の市場を予測するのに十分な情報を提供する重要な取引指標です。意味をなさないチャート上のいくつかの異なる指標ではなく、完全な解決策を信じています.これは、信号、矢印 + 価格アクション情報を表示するオールインワンのインジケーターで、他に類を見ない非常に正確です。 強力な AI に基づいて、RelicusRoad は不足している情報とツールを提供して、あなたを教育し、トレーディングのプロ、成功したトレーダーにします。 ほと
      FX Volume MT5
      Daniel Stein
      4.82 (17)
      FX Volume:ブローカー視点で捉える本物の市場センチメント クイック概要 トレード手法をさらに高めたいとお考えですか? FX Volume は、リテールトレーダーやブローカーのポジション状況をリアルタイムで提供します。これは、COTのような遅延レポートよりもはるかに早く知ることができます。安定した利益を目指す方も、さらなる優位性を求める方も、 FX Volume は大きな不均衡を見極め、ブレイクアウトを確認し、リスク管理を洗練させるのに役立ちます。今すぐ始めて、実際の出来高データがどのように意思決定を変革するかを体感してください! 1. FX Volume がトレーダーにとって非常に有益な理由 高精度の早期警戒シグナル • 各通貨ペアを売買しているトレーダー数を、他者よりも早く、ほぼリアルタイムで把握できます。 • FX Volume は、複数のリテールブローカーから得られる本物の出来高データを収集し、分かりやすい形式で提供する 唯一 のツールです。 強力なリスク管理 • ロングやショートの大きな偏り(インバランス)を特定し、潜在的なトレンド転換を見逃しません。ストップ
      MetaForecast M5
      Vahidreza Heidar Gholami
      5 (3)
      MetaForecastは、価格データのハーモニクスに基づいて、どんな市場の未来を予測し視覚化します。市場が常に予測可能ではありませんが、価格にパターンがある場合、MetaForecastは可能な限り正確な未来を予測できます。他の類似製品と比較して、MetaForecastは市場のトレンドを分析することでより正確な結果を生成することができます。 入力パラメータ Past size (過去のサイズ) MetaForecastが将来の予測を生成するために使用するバーの数を指定します。モデルは選択したバー上に描かれた黄色の線で表されます。 Future size (将来のサイズ) 予測すべき将来のバーの数を指定します。予測された将来は、ピンクの線で表示され、その上に青い回帰線が描かれます。 Degree (程度) この入力は、MetaForecastが市場で行う分析のレベルを決定します。 Degree 説明  0 Degree 0の場合、価格の全てのピークや谷、そして詳細をカバーするために、「Past size」の入力に大きな値を使用することが推奨されています。  1 (推奨) Degre
      Gold Stuff mt5
      Vasiliy Strukov
      4.93 (178)
      Gold Stuff mt5 は、金専用に設計されたトレンド指標であり、あらゆる金融商品にも使用できます。 インジケーターは再描画せず、遅れません。 推奨時間枠 H1. 設定と個人的なボーナスを得るために、購入後すぐに私に連絡してください!  トレンド スキャナーの強力なサポートを利用して、無料のインジケーターを入手し、プライバシーを守ります。あーみー!   設定 矢印を描く - オンオフ。 チャートに矢印を描く。 アラート - 可聴アラートのオンオフ。 メール通知 - オンオフ。 電子メール通知。 プチ通知 - オンオフ。 プッシュ通知。 次に、色域を調整します。 Gold Stuff mt5 は、金専用に設計されたトレンド指標であり、あらゆる金融商品にも使用できます。 インジケーターは再描画せず、遅れません。 推奨時間枠 H1. 設定と個人的なボーナスを得るために、購入後すぐに私に連絡してください!   設定 矢印を描く - オンオフ。 チャートに矢印を描く。 アラート - 可聴アラートのオンオフ。 メール通知 - オンオフ。 電子メール通知。 プチ通知 - オンオ
      FX Power: 通貨の強弱を分析して、より賢い取引を実現 概要 FX Power は主要通貨と金の実際の強弱をあらゆる市場状況で理解するための必須ツールです。強い通貨を買い、弱い通貨を売ることで、 FX Power は取引の意思決定を簡素化し、高い確率の取引機会を見出します。トレンドを追従する場合でも、極端なデルタ値を使用して反転を予測する場合でも、このツールはあなたの取引スタイルに完全に適応します。ただ取引するだけではなく、 FX Power で賢く取引をしましょう。 1. なぜ FX Power がトレーダーにとって非常に有益なのか 通貨と金のリアルタイム強弱分析 • FX Power は主要通貨と金の相対的な強弱を計算し、マーケットダイナミクスに関する明確な洞察を提供します。 • どの資産がリードしているか、または後れを取っているかを監視して、取引するペアを賢く選びましょう。 マルチタイムフレームの包括的なビュー • 短期、中期、長期のタイムフレームで通貨と金の強弱を追跡し、マーケットトレンドに基づいて取引戦略を調整できます。 • スキャルピングからスイングトレード
      このダッシュボードは、選択されたシンボルの最新の利用可能なハーモニックパターンを表示するので、時間を節約し、より効率的に /   MT4バージョン 。 無料インジケーター:   Basic Harmonic Pattern インジケーター列 Symbol : 選択したシンボルが表示されます。 Trend :   強気または弱気 Pattern : パターンの種類(ガートレー、バタフライ、バット、カニ、サメ、サイファー、ABCD) Entry : エントリー価格 SL: ストップロス価格 TP1: 1回目の利食い価格 TP2: 2回目の利食い価格 TP3:   3回目の利食い価格 Current price :   現在値 Age (in bars):    最後に描画されたパターンの年齢 主な入力項目 Symbols:   "28 Major Currency Pairs "または "Selected Symbols "から選択。 Selected Symbols:   カンマで区切られた監視したいシンボル("EURUSD,GBPUSD,XAUUSD")。ブローカーがペアに接
      Quantum TrendPulse を ご紹介します。これは、   SuperTrend   、   RSI   、および Stochastic のパワーを 1 つの包括的なインジケーターに組み合わせて、取引の可能性を最大限に引き出す究極の取引ツールです。精度と効率を求めるトレーダー向けに設計されたこのインジケーターは、市場のトレンド、勢いの変化、最適なエントリー ポイントとエグジット ポイントを自信を持って特定するのに役立ちます。 主な特徴: SuperTrend 統合: 現在の市場動向に簡単に追従し、収益性の波に乗ることができます。 RSI精度: 買われすぎと売られすぎのレベルを検出し、市場の反転のタイミングに最適で、SuperTrendのフィルターとして使用されます。 確率的精度: 確率的振動を活用して、変動の激しい市場で隠れたチャンスを見つけます。SuperTrend のフィルターとして使用されます。 マルチタイムフレーム分析:   M5 から H1 または H4 まで、さまざまなタイムフレームで市場を常に把握します。 カスタマイズ可能なアラート: カスタム取引条件が満たされ
      Matrix Arrow Indicator MT5
      Juvenille Emperor Limited
      5 (13)
      マトリックスアローインジケーターMT5は、すべてのシンボル/商品(外国為替、商品、暗号通貨、インデックス、株式)で使用できる100%再描画されていないマルチタイムフレームインジケーターに続くユニークな10in1トレンドです。マトリックスアローインジケーターMT5は、初期段階で現在のトレンドを判断し、最大10の標準インジケーターから情報とデータを収集します。 平均方向移動指数(ADX) 商品チャネルインデックス(CCI) クラシック平研アシキャンドル 移動平均 移動平均収束発散(MACD) 相対活力指数(RVI) 相対力指数(RSI) 放物線SAR ストキャスティクス ウィリアムズのパーセント範囲 すべてのインジケーターが有効な買いまたは売りシグナルを与えると、対応する矢印がチャートに印刷され、次のろうそく/バーの開始時に強い上昇トレンド/下降トレンドを示します。ユーザーは、使用するインジケーターを選択し、各インジケーターのパラメーターを個別に調整できます。マトリックスアローインジケーターMT5は選択されたインディケーターからのみ情報を収集し、それらのデータのみに基づいてアローを印刷
      VERSION MT4        —        ИНСТРУКЦИЯ RUS           —        INSTRUCTIONS  ENG 主な機能: レンダリングなしで正確な入力信号! シグナルが表示されると、それは関連性を維持します。これは、シグナルを提供してからそれを変更し、その結果、入金された資金が失われる可能性があるリドローインジケーターとの重要な違いです。より高い確率と精度で市場に参入できるようになりました。矢印が表示された後、ターゲットに到達する (利益確定) か反転シグナルが表示されるまで、ローソク足に色を付ける機能もあります。 STOP-LOSS/TAKE-PROFITゾーンの表示 エントリーポイントを検索する際の視覚的な明瞭さを改善するために、最適な市場エントリーポイントが検索される購入/販売ゾーンを最初に表示するモジュールが作成されました。ストップロスレベルを操作するための追加のインテリジェントロジックは、時間の経過とともにそのサイズを縮小するのに役立ち、それによって取引に参加するときの初期リスクを軽減します(Move SL)。 より高いタイ
      MONEYTRON – ТВОЙ ЛИЧНЫЙ СИГНАЛ НА УСПЕХ! XAUUSD | AUDUSD | USDJPY | BTCUSD Поддержка таймфреймов: M5, M15, M30, H1 Почему трейдеры выбирают Moneytron? 82% успешных сделок — это не просто цифры, это результат продуманной логики, точного алгоритма и настоящей силы анализа. Автоматические сигналы на вход — не нужно гадать: когда покупать, когда продавать. 3 уровня Take Profit — ты сам выбираешь свой уровень прибыли: безопасный, уверенный или максимум. Четкий Stop Loss — контролируешь риск
      優れたテクニカルインジケーター「Grabber」をご紹介します。これは、すぐに使える「オールインワン」トレーディング戦略として機能します。 ひとつのコードに、市場のテクニカル分析ツール、取引シグナル(矢印)、アラート機能、プッシュ通知が強力に統合されています。 このインジケーターを購入された方には、以下の特典を無料で提供します: Grabberユーティリティ:オープンポジションを自動で管理するツール ステップバイステップのビデオマニュアル:インジケーターのインストール、設定、取引方法を解説 カスタムセットファイル:インジケーターをすばやく自動設定し、最大限の成果を出すための設定ファイル 他の戦略はもう忘れてください!Grabberだけが、あなたを新たなトレードの高みへと導いてくれるのです。 Grabber戦略の主な特徴: 推奨タイムフレーム:M5〜H4 対応通貨ペア・資産:どれでも使用可能ですが、私が実際に検証した以下を推奨します(GBPUSD、GBPCAD、GBPCHF、AUDCAD、AUDUSD、AUDSGD、AUDCHF、NZDUSD、NZDCAD、EURCAD、EURUSD、E
      まず第一に、この取引インジケーターは再描画されず、再描画されず、遅延しないことを強調する価値があります。これにより、手動取引とロボット取引の両方に理想的なものになります。 ユーザーマニュアル:設定、入力、戦略。 アトミックアナリストは、価格の強さとモメンタムを利用して市場でより良いエッジを見つけるためのPA価格アクションインジケーターです。ノイズや誤ったシグナルを除去し、取引ポテンシャルを高めるための高度なフィルターを備えています。複雑なインジケーターの複数のレイヤーを使用して、アトミックアナリストはチャートをスキャンし、複雑な数学的計算をシンプルなシグナルと色に変換します。これにより、どのような初心者トレーダーでも理解して使用し、一貫した取引の決定を行うことができます。 「アトミックアナリスト」は、新規および経験豊富なトレーダー向けにカスタマイズされた包括的な取引ソリューションです。プレミアムインジケーターとトップノッチの機能を1つの取引戦略に組み合わせ、すべてのタイプのトレーダーにとって汎用性のある選択肢にします。 デイリートレーディングとスキャルピング戦略:高速で正確なデイ
      まず第一に、この取引ツールはノンリペイント、ノンリドロー、ノンラグの指標であり、プロの取引に理想的ですことを強調する価値があります。 オンラインコース、ユーザーマニュアル、デモ。 スマートプライスアクションコンセプトインジケーターは、新米から経験豊富なトレーダーまで、非常 に強力なツールです。Inner Circle Trader AnalysisやSmart Money Concepts Trading Strategiesなど、20以上の有用な指標を1つに組み合わせています。このインジケーターはスマートマネーコンセプトに焦点を当て、大手機関の取引方法を提供し、彼らの動きを予測するのに役立ちます。 特に、流動性分析に優れており、機関がどのように取引しているかを理解しやすくしています。市場のトレンドを予測し、価格の動きを慎重に分析するのに優れています。機関の戦略とトレードを合わせることで、市場の動向についてより正確な予測ができます。このインジケーターは多目的であり、市場構造を分析し、重要な注文ブロックを特定し、さまざまなパターンを認識するのに優れています。 このインジケーター
      次世代の自動化された需要と供給のゾーン。どのチャートでも機能する新しい革新的なアルゴリズム。すべてのゾーンは、市場の価格行動に従って動的に作成されています。 2種類のアラート --> 1) 価格がゾーンに達したとき 2) 新しいゾーンが形成されたとき もう 1 つの役に立たない指標はありません。実績のある完全な取引戦略を手に入れることができます。     新機能:     価格が需給ゾーンに達したときにアラートを出す     新しい需給ゾーンが作成されたときにアラートを発します     プッシュ通知アラート     ピップ単位のゾーン幅ラベル     MTF のもう 1 つのタイムフレーム。したがって、現在より 2 時間足高いのではなく、現在より 3 時間足し上に見えるようになります。     アラート/ゾーン/MTF 機能を有効/無効にするボタン あなたが得る利点:     取引から感情を取り除きます。     取引エントリをオブジェクト化します。     確率の高いセットアップで利益を上げましょう。     描画ゾーンから時間を節約します。
      WHY IS OUR FXACCCURATE LS MT5 THE PROFITABLE ? PROTECT YOUR CAPITAL WITH RISK MANAGEMENT Gives entry, stop and target levels from time to time. It finds Trading opportunities by analyzing what the price is doing during established trends. POWERFUL INDICATOR FOR A RELIABLE STRATEGIES We have made these indicators with a lot of years of hard work. It is made at a very advanced level. Established trends provide dozens of trading opportunities, but most trend indicators completely ignore them! The
      これはMT5のインジケーターで、再描画なしで取引に参入するための正確なシグナルを提供します。 外国為替、暗号通貨、金属、株式、インデックスなど、あらゆる金融資産に適用できます。かなり正確な見積もりを提供し、取引を開始して終了するのに最適な時期を教えてくれます。1つのシグナルを処理しただけでインジケーターの元が取れた例の 動画 (6:22)をご覧ください。Entry PointsPro インジケーターの助けを借りたほとんどのトレーダーの最初の1週間の結果が改善しています。 Telegramグループ に登録してください。Entry Points Proインジケーターのメリットは次の通りです。 再描画のないエントリーシグナル 再描画されるインジケーターでは一度表示されたシグナルが削除されて大きな金銭的損失につながることがありますが、これと異なり、表示されて確認されたシグナルは消えることがありません。 エラーなしの取引開始 インジケーターアルゴリズムによって取引を開始する(資産を売買する)理想的な瞬間を見つけることができます。それを使用するすべてのトレーダーの成功率が向上します。 あら
      NOTE: CYCLEMAESTRO is distributed only on this website, there are no other distributors. Demo version is for reference only and is not supported. Full versione is perfectly functional and it is supported. CYCLEMAESTRO , the first and only indicator of Cyclic Analysis, useful for giving signals of TRADING, BUY, SELL, STOP LOSS, ADDING. Created on the logic of   Serghei Istrati   and programmed by   Stefano Frisetti ;   CYCLEMAESTRO   is not an indicator like the others, the challenge was to inter
      ATrend
      Zaha Feiz
      4.77 (13)
      ATrend: その仕組みと使い方 仕組み MT5プラットフォーム向けの「ATREND」インジケーターは、テクニカル分析手法の組み合わせを利用して、トレーダーに堅牢な買いと売りのシグナルを提供するように設計されています。このインジケーターは主に、ボラティリティ測定のために平均真の範囲(ATR)を活用し、潜在的な市場動向を特定するためのトレンド検出アルゴリズムを併用しています。 購入後にメッセージを残すと、特別なボーナスギフトが贈呈されます。 主な特徴: - ダイナミックなトレンド検出: インジケーターは市場トレンドを評価し、シグナルを適宜調整することで、トレーダーが優位な市場環境に合わせて戦略を立てるのを支援します。     - ボラティリティ測定: ATRを使用することで、インジケーターは最適なストップロス(SL)とテイクプロフィット(TP)レベルを決定するために不可欠な市場ボラティリティを測定します。 - シグナルの視覚化: インジケーターは、チャート上に買いと売りのシグナルを視覚的に表示することで、トレーダーの意思決定を強化します。 操作手順 入力とセッティング - TimeF
      FourAverageは、トレンド検出の新しい単語です。 情報技術の発展と多数の参加者に伴い、金融市場は時代遅れの指標による分析にあまり適していなくなっています。 移動平均や確率などの従来のテクニカル分析ツールは、純粋な形でトレンドの方向やその反転を決定することはできません。 1つの指標は、14年の歴史に基づいて、そのパラメータを変更することなく、将来の価格の正しい方向を示すことができますか? 同時に、横向きの市場の動きで妥当性を失うことはありませんか? 答え:はい、それはできます。 私たちのチームは、変化する市場の状況に適応するためのかなり強力で効果的なメカニズムを持つ指標を開発しました。 2025年には、主要なトレンド指標"Four平均"は開発の新しい段階に入っています。 現代の暗号通貨と株式市場は、この指標のために作成されたようです。 独自の平滑化式を使用すると、通貨ペアまたは他の楽器の任意の機能のための指標を調整(パターンを識別)することができます。 さて、利益を上げるためには、1つの指標で十分であり、これはほんの始まりに過ぎません。 他のツールと組み合わせて、または信号フィル
      FX Levels: あらゆる市場における非常に高精度なサポート&レジスタンス 概要 通貨ペア、株式指数、個別銘柄やコモディティなど、どのような市場でも信頼できるサポートとレジスタンスを特定したいですか? FX Levels は伝統的な “Lighthouse” メソッドと先進的な動的アプローチを融合し、ほぼ汎用的な精度を実現します。ブローカーの実務経験を活かし、自動化されたデイリー更新とリアルタイム更新を組み合わせることで、 FX Levels は反転ポイントを見つけ、利益目標を設定し、自信をもってトレードを管理するための手助けをします。今すぐ試してみて、サポート/レジスタンス分析の正確性がどれほどトレードを向上させるかを実感してください! 1. FX Levels がトレーダーにとって非常に有用な理由 非常に正確なサポート&レジスタンスゾーン • FX Levels は異なるブローカー環境でもほぼ同一のゾーンを生成するよう設計されており、データフィードの差異や時刻設定のずれによる不一致を解消します。 • つまり、どのブローカーを利用していても一貫したレベルが得られるため、戦
      ご紹介     Quantum Breakout PRO は 、ブレイクアウト ゾーンの取引方法を変革する画期的な MQL5 インジケーターです。 13年以上の取引経験を持つ経験豊富なトレーダーのチームによって開発されました。     クォンタム ブレイクアウト プロ   は、革新的でダイナミックなブレイクアウト ゾーン戦略により、あなたのトレーディングの旅を新たな高みに押し上げるように設計されています。 クォンタム ブレイクアウト インジケーターは、5 つの利益ターゲット ゾーンを備えたブレイクアウト ゾーン上のシグナル矢印と、ブレイクアウト ボックスに基づいたストップロスの提案を提供します。 初心者トレーダーにもプロのトレーダーにも適しています。 量子EAチャネル:       ここをクリック 重要!購入後、インストールマニュアルを受け取るためにプライベートメッセージを送ってください。 推奨事項: 時間枠: M15 通貨ペア: GBPJPY、EURJPY、USDJPY、NZDUSD、XAUUSD アカウントの種類: ECN、Raw、またはスプレッドが非常に低い R
      収益性の高い取引機会を簡単に特定するのに役立つ強力な外国為替取引インジケーターをお探しですか?ビースト スーパー シグナル以外に探す必要はありません。 この使いやすいトレンドベースのインジケーターは、市場の状況を継続的に監視し、新しいトレンドを検索したり、既存のトレンドに飛びついたりします。ビースト スーパー シグナルは、すべての内部戦略が一致し、互いに 100% 合流したときに売買シグナルを発するため、追加の確認は不要です。シグナル矢印アラートを受け取ったら、単に売買します。 購入後、プライベート VIP グループに追加されるようにメッセージを送ってください! (完全な製品購入のみ)。 購入後、最新の最適化されたセット ファイルについてメッセージを送ってください。 MT4版は こちらから。 Beast Super Signal EA は こちらから 入手できます。 コメント セクションをチェックして、最新の結果を確認してください。 ビースト スーパー シグナルは、1:1、1:2、または 1:3 のリスクと報酬の比率に基づいて、エントリー価格、ストップ ロス、テイク プ
      Trend Hunter は、外国為替、仮想通貨、CFD 市場におけるトレンド指標です。 このインジケーターの特別な特徴は、価格がトレンドラインをわずかに突き抜けたときにシグナルを変更することなく、自信を持ってトレンドに従うことです。 インジケーターは再描画されず、バーが閉じた後に市場に参入するシグナルが表示されます。 トレンドに沿って移動すると、インジケーターにはトレンドの方向に追加のエントリーポイントが表示されます。 これらのシグナルに基づいて、小さなストップロスで取引できます。 トレンドハンターは正直な指標です。 インジケーター信号の上にマウスを置くと、信号の潜在的な利益と可能なストップが表示されます。 新しい信号が表示されると、次の通知を受け取ることができます。 アラート プッシュ通知 メールによる通知 電報での通知 チャートのスクリーンショットも Telegram に送信されるため、取引を決定するために端末を開く必要はありません。 インジケーターシグナルは、電報チャネル https://www.mql5.com/ja/market/product/11085#!ta
      Auto Order Block with break of structure based on ICT and Smart Money Concepts (SMC) Futures Break of Structure ( BoS )             Order block ( OB )            Higher time frame Order block / Point of Interest ( POI )    shown on current chart           Fair value Gap ( FVG ) / Imbalance   -  MTF      ( Multi Time Frame )    HH/LL/HL/LH  -  MTF      ( Multi Time Frame )  Choch  MTF      ( Multi Time Frame )  Volume Imbalance     ,  MTF          vIMB Gap’s Power of 3 Equal High / Low’s  
      作者のその他のプロダクト
      If you love this indicator, please leave a positive rating and comment, it will be a source of motivation to help me create more products <3 Key Takeaways VWAP is a trading benchmark that typically is most useful to short-term traders. VWAP is used in different ways by traders  . Traders may use it as   a trend confirmation tool   and build trading rules around it. Also, If prices below VWAP and move above it, c an be used by traders as a sell signal. If prices above VWAP and move below it,  ca
      FREE
      If you love this indicator, please leave a positive rating and comment, it will be a source of motivation to help me create more products <3 Key Takeaways The Laguerre RSI is an enhanced version of the traditional Relative Strength Index (RSI) that incorporates Laguerre filters to smooth the price data. This helps reduce the noise and volatility that are often seen in the standard RSI, providing a cleaner and more reliable indicator for spotting trends, reversals, and overbought or oversold con
      FREE
      If you love this indicator, please leave a positive rating and comment, it will be a source of motivation to help me create more products <3 How to use SuperTrend? When the price crosses above the supertrend line it signals a buy signal and when the price crosses below the supertrend line it signals a sell signal. The supertrend indicator which acts as a dynamic level of support or resistance and helps traders make informed decisions about entry and exit points.  When prices are above s upertre
      FREE
      If you love this indicator, please leave a positive rating and comment, it will be a source of motivation to help me create more products <3 How to use QQE? Determine trend when RSI MA ​​above 50 indicate a bullish market, while RSI MA ​​below 50 indicate a bearish market and   can server as a trend filter. Identify short-term up/down momentum, when the RSI MA crosses up Smoothed signals bullish momentum, and when the RSI MA crosses down Smoothed signals bearish momentum. It is also possible to
      FREE
      If you love this indicator, please leave a positive rating and comment, it will be a source of motivation to help me create more products <3 Key Takeaways The Zig Zag  Advanced   indicator plot points on a chart whenever prices reverse by the percentage the trader sets in the input section. The Zig Zag Advanced indicator lowers the impact of random price fluctuations and is used to identify trends and changes in trends. The indicator lowers noise levels, highlighting trends higher and lower. Th
      FREE
      If you love this indicator, please leave a positive rating and comment, it will be a source of motivation to help me create more products <3 How to use Aroon Indicator? The AroonUp and the AroonDown measure the strength of the uptrend and the strength of the downtrend, respectively. These lines fluctuate between zero and 100. Values close to 100 indicate a strong trend and values near zero indicate a weak trend where the lower the AroonUp, the weaker the uptrend and the stronger the downtrend,
      FREE
      If you love this indicator, please leave a positive rating and comment, it will be a source of motivation to help me create more products <3 How to use Gann High-Low Activator? The Gann HiLo Activator helps the trader identify the current trend of the market. When the indicator is below the closing price, it can indicate that an uptrend is taking place. Conversely, when the indicator is above the closing price, it can indicate a downtrend. The Gann HiLo Activator also generates buy and sell sig
      FREE
      Introducing the Sniper EURJPY Sniper EURJPY is a strategy specifically designed for the EURJPY pair.  It utilizes advanced technical analysis to find entry points. Sniper EURJPY is using a ratio of 1:2 with this ratio you only need to have a win rate of over 33% to make a profit. Sniper EURJPY is very suitable for traders who like safety and sustainability. Key Features: NO   Grid and   NO   martingale Risk and Reward: 1:2  gives you a long-term advantage in the market. Trailingstops:  Helps you
      FREE
      Key Takeaways This timer does not lag like other timer indicators Show the time end of candlesticks and spread Hide or Show Spread depending on user needs Works on all timeframes Adjust Text Size Adjust Text Color Adjust Text Font  If you love this indicator, please leave a positive rating and comment, it will be a source of motivation to help me create more products <3
      FREE
      If you love this indicator, please leave a positive rating and comment, it will be a source of motivation to help me create more products <3 How to use  Slope Direction Line Uptrend: When the SDL line slopes up and turns from red to green, it shows that the price is trending up. This is also considered a buy signal. Downtrend: When the SDL line slopes down and turns from green to red, it shows that the price is trending down. This is also considered a sell signal. Sideways: When the SDL line mo
      FREE
      If you love this indicator, please leave a positive rating and comment, it will be a source of motivation to help me create more products <3 Key Takeaways Fisher is a repaint indicator. It recalculates previous bars when new bars become available. Modified to avoid repainting to accommodate some merchants. Fisher indicator is quite a simple histogram indicator that detects the trend's direction and strength and signals about trend changes. Traders look for extreme readings to signal potential p
      FREE
      Introducing the Sniper AUDUSD Trading Strategy Sniper AUDUSD is a highly accurate forex trading strategy specifically designed for the AUD/USD currency pair. It leverages advanced technical analysis to identify high-probability entry points, aiming to maximize profits while minimizing risk.  The Sniper AUDUSD strategy uses complex algorithms to analyze and identify trends to generate highly accurate buy and sell signals. Once the signal is activated, the system will automatically execute trades
      FREE
      If you love this indicator, please leave a positive rating and comment, it will be a source of motivation to help me create more products <3 Key Takeaways Bulls Bears Eyes is another version of Laguerre RSI. Use Bull/Bear Power to calculate. One use of the  Bulls Bears Eyes is to identify trends. This is done by looking for sustained periods when the indicator is above or below the 0.5 line. Also, a buy signal is generated when the   Bulls Bears Eyes line crosses above the 0.15 level, while a s
      FREE
      フィルタ:
      レビューなし
      レビューに返信
      バージョン 1.3 2024.12.02
      Fix bugs
      バージョン 1.2 2024.12.02
      Delete unnecessary colors
      バージョン 1.1 2024.12.02
      Fix a few small errors