DMI High Low plus
- インディケータ
- HEGUI Morad
- バージョン: 1.1
- アップデート済み: 3 12月 2024
DMI Show High Low: Visualize Key Market Levels in Real Time
100% free, functional, and without limitations!
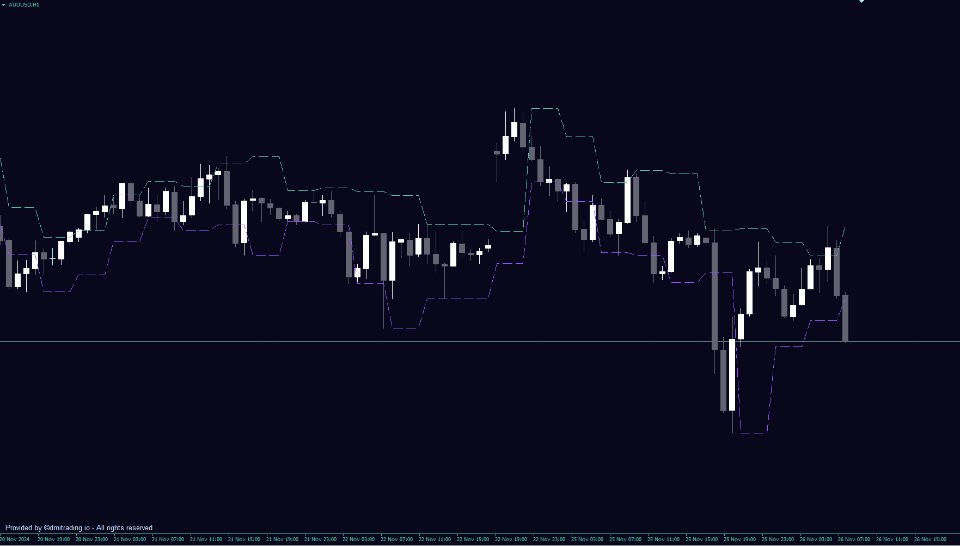
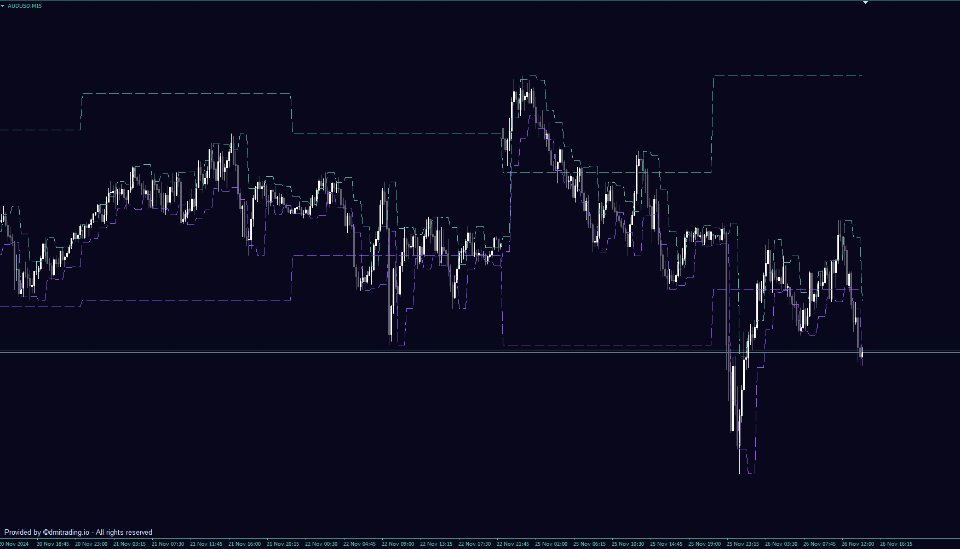
The DMI Show High Low is an essential tool for traders, designed to display High, Low, and Close levels of a selected timeframe directly on your chart. Ideal for identifying key market zones, this indicator helps enhance your decision-making and trading precision.
Parameters:
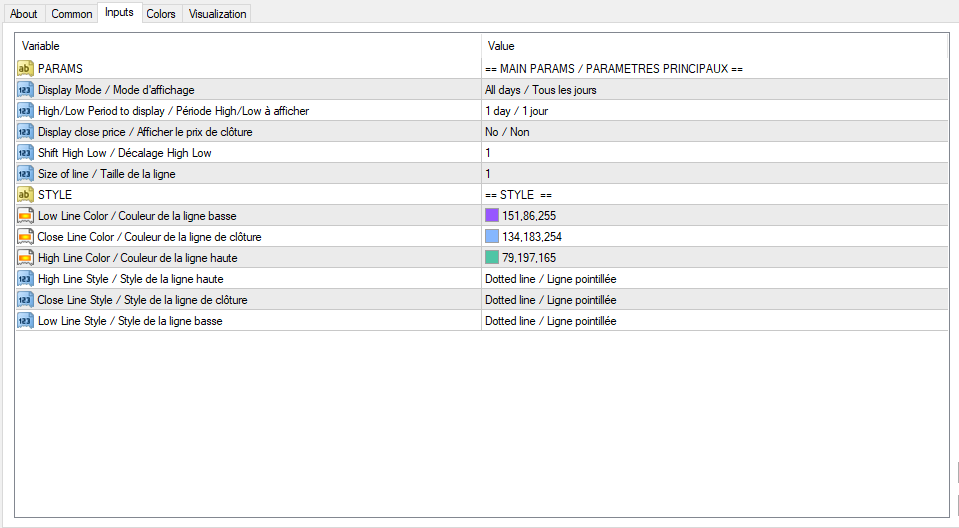
- Timeframe: Select the timeframe for displaying High, Low, and Close levels. Default: D1 (Daily)
- Display Close Line: Toggle the visibility of the Close line on the chart. Default: No
- Shift High/Low: Adjust the offset for High and Low lines. Default: 1
- Line Style: Customize the style of the lines (e.g., solid, dotted).
- Line Width: Set the thickness of the lines for High, Low, and Close. Default: 1
- Line Color: Choose the color for each line (High, Low, and Close). Default: High - Green, Low - Red, Close - Blue
This simple and intuitive indicator is perfect for traders who want to improve their market analysis and optimize their trading strategies.
