Bull and Bear Zones
- インディケータ
- Stanislav Konin
- バージョン: 1.0
- アクティベーション: 10
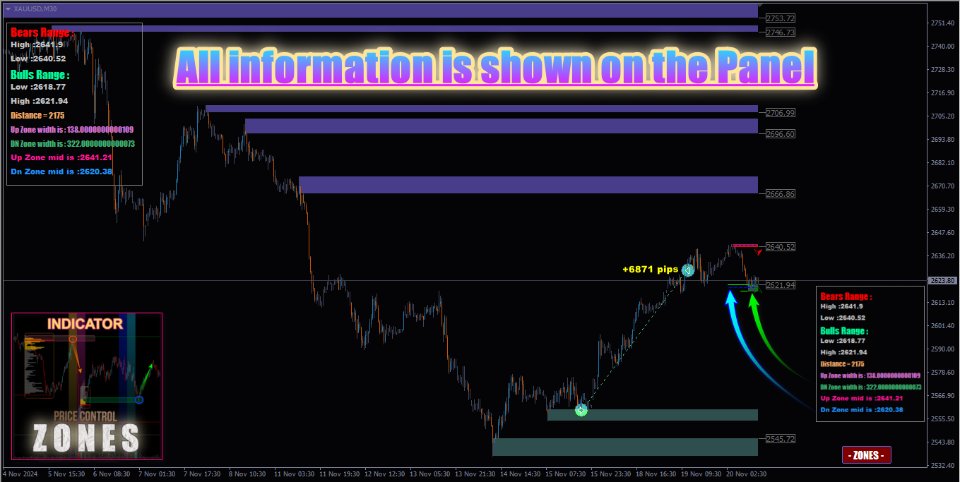
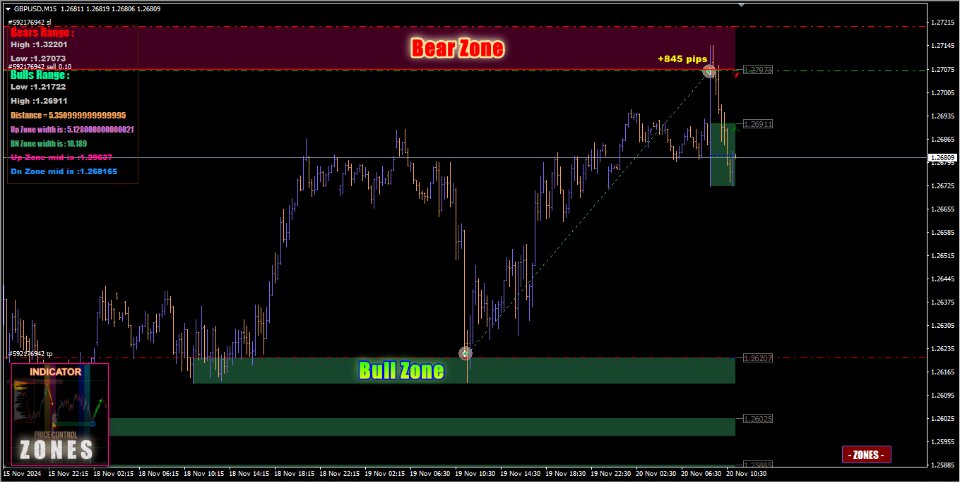
The Bull and Bear Zones indicator is specifically designed for the automatic identification and visual display of support and resistance zones directly on the chart. Its unique algorithm allows it to display not only the zones already tested by the market but also potential target zones that have yet to be tested. The indicator tracks ranges where an imbalance between supply and demand is observed.
Key Features:
-
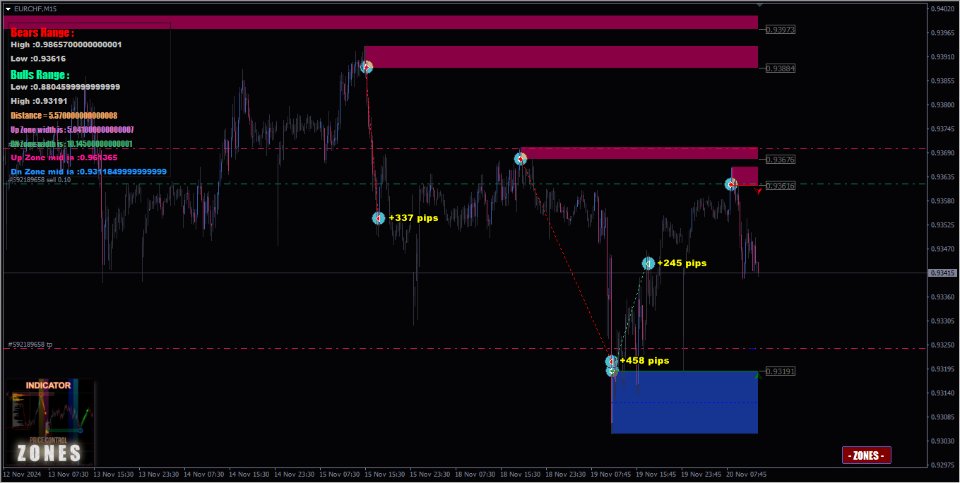
Automatic identification of support and resistance zones: The indicator calculates key levels and displays them on the chart as zones where the market shows the strongest activity.
-
Forecasting potential target zones: The indicator doesn’t just identify already-tested levels; it also creates zones that the market has not yet experienced. This allows traders to prepare for potential breakouts in advance.
-
Tracking the supply and demand balance: The indicator analyzes ranges where a significant imbalance between buyers and sellers is observed, identifying key levels that influence future price movements.
-
Marking of key zone breakouts: In the event of a breakout of important zones, the indicator automatically marks these levels on the chart, warning traders of possible strong price moves.
Main Functions and Settings:
-
Professional panel: The panel displays crucial information about the current zones:
- Range levels
- Distance between levels
- Formation of new zones and the current formed zones
- Important median levels within zones. All information is also duplicated directly on the chart, providing traders with a comprehensive visual analysis.
-
On/Off button: The indicator has an on/off button directly on the chart, allowing users to quickly activate or deactivate the indicator without changing the settings. The button has advanced settings:
- Position on the chart
- Text settings (font, color)
- Size and color palette adjustment
-
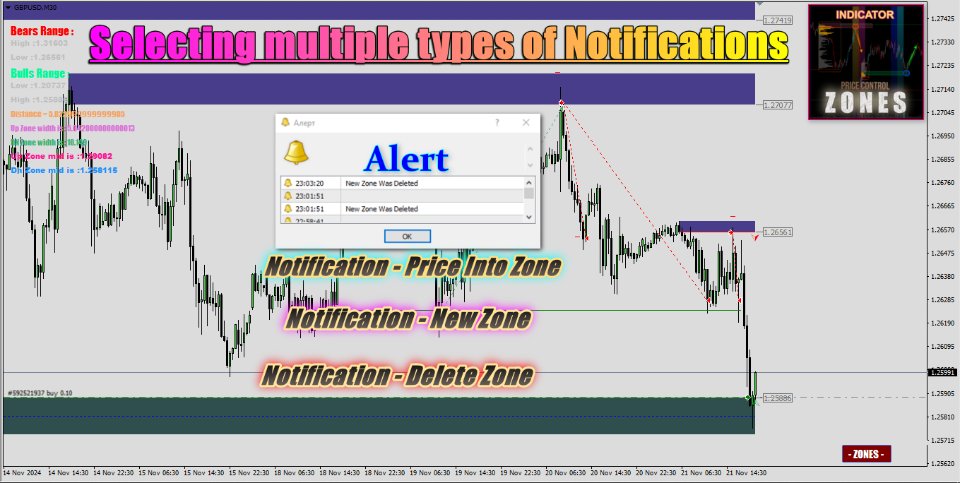
Notification types:
- Price entering a specific zone
- Formation of new support/resistance zones
- Deletion of old zones
Sound alerts: The indicator supports all types of alerts, including push notifications to mobile devices.
-
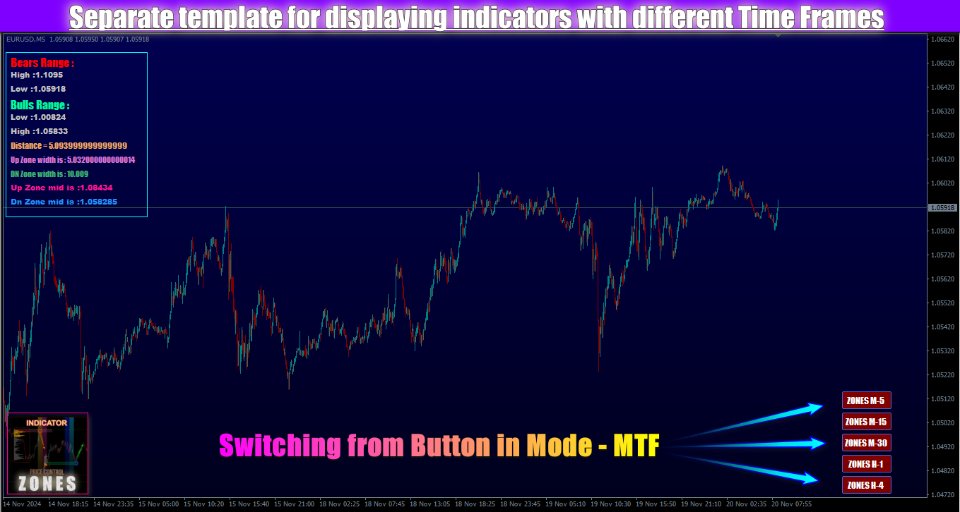
Multi Timeframe (MTF) Mode: This mode allows the indicator to be applied to multiple timeframes simultaneously, making it ideal for multi-timeframe analysis. For example, you can use the indicator on H1, H4, and D1 charts to get more accurate signals and understand the overall trend on different time intervals.
Indicator Application:
The Bull and Bear Zones indicator is a versatile tool for various strategies and markets. It is ideal for:
-
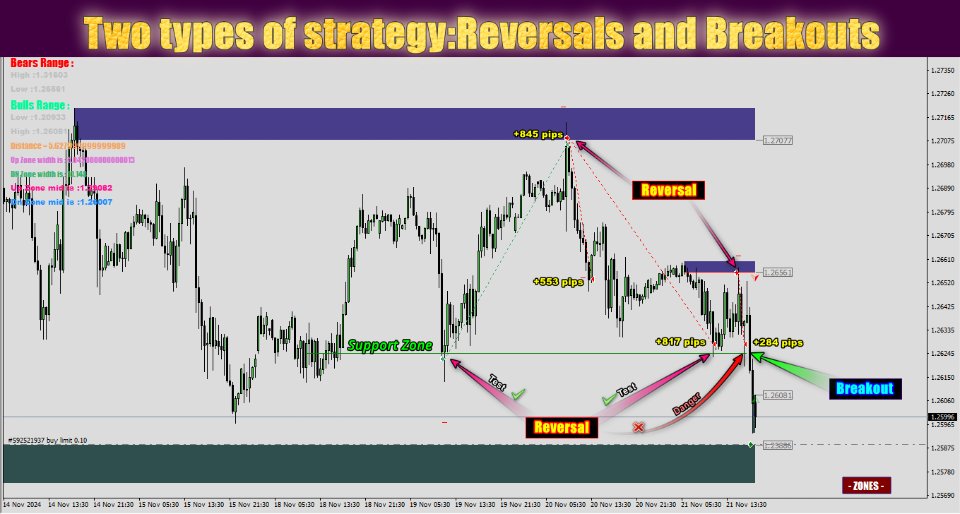
Trend-following strategies (Breakouts): Helps traders identify breakouts of key levels and trend continuation after the breakout of support or resistance zones.
-
Counter-trend strategies (Reversals): Assists in identifying trend reversal points when the price returns to key support or resistance zones.
Usage Recommendations:
-
Currency pairs: The indicator is suitable for all types of markets, including Forex, metals, CFDs, and cryptocurrencies.
-
Timeframes:
- M15: Ideal for intraday trading.
- M30 - H1: Suitable for more accurate signals in analysis.
- H4 - D1: For medium-term trading and longer positions.
Strategies and Their Application:
-
Breakout Strategy:
- Use this strategy at the beginning of trading sessions when large liquidity inflows enter the market (e.g., during the opening of the European or U.S. sessions).
- It’s important to consider the volatility and the average price range (ATR) to understand how far the price might move after a breakout.
-
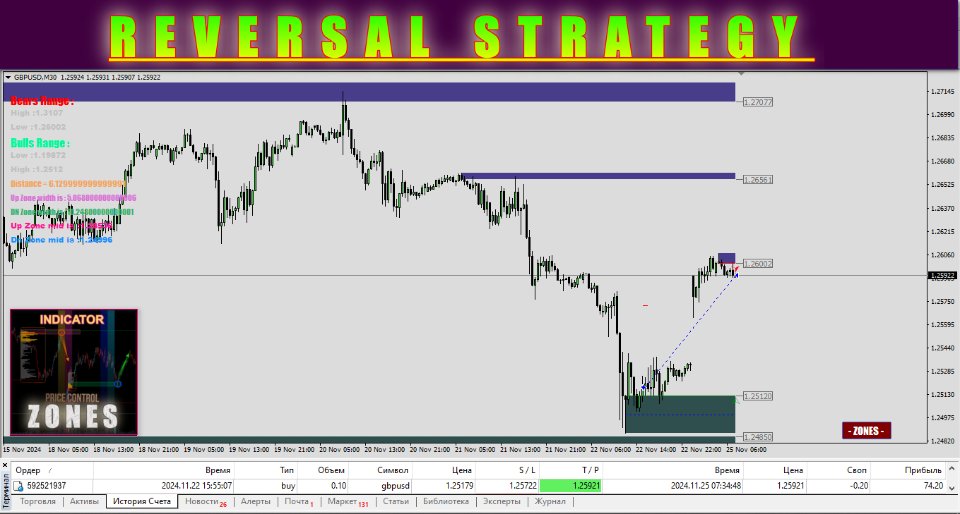
Reversal Strategy:
- Use this strategy during retest or when price revisits zones. A repeat test of a zone could signal a trend reversal.
- If the price exceeds 80% of the average range of the instrument, this could be a strong signal for entering a position.
- Avoid entering trades when the key zones have been tested multiple times (more than 3 times), as this could signal a possible breakout level.
Conclusion:
The Bull and Bear Zones indicator is a powerful tool for analyzing market levels and identifying entry and exit points. With its unique algorithm, traders can not only analyze tested zones but also forecast key levels that the market has yet to test. The indicator is ideal for use in both trend-following and counter-trend strategies, providing traders with reliable signals and useful tools for analysis and trading across different timeframes.
