Market Maker Dashboard by G Labs mt5
- インディケータ
- Garry James Goodchild
- バージョン: 1.1
- アクティベーション: 7
G-Labs Market Maker Dashboard - Exclusive Seasonal Offer
Elevate your trading with the original G-Labs Market Maker Dashboard, available for a limited time at just $70 USD. Ideal for starter traders, this dashboard has been enhanced with new features and now includes a comprehensive training video.
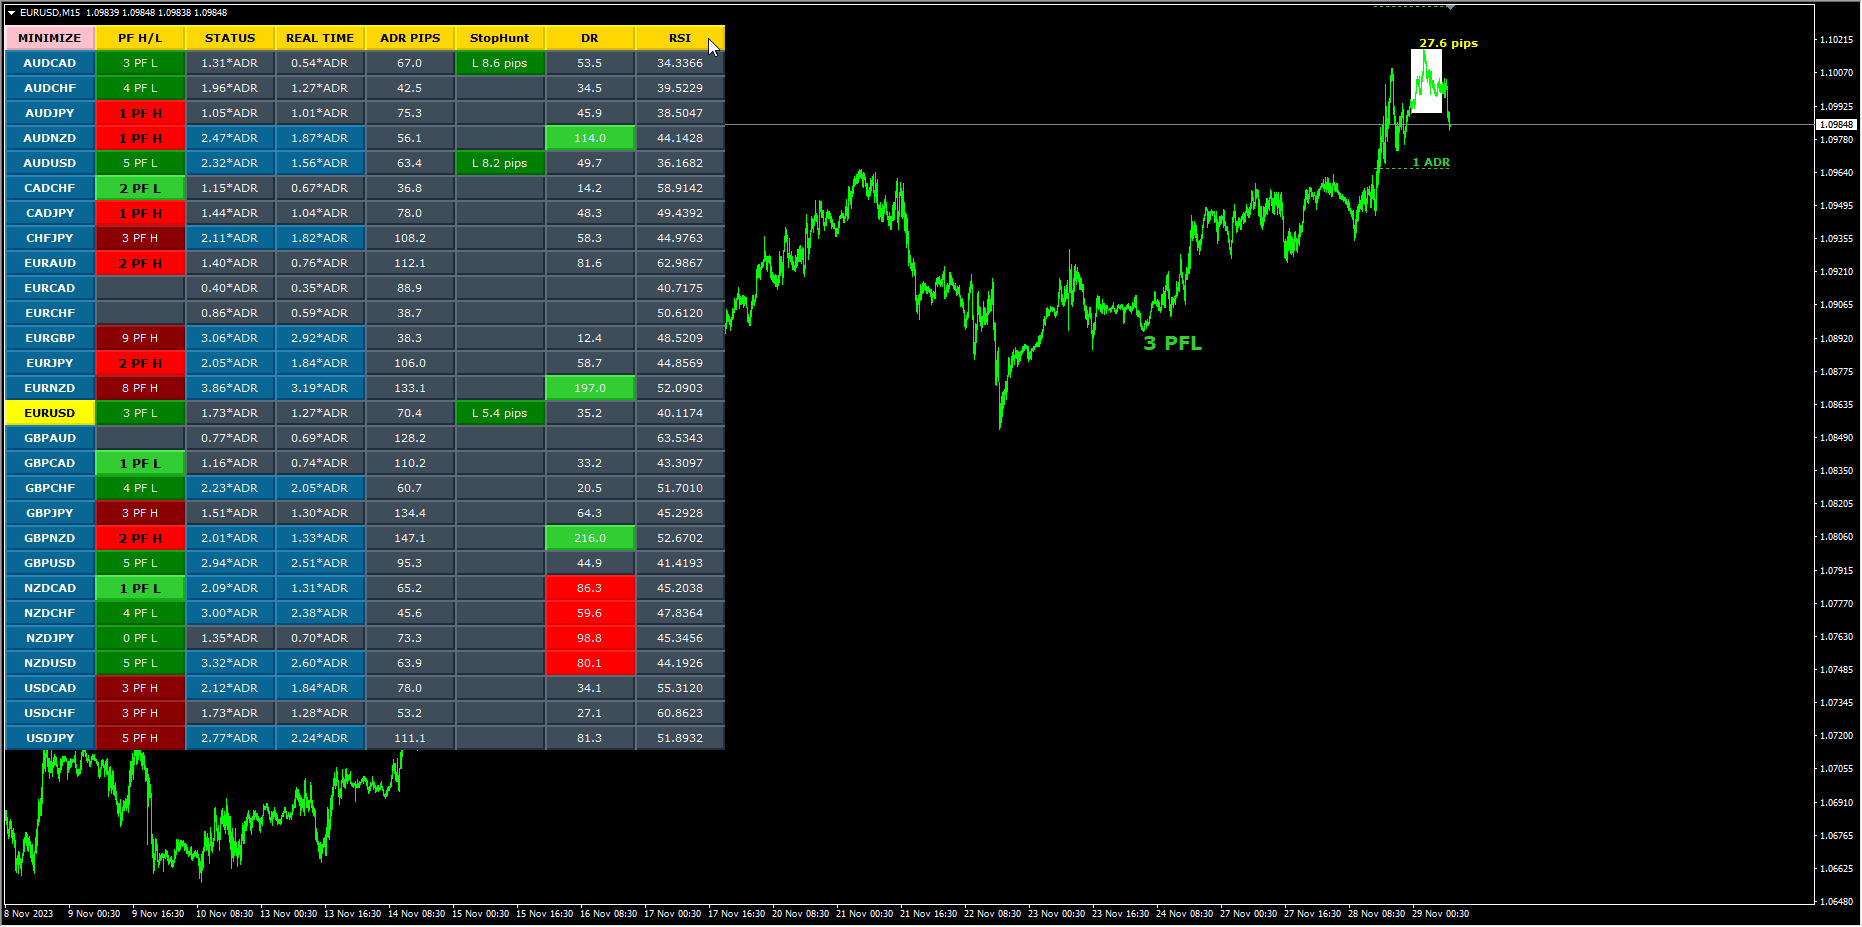
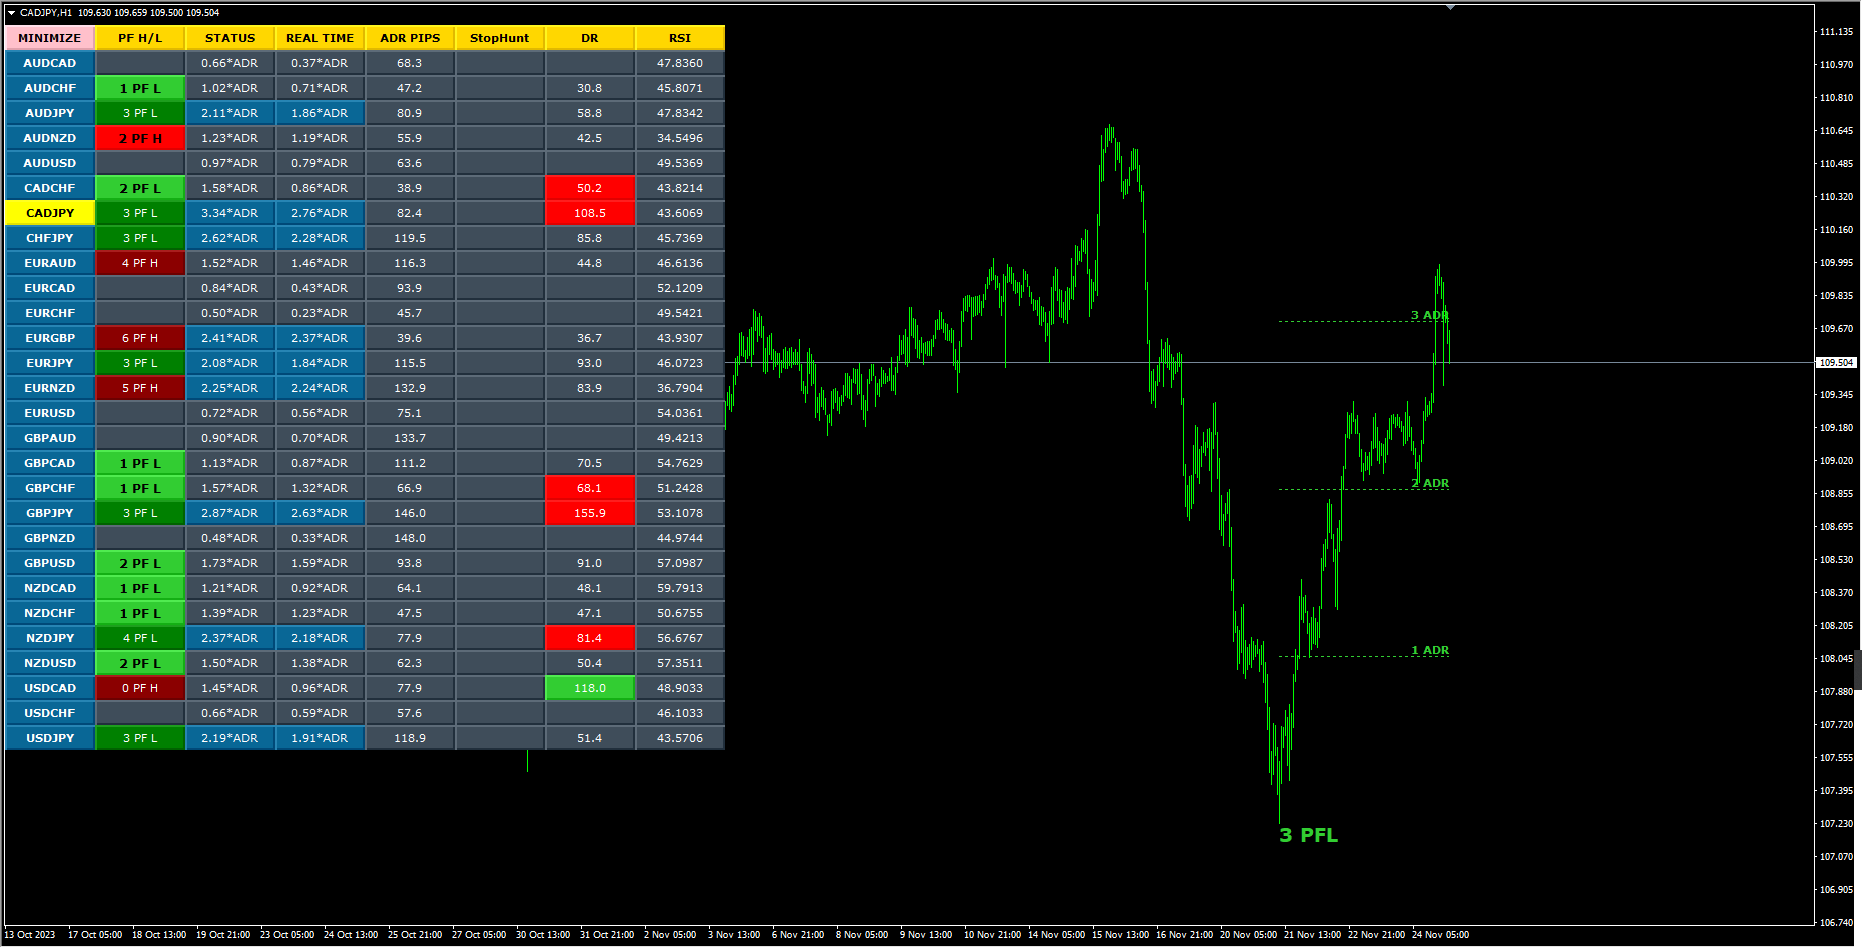
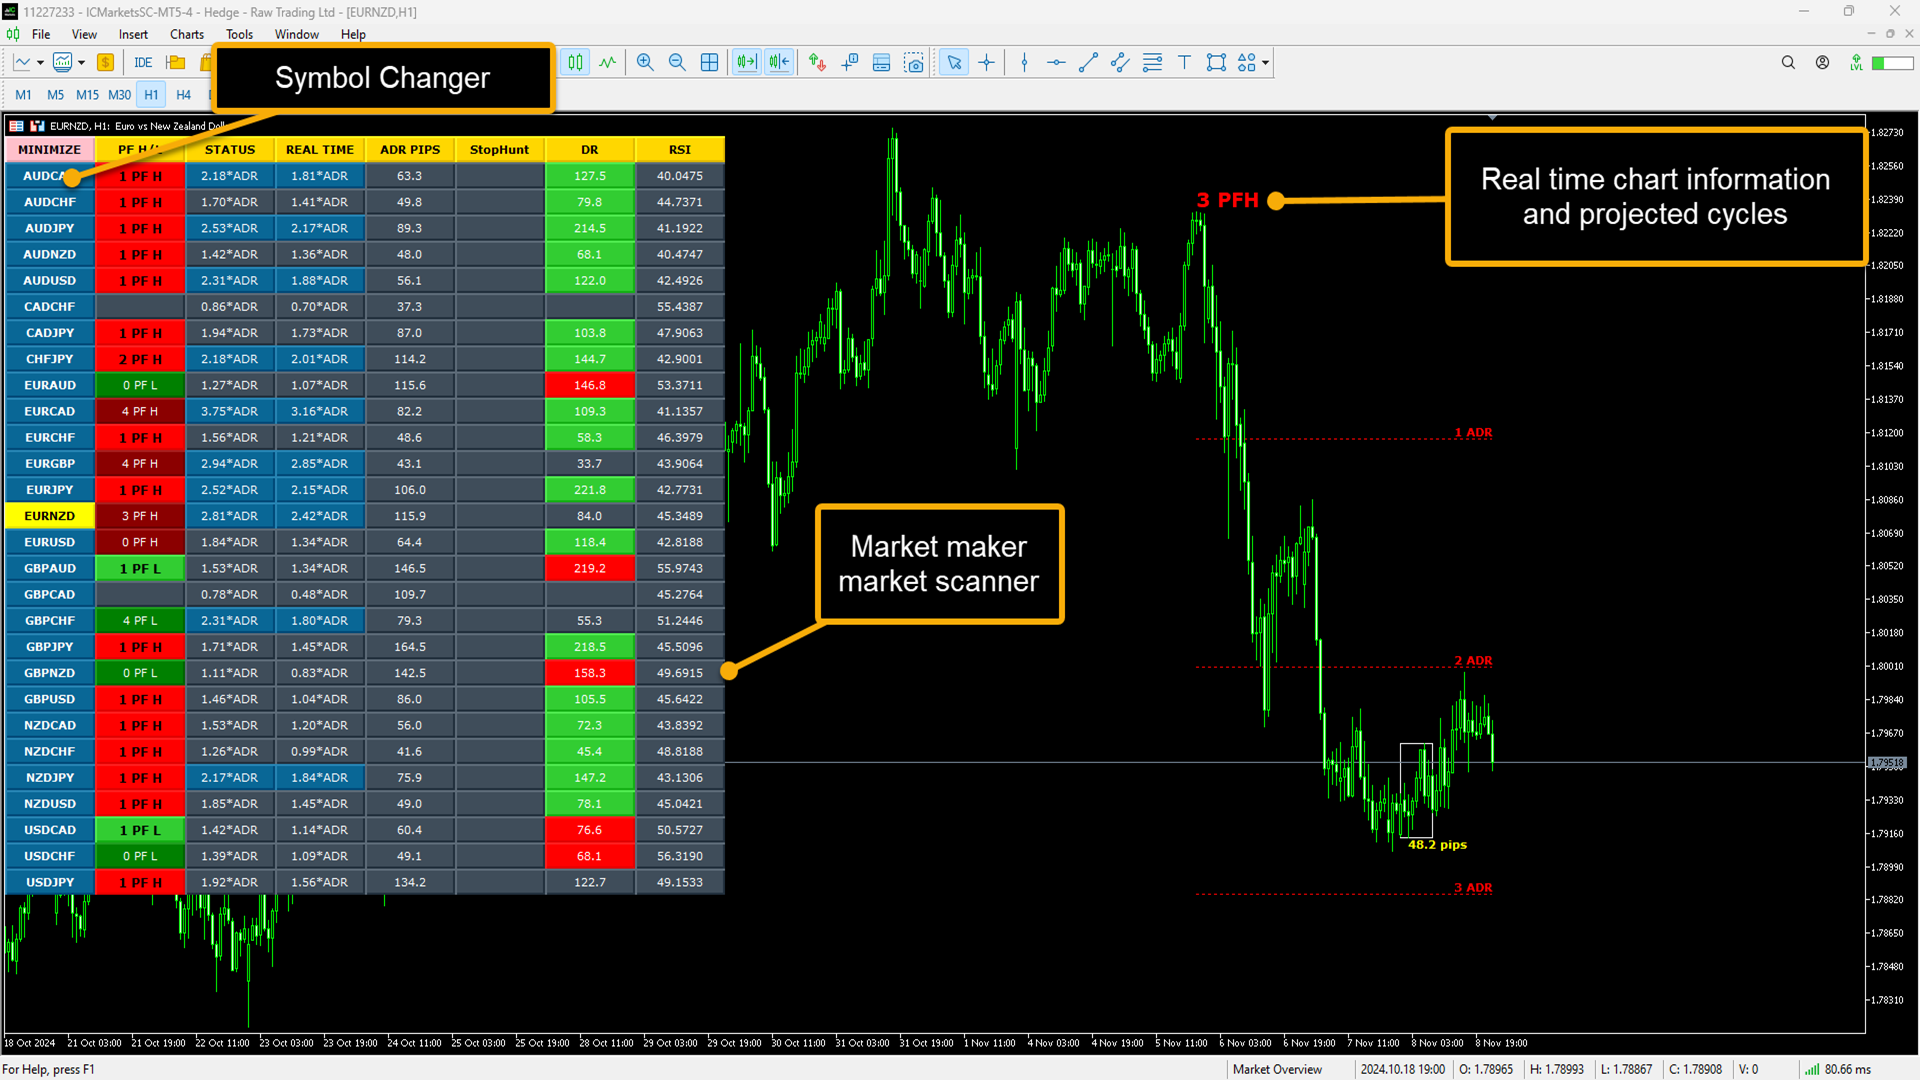
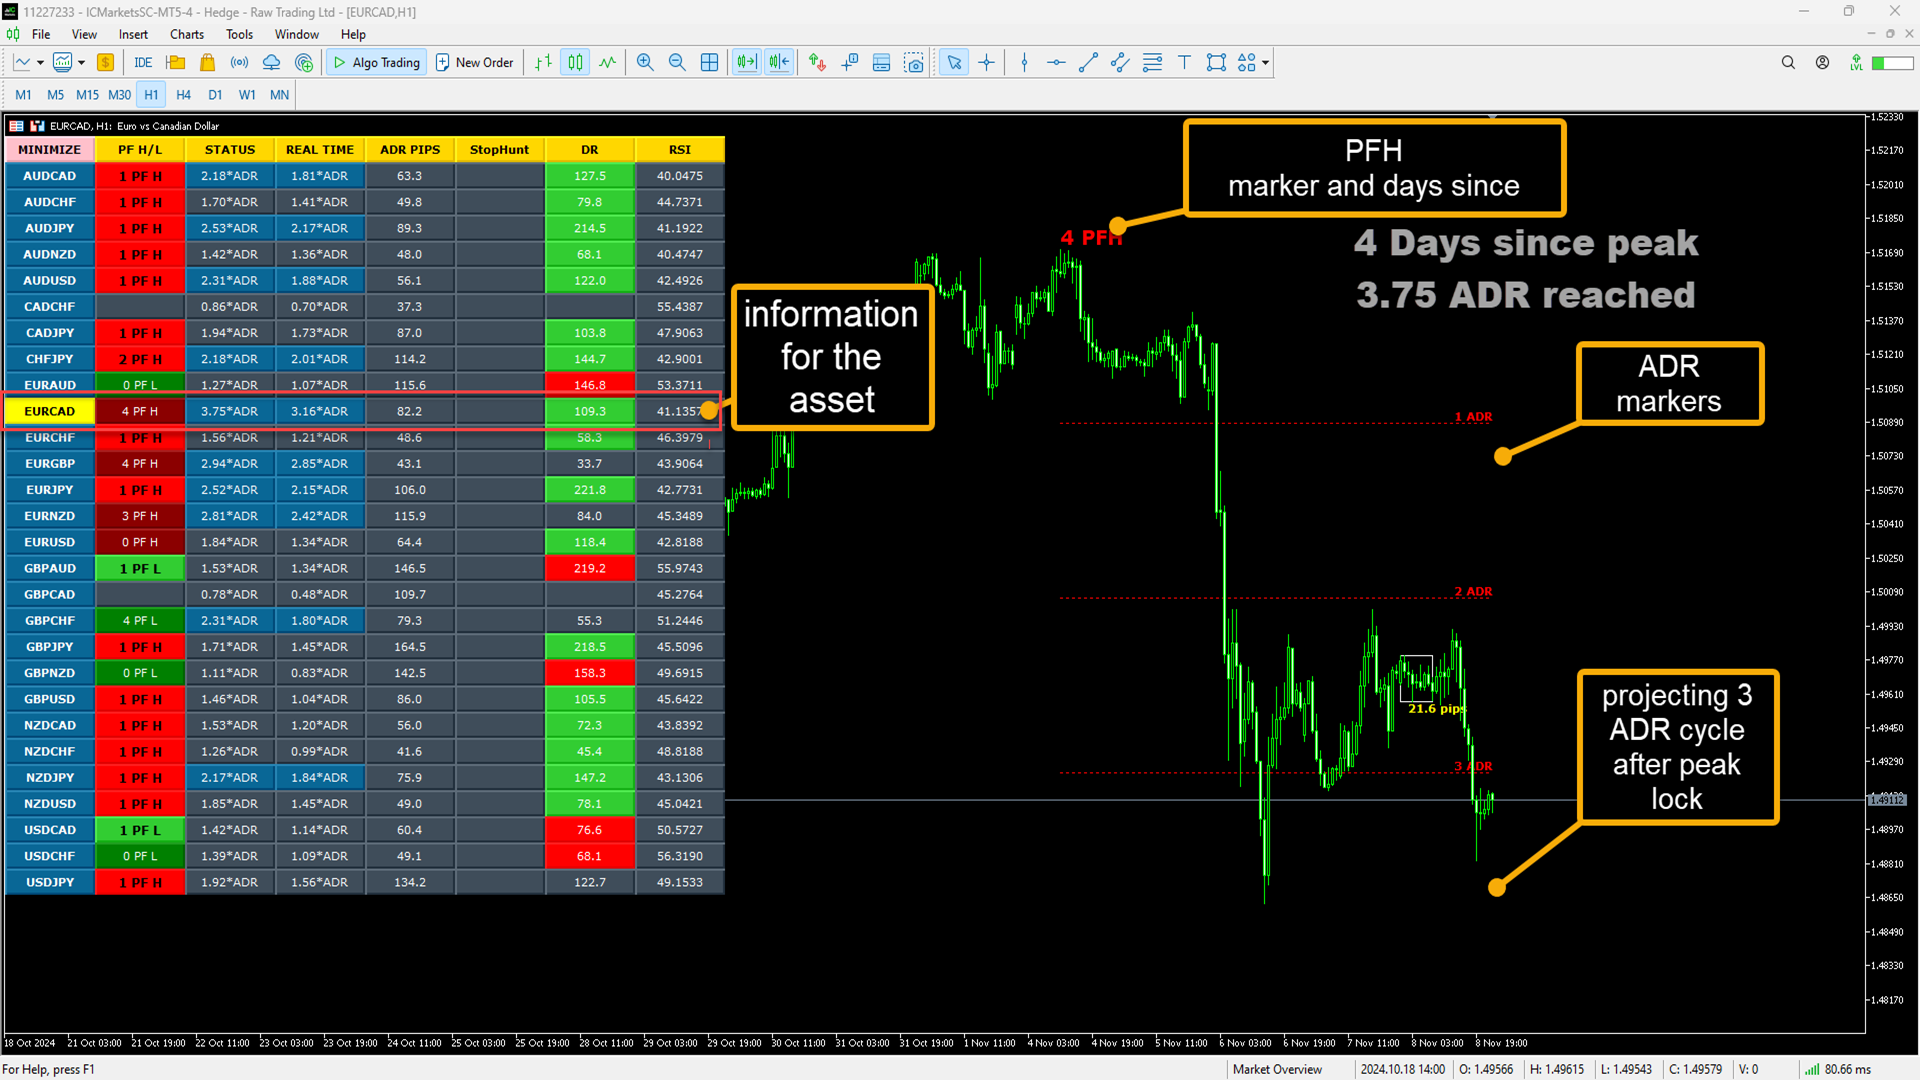
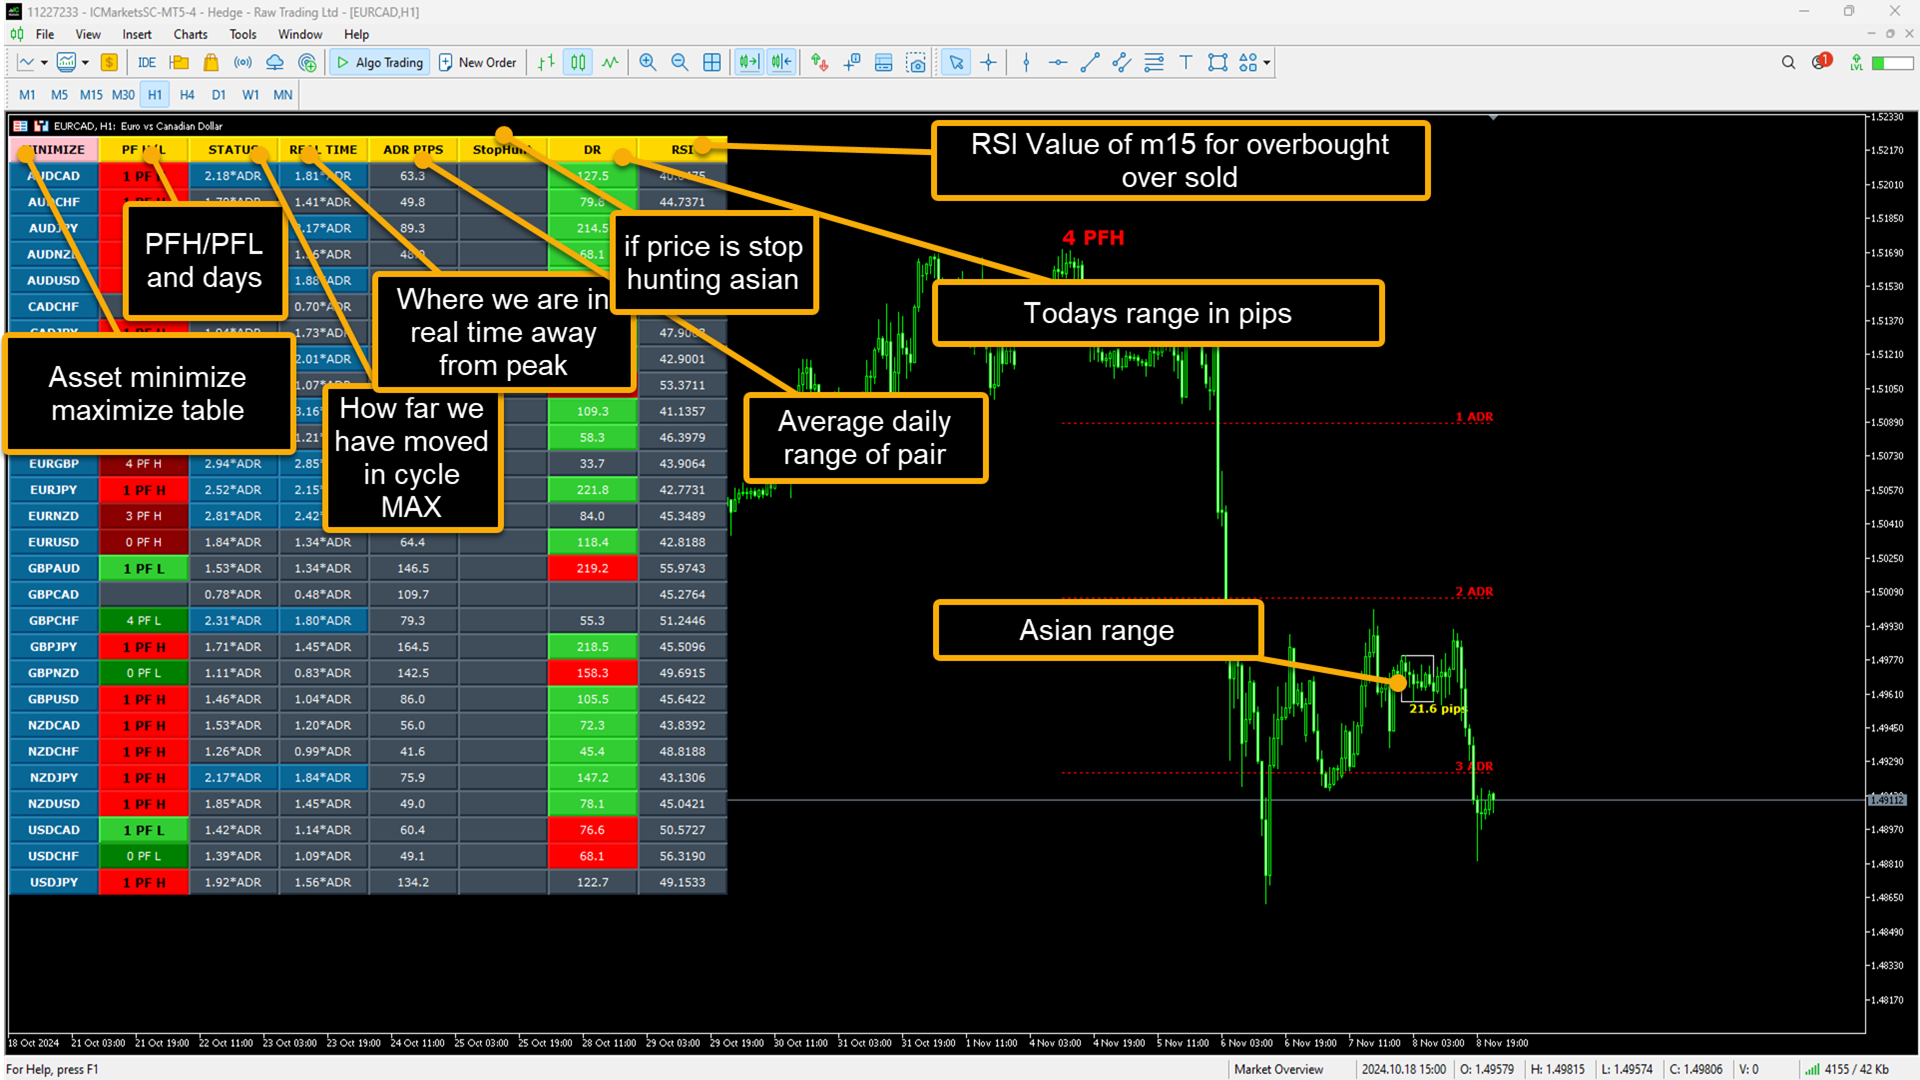
This indicator is for people trading the market makers method and is the entry level dashboard for that strategy is available for both mt4 and mt5. its a market scanner in real time showing peak formations highs and lows how far from them we are in ADR based on the 3 levels of 3 ADR cycle real time and max information. Asian Ranges , cycle projections . stop hunt information Daily range of pair ADR of the pair also and also real time rsi value of the pair for entry time frame of m15.
Key Features:
- Ideal for Beginners: Tailored for newcomers, with recent enhancements for superior performance.
- Inclusive Training Video: Simplify your learning curve with our detailed training materials.
- Advanced Market Maker Cycle Insight: Gain strategic insights into market maker cycles.
Additional Tools on MQL5 from us :
- Order Block Indicator: A must-have for comprehensive trend analysis, available for separate purchase on my MQL5 profile.
- Trade Manager: Discover our Trade Manager to effectively manage your trades and calculate risk, enhancing your trading efficiency.
Support and Solutions:
- Dedicated Assistance: For support, connect with us via my MQL5 profile.
- Diverse Trading Portfolio: Explore a range of trading tools, including ICT indicators and order block tools.
Exclusive Offer Details:
- Seasonal Limited-Time Deal: Only a few licenses available at this special price, perfect for those starting in trading.
Template Installer and Training: