MT5 Macd Divergence Scanner
- インディケータ
- Krzysztof Janusz Stankiewic
- バージョン: 1.0
- アクティベーション: 5
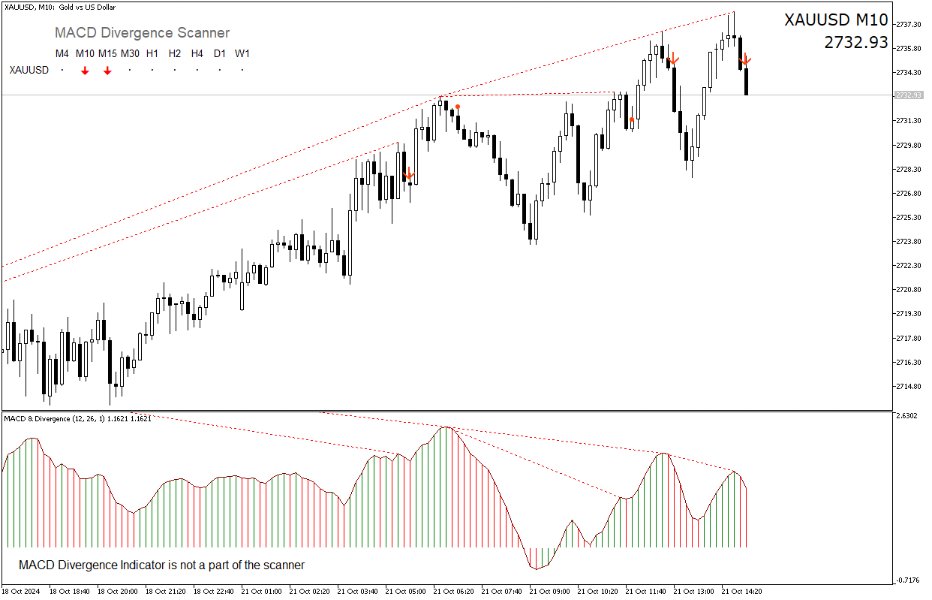
This indicator helps you monitor multiple currency pairs and timeframes all at once. It displays the occurrence of divergences between price and the MACD indicator in a clear and easy-to-read table. Monitoring multiple timeframes and currency pairs in one place helps traders identify a divergence without needing to switch between charts. Divergences can be bullish or bearish. For example, if the price forms a higher high while the MACD forms a lower high, this indicates bearish divergence. On the other hand, if the price forms a lower low while the MACD forms a higher low, this indicates bullish divergence.
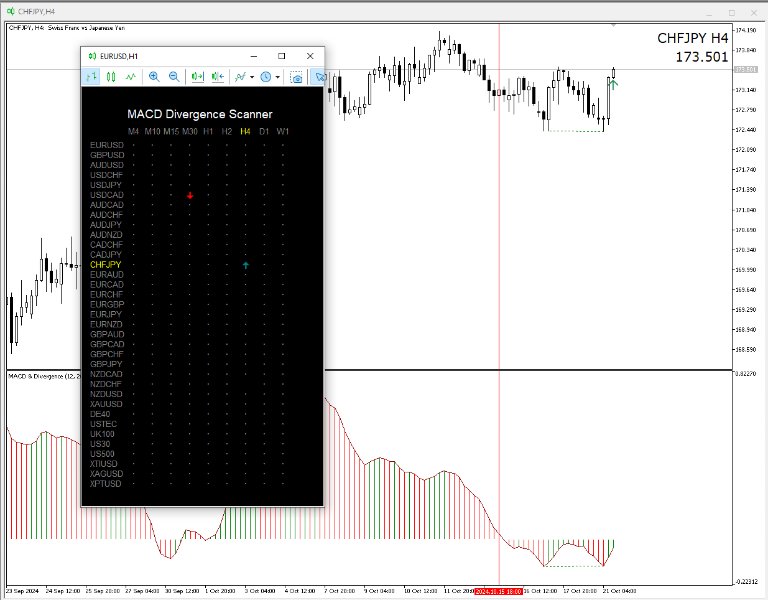
Each symbol (such as EURUSD, GBPUSD) is listed in the table on the left, while different timeframes (like M5, H1, D1) are shown across the top. The dots in the table indicate that no divergence is detected. If an arrow appears, it suggests a signal based on a divergence. Arrows help traders easily identify key moments when the market may be changing direction. A red arrow indicates a potential sell, while a green arrow suggests a potential buy. The appearance of an arrow is accompanied by an alert being sent to the terminal. Any potential trade should be supported by additional conditions, such as conducting higher timeframe analysis, using moving averages, or identifying support and resistance levels.
Each symbol (such as EURUSD, GBPUSD) is listed in the table on the left, while different timeframes (like M5, H1, D1) are shown across the top. The dots in the table indicate that no divergence is detected. If an arrow appears, it suggests a signal based on a divergence. Arrows help traders easily identify key moments when the market may be changing direction. A red arrow indicates a potential sell, while a green arrow suggests a potential buy. The appearance of an arrow is accompanied by an alert being sent to the terminal. Any potential trade should be supported by additional conditions, such as conducting higher timeframe analysis, using moving averages, or identifying support and resistance levels.
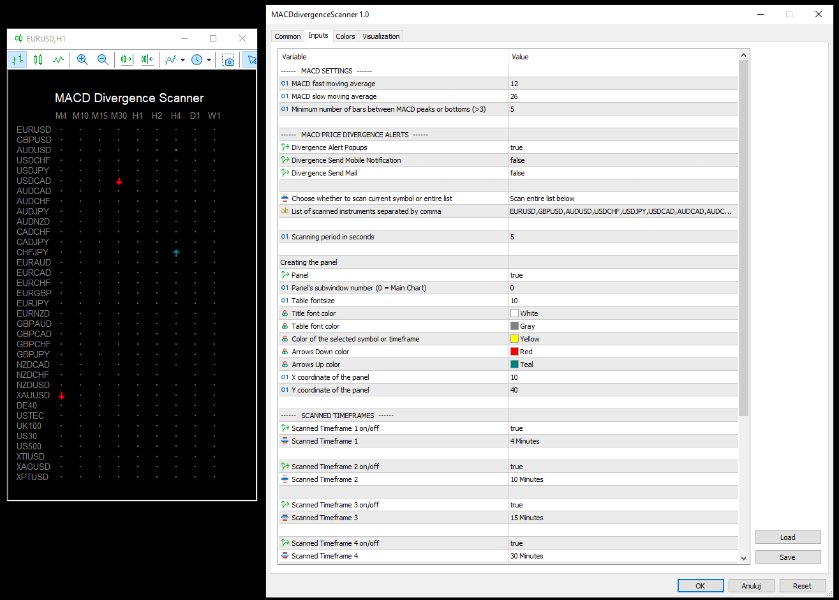
The indicator can be used in two modes: one that scans only the chart instrument, and another that scans a list of symbols. The user provides the list in a menu by separating each symbol name with a comma, without spaces. In the latter case, it is best to use a separate window that can be detached from the main MT5 window.
The indicator was successfully tested on 35 instruments and 9 timeframes.
