Vwap Pro MT4
- インディケータ
- Mudit Agarwal
- バージョン: 1.2
- アクティベーション: 10
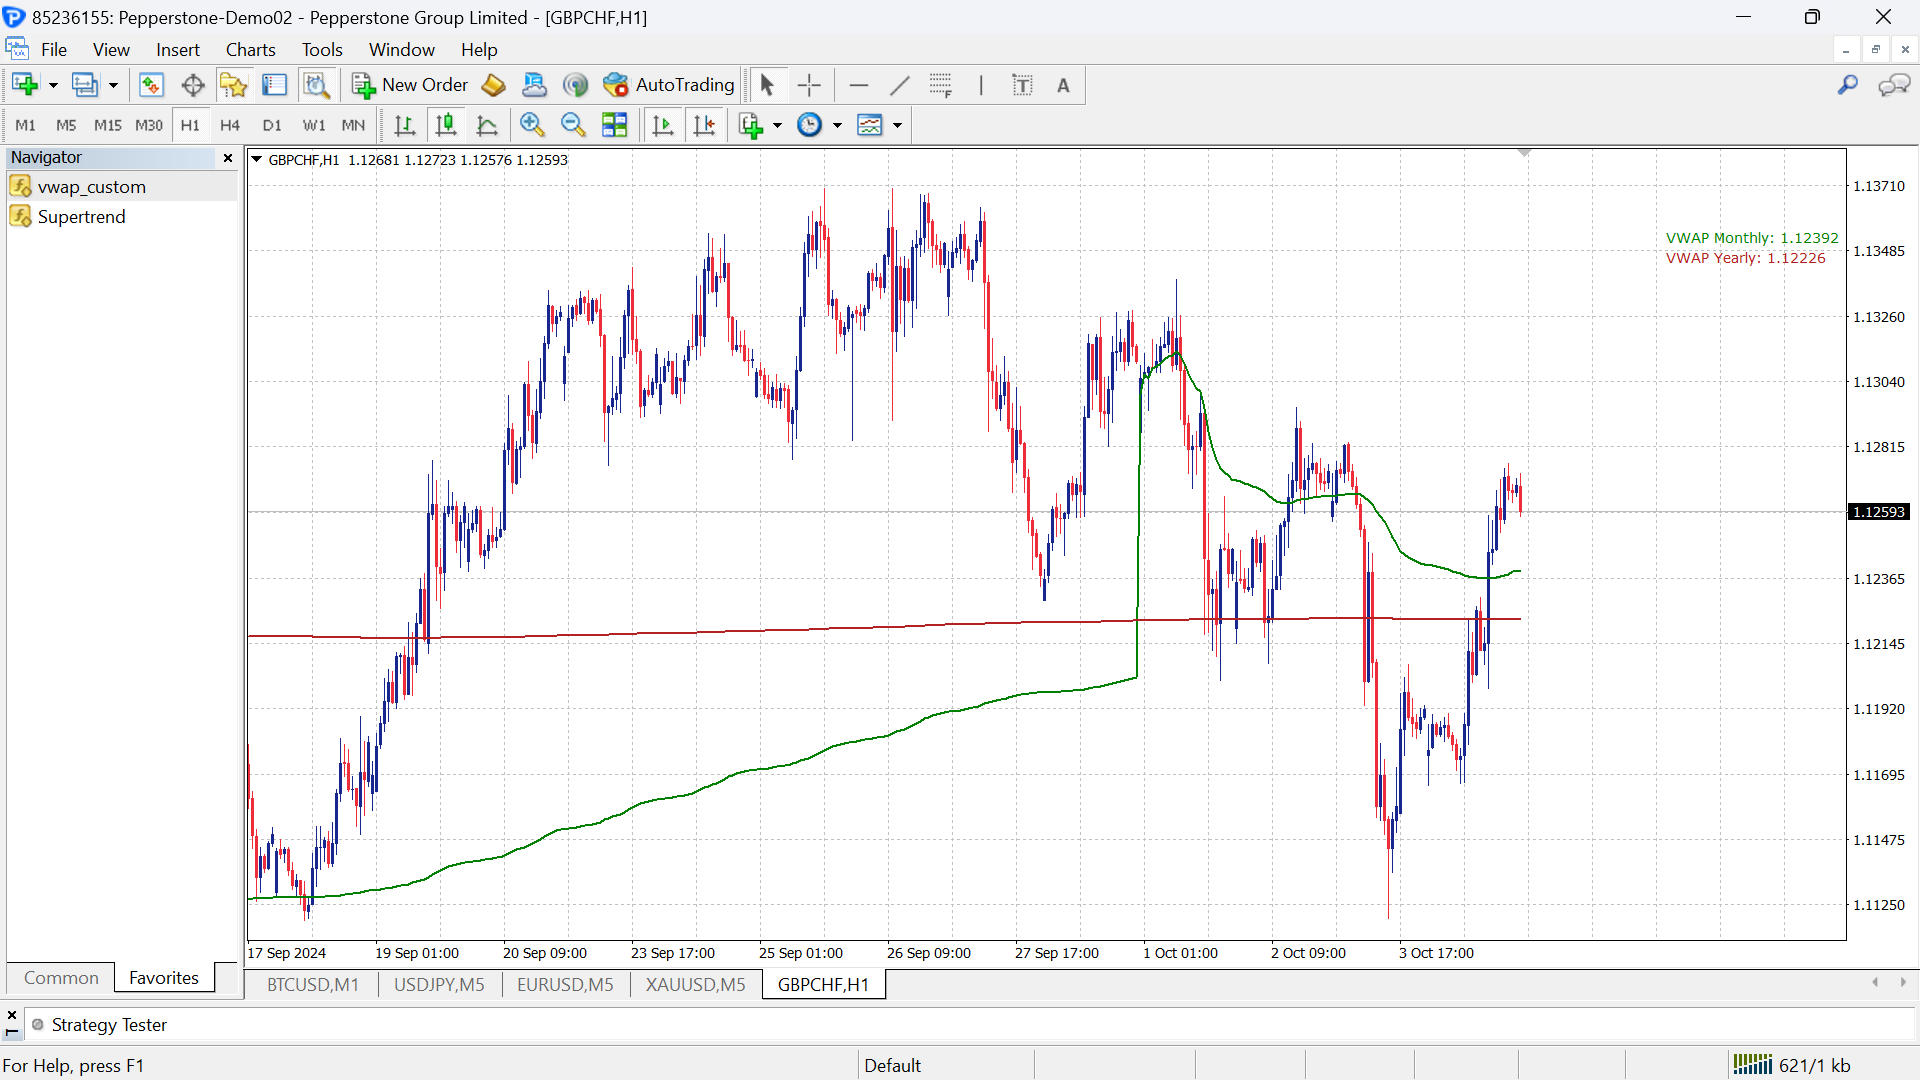
This VWAP indicator is one I personally use in all of my trading strategies. Over time, I’ve found it to be one of the most accurate and reliable indicators for tracking price action and volume relationships.
The best part about VWAP is that it remains consistent across all timeframes, so you don't have to worry about selecting the optimal timeframe or adjusting inputs.
Key features-
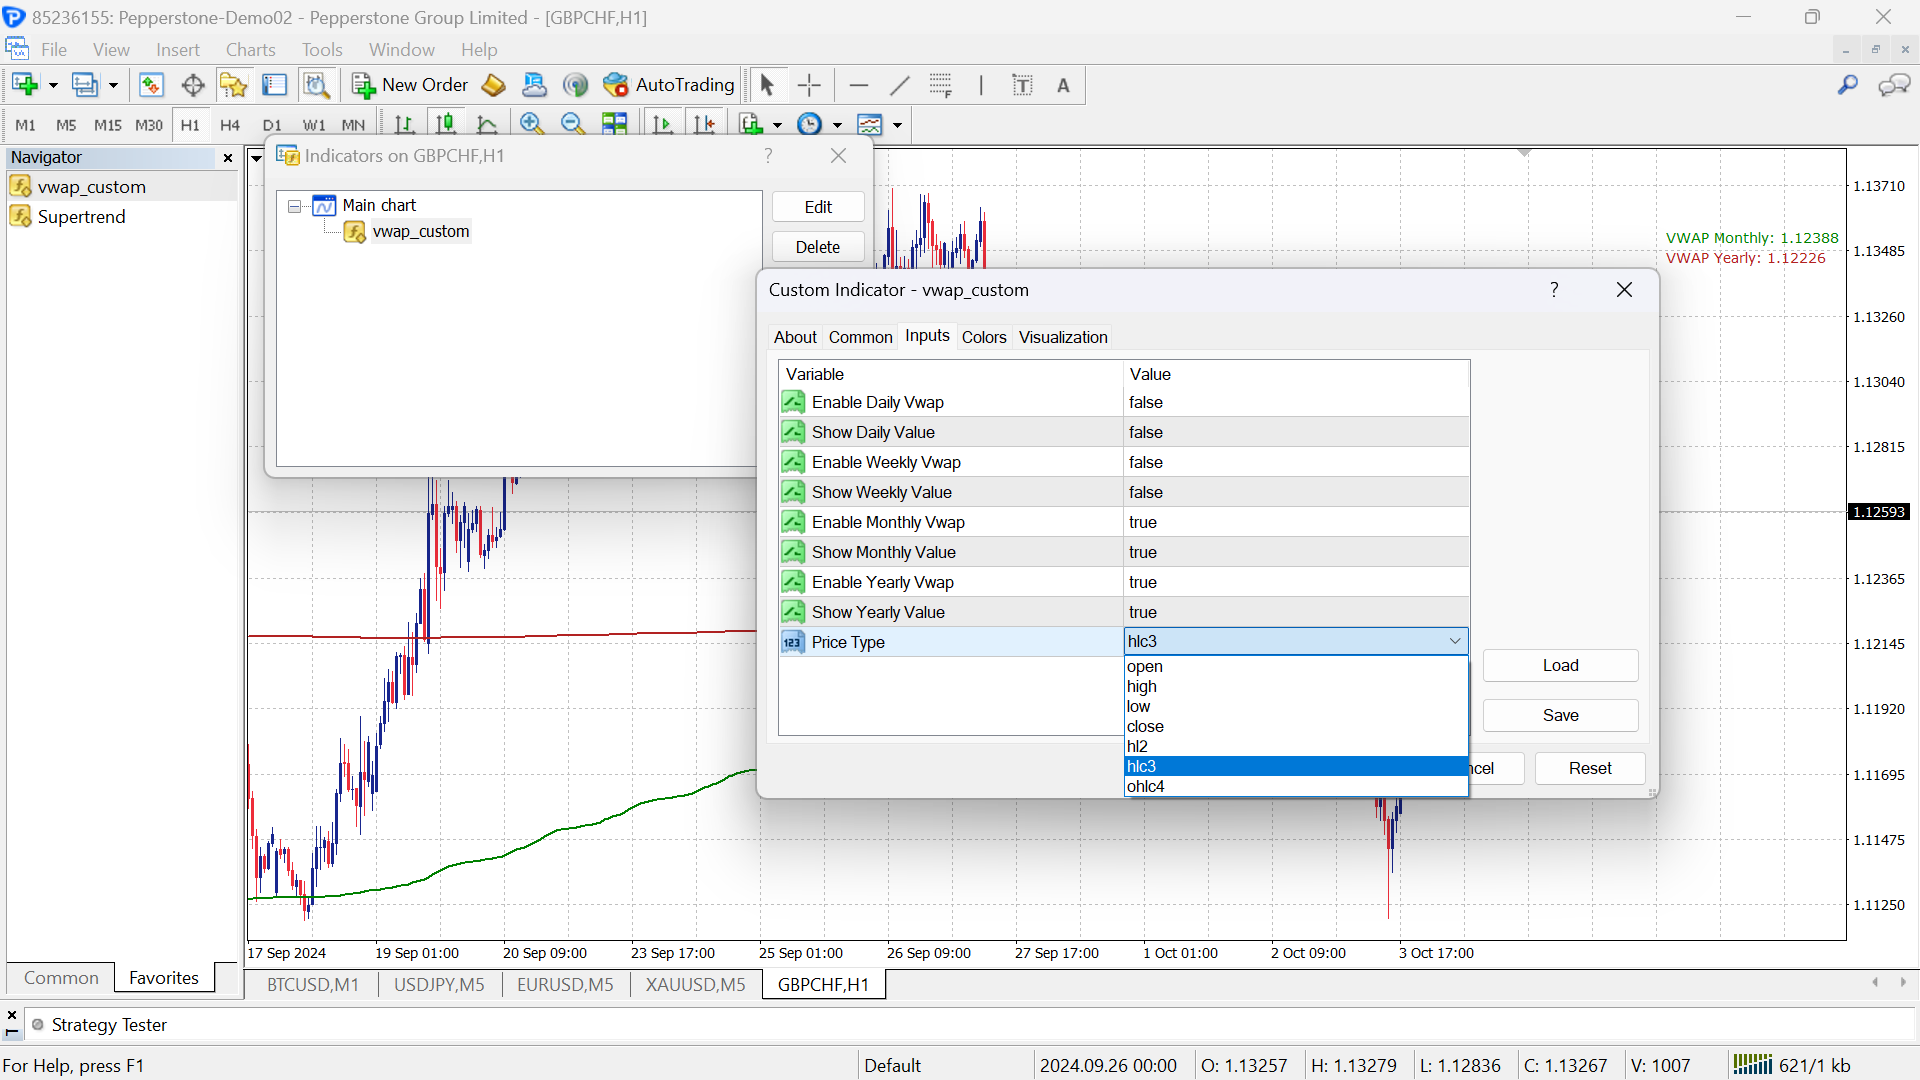
- Multiple VWAP Options: Offers 4 types of VWAP—daily, weekly, monthly, and yearly. Each comes with an adjustable buffer, making it ideal for EA integration. The options for input 'Price Type' has been defined in following way-
enum PRICE_TYPE {
    OPEN=0, //open
    HIGH=1, //high
    LOW=2, //low
    CLOSE=3, //close
    HIGH_LOW=4, //hl2
    CLOSE_HIGH_LOW=5, //hlc3
    OPEN_CLOSE_HIGH_LOW=6 //ohlc4
};
- Optimized for Performance: The code has been optimized for faster load times, ensuring smooth and efficient operation even in volatile market conditions.
- Accuracy: Delivers exceptionally accurate VWAP values. While I use it with my broker’s server in GMT, the results should not differ much across different time zones.
- Proven Reliability: I've relied on this indicator for over a year, and it has proven to be both stable and dependable in my personal trading.
- Enhanced Clarity: Clear and responsive data points to help you spot key price levels with ease.
I hope this indicator enhances your trading experience as much as it has mine. It’s designed to provide reliable, actionable data to help you make informed decisions. If you have any questions, feel free to reach out.
Thanks and Regards,
Mudit Agarwal