TRF Supertrend 4 AM Ind MT4
- インディケータ
- Andriy Matviyevs'kyy
- バージョン: 1.0
A fair assessment, reviews and comments are the best gratitude to the author of this product for the work done.
I will be glad to any constructive suggestions and comments.
The presented indicator is a trend indicator that allows you to open a position at the very beginning of a significant price movement.
The most important qualities of the presented indicator are:
- The ability to follow the trend for as long as possible to get all the potential profit;
- Minimization of potential losses when the trend reverses or a significant correction.
The classic definition of a trend implies a certain sequence of peaks or troughs on the price chart, depending on its direction.
If the trend is upward, then each subsequent peak or trough should be higher than the previous ones.
A similar situation with a downward trend, where each new minimum or maximum should lie below the previous ones. Any movement against the main trend is a correction.
The main idea of the presented indicator is to follow the trend at a certain distance, allowing you to ignore minor corrections that may occur within such a trend.
This trend following method is called Trailing Reverse Filter (TRF).
The presented indicator is a variation of TRF that uses the following parameters to evaluate corrections:
- Maximum and minimum price values for the selected period;
- Sensitivity based on the ATR (Average True Range) indicator;
- Smoothing based on the MA (Moving Average) shifted by a specified number of periods.
The indicator allows you to notify the user of its signals by sending messages to the terminal and e-mail.
The indicator does not repaint or recalculate.
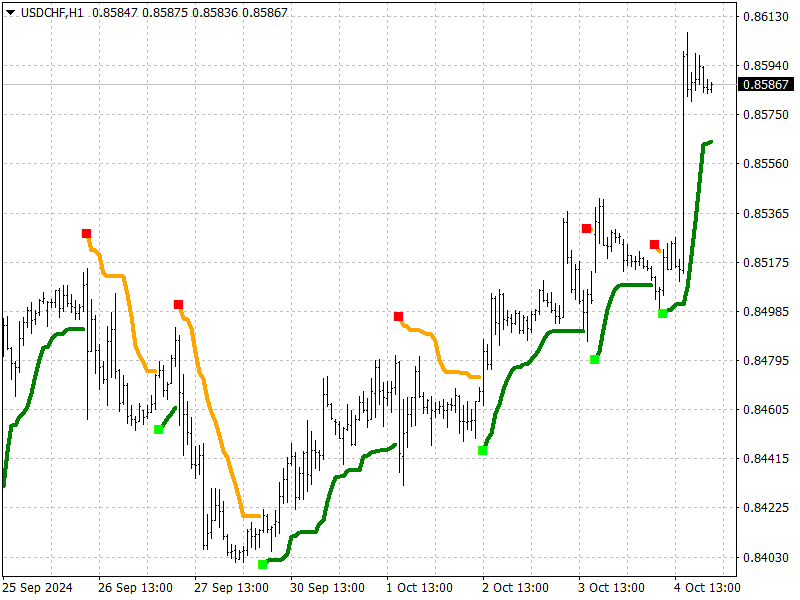
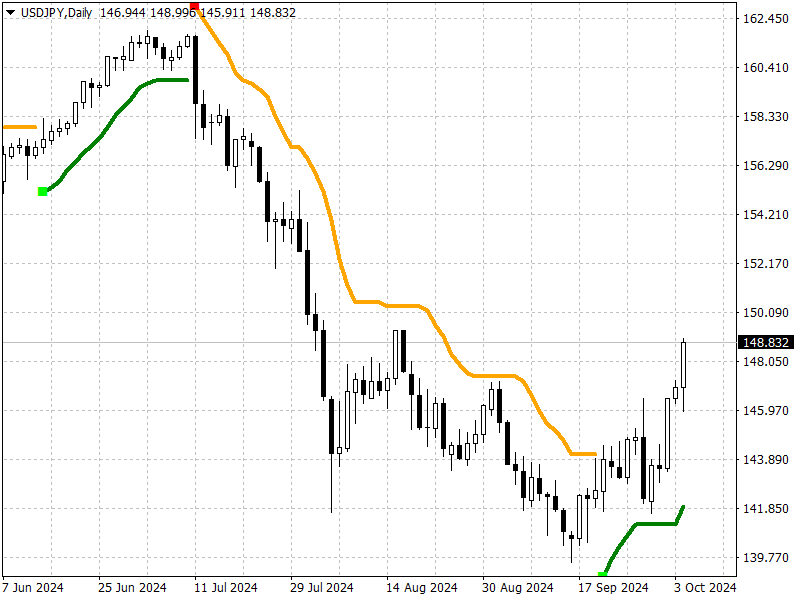
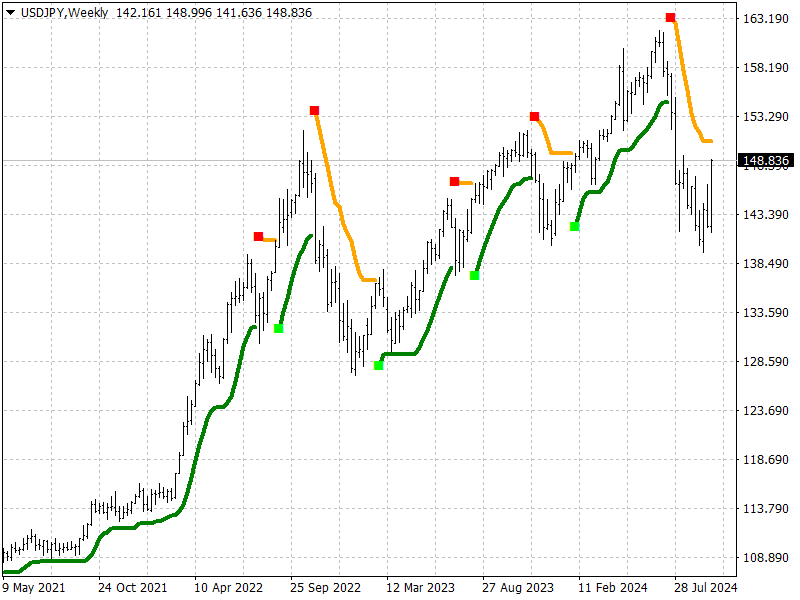
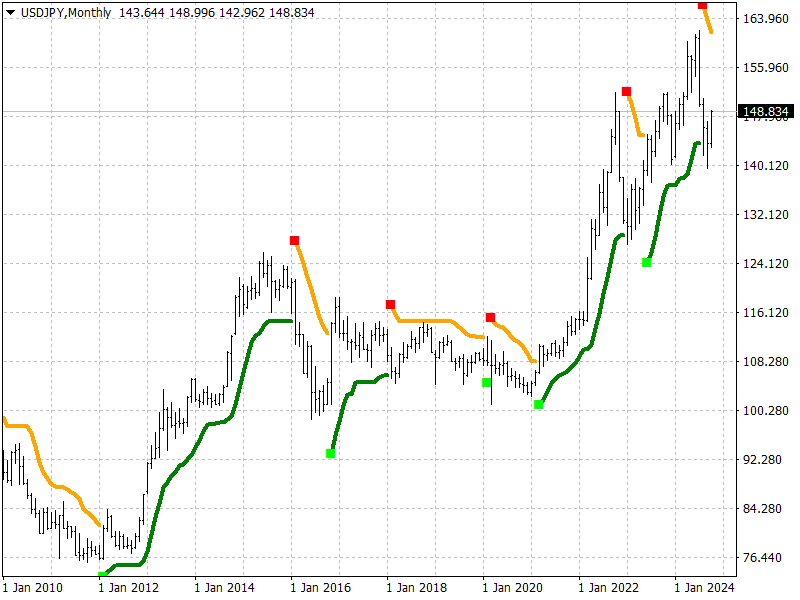
Signals when working with the indicator:
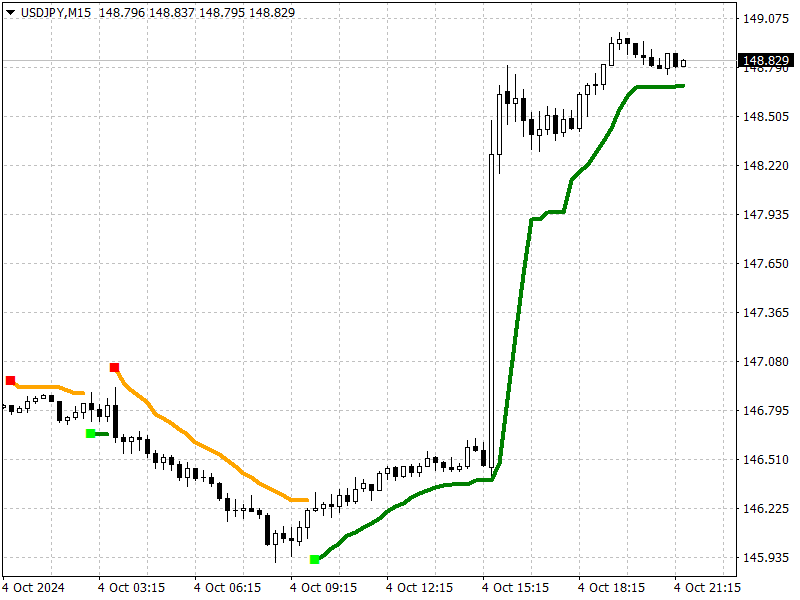
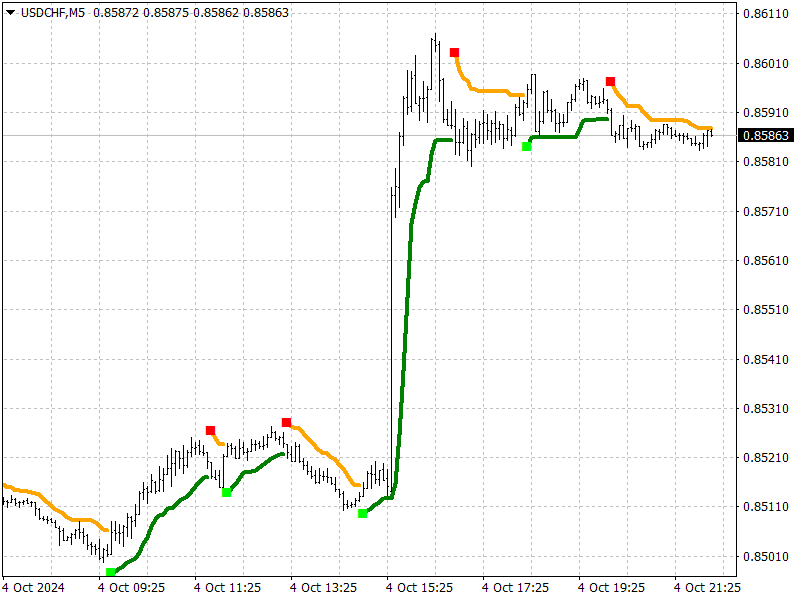
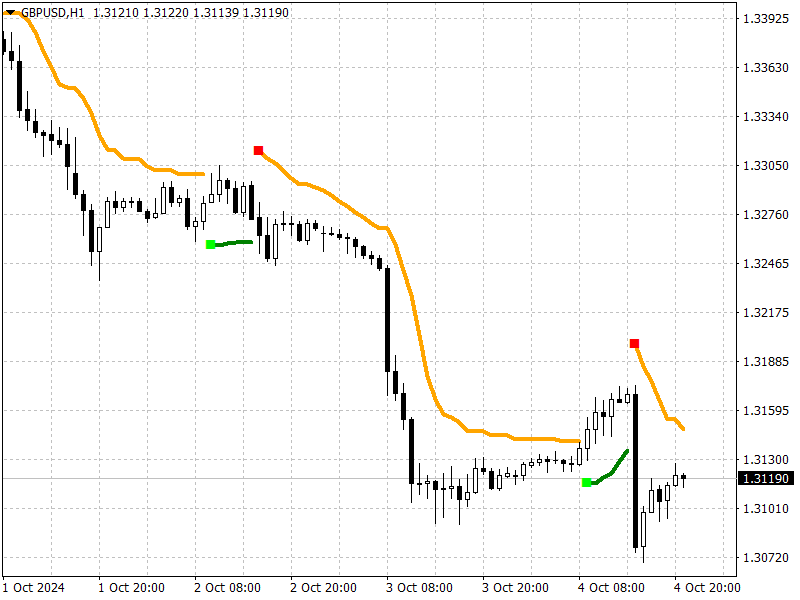
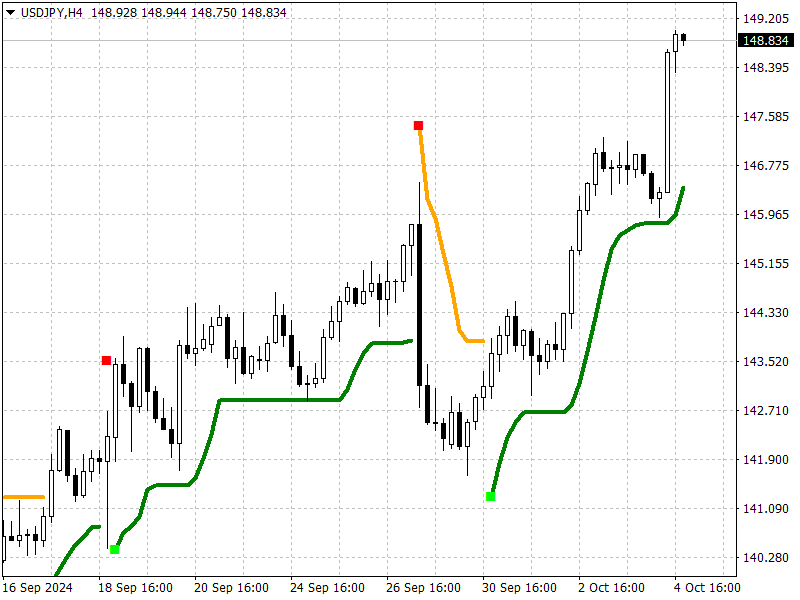
- The appearance of a red dot above the price chart is a possible start of a downward trend;
- The appearance of a green dot below the price chart is a possible start of an upward trend;
- Line - SAR levels.
Configurable indicator parameters:
- Price_for_control - select the price type by which support/resistance lines are monitored;
- Period_for_limits - the data period for which the maximums and minimums of prices participate in the formation of the indicator (the longer, the less sensitive the indicator);
- Sensitivity - indicator sensitivity to volatility (the longer, the less sensitive the indicator);
- Sensitivity_Coefficient - coefficient for indicator sensitivity to volatility (the longer, the more sensitive the indicator);
- Smoothing_Period - indicator smoothing;
- Smoothing_Shift - shift for indicator smoothing;
- Smoothing_Method - indicator smoothing method;
- Number_of_bars_calculated - number of bars on which the indicator will be calculated and displayed (> 300);
- Alerts - displays a dialog box containing information about the indicator signal;
- Send_Notification - sends a notification to mobile terminals whose MetaQuotes ID is specified in the settings window on the "Notifications" tab;
- Send_Mail - sends an email to the address specified in the settings window on the "Mail" tab.
Best wishes,
Andriy Matviyevs'kyy