FractalZones RUS
- インディケータ
- GEORGI ANIKIN
- バージョン: 1.4
- アップデート済み: 8 10月 2024
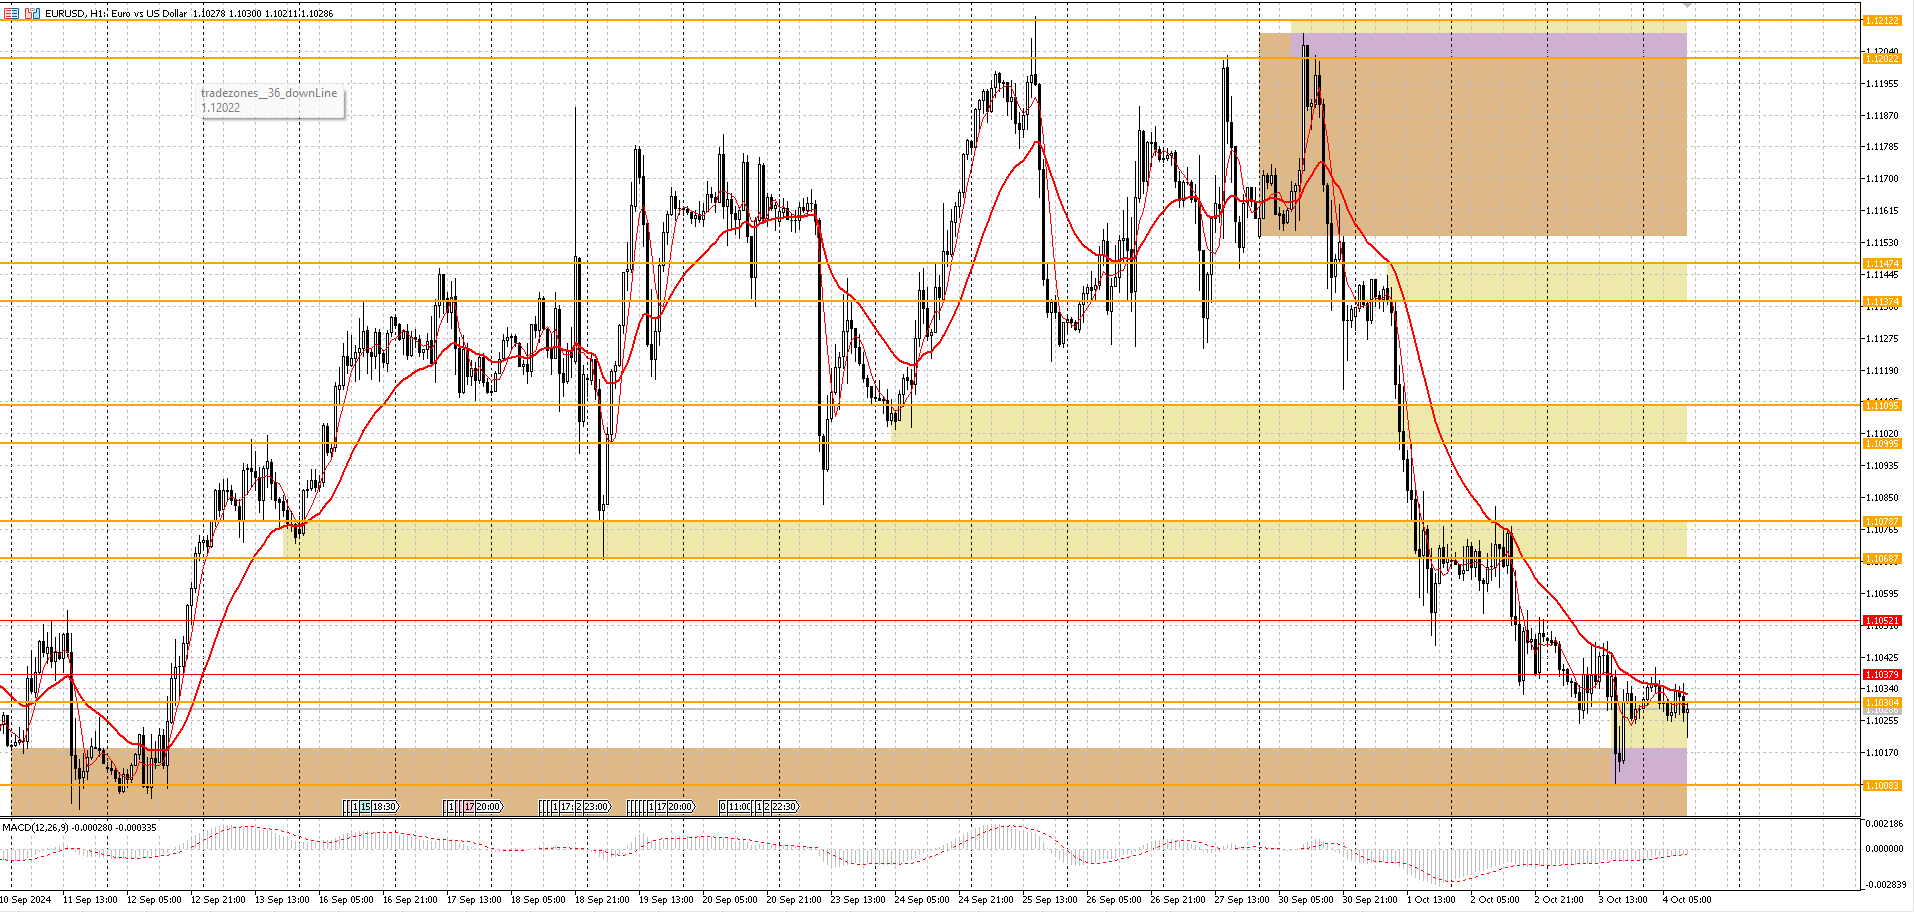
Данный индикатор рисует торговые зоны по фракталам со старших периодов, что упрощает торговлю по уровням.
На одном графике данный индикатор рисует два типа торговых зон.
Например если текущий период - H1, то торговые зоны будут искаться по фракталам с H4 и с D1.
В стандартных настройках фрактальные зоны с H4 будут рисоваться желтым цветом, а с D1 - зеленым.
При наложении зон, происходит смешивание цветов в месте пересечения зон. Как данную вещь поправить, я не знаю в данный момент.
Принцип поиска фрактальных зон
Зоны находятся по фракталам. В ходе перебора фракталов находятся фрактальные зоны. При проверке очередного фрактала, проверяется, имеется уже данная зона, или нет. Если данной зоны нет, то создается новая зона. Высота зоны определяется по высоте тени фрактальной свечи. Если высота зоны слишком маленькая, то она увеличивается до минимальной высоты.
Принцип отображения фрактальных зон
Для каждого периода идет поиск фрактальных зон со старших периодов:
| Период | Поиск младших зон | Поиск старших зон |
|---|---|---|
| H1 | H4 | D1 |
| H4 | D1 | W1 |
| D1 | W1 | MN1 |
| W1 | MN1 | - |
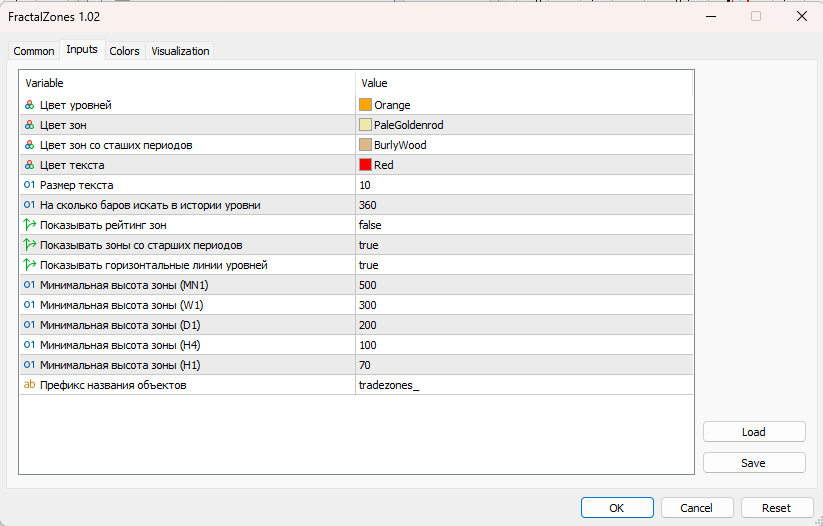
Описание параметров
В настройках можно менять следующие параметры:
- Цвет уровней
- Цвет зоны со следующего периода
- Цвет зоны со старшего периода
- Цвет текста
- Размер текста
- За какое количество баров искать фрактальные зоны
- Показывать рейтинг зоны
- Показывать зоны старших периодов
- Минимальная высота для каждой зоны
- Префикс названия объектов
Рейтинг зон
Я не знаю, на сколько нужен рейтинг. Это пока эксперимент. Под рейтингом зоны я подразумеваю сколько фракталов задевало фрактальную зону. Если не будет необходимости в этом, то уберу рейтинг.

Классные уровни, мне нравится. А для мт4 нету? Тоже бы не помешало.