Object to Buffer
- インディケータ
- Christian Snijder P V Triychenko
- バージョン: 1.16
- アップデート済み: 3 10月 2024
- アクティベーション: 10
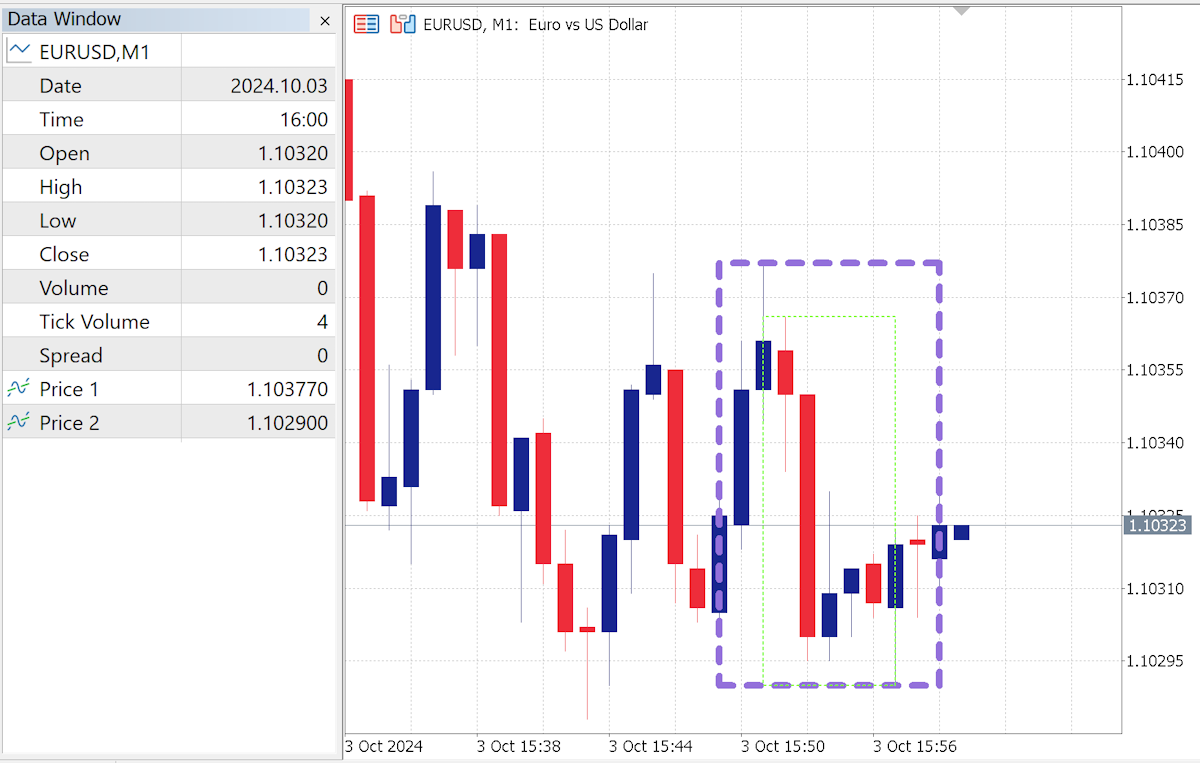
Want to create an Expert Advisor (EA) using an indicator that doesn’t store the required data in a buffer (visible in the Data Window) and only draws objects on the chart?
This solution captures chart objects and places them into buffers, allowing you to create an EA—whether you're using EA Builder Pro or writing code with iCustom—by selecting the correct values using those buffers (modes).
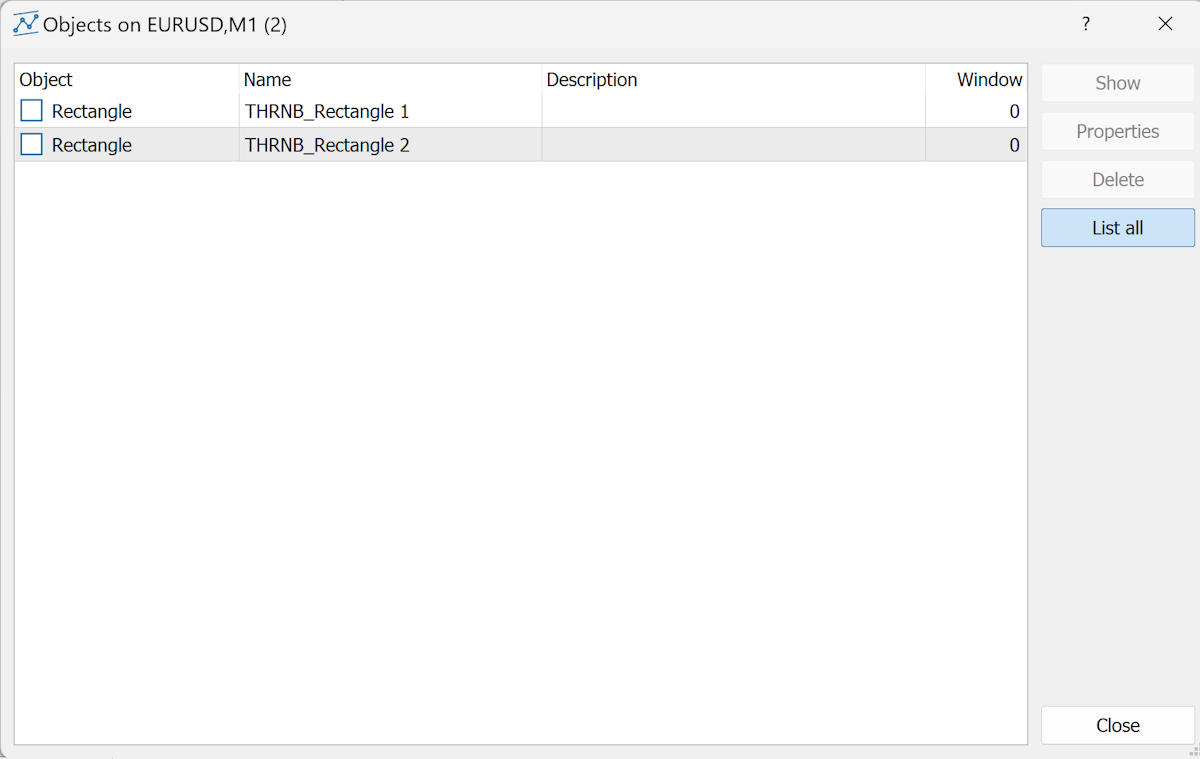
It works with any object visible in the Object List that has a unique Name or Description, such as:
- Trend Lines
- Arrows
- Rectangles
- Labels
- And more.
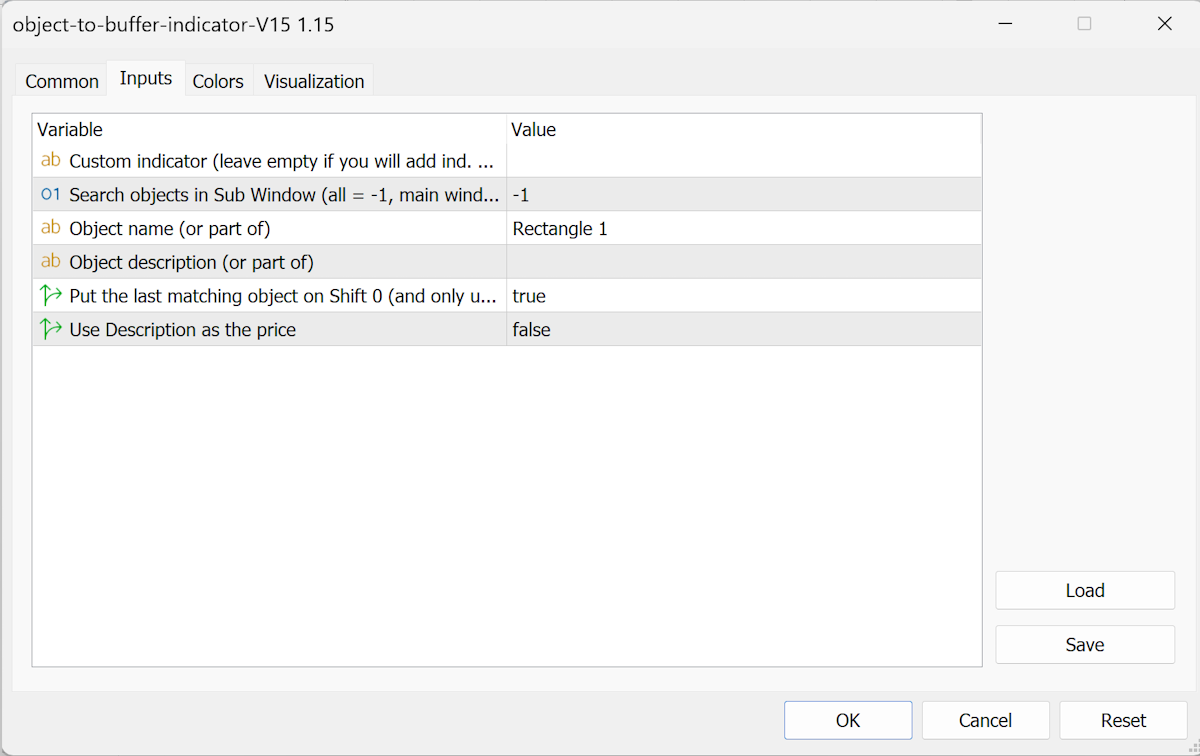
You can also retrieve the most recent object on the chart with a matching name, which is helpful when names overlap, and you're only interested in the object closest to the current candle.
When entering the name of a Market Place indicator, please enter the Custom Indicator Input as 'Market\Name of the Indicator'.
If you want to manually adjust the indicator parameters of the indicator which draws objects to the chart, you can simply leave the Custom Indicator Input empty and then add the indicator which draws the objects to the chart, manually.