• 概要
  • レビュー
  • コメント

The Forex Dashboard

What’s the Forex Dashboard All About?

Alright, so you’re diving into the world of forex trading, and you’ve probably heard about dashboards. But what are they exactly? Think of it as your command center for keeping tabs on multiple currency pairs all at once. It’s like having a radar that tells you what’s happening in the forex market without having to sift through tons of charts and data.

What Does It Show You?

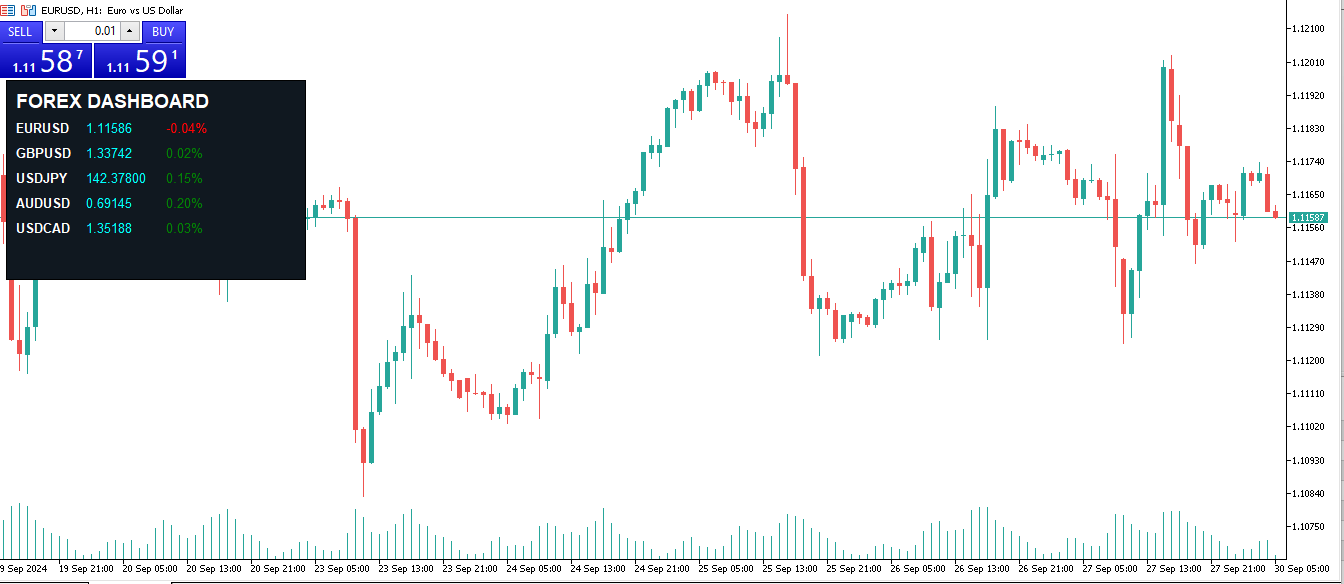
  1. Currency Pairs: You’ll see a list of popular currency pairs, like EUR/USD (Euro to US Dollar), GBP/USD (British Pound to US Dollar), and USD/JPY (US Dollar to Japanese Yen). These pairs show how much one currency is worth compared to another.

  2. Current Prices: The dashboard gives you the live market price for each pair. This is the price you can buy or sell them at right now.

  3. Price Change: You’ll also get a quick look at how much the price has changed from the previous day's close, expressed as a percentage. It’s a super handy way to see if a pair is moving up or down.

  4. Color Coding:

    • Green means the price has gone up (woohoo!).
    • Red means it’s gone down (uh-oh).
  5. Customizable Looks: You can tweak the colors and layout to make it visually appealing for you. Personalizing it makes it easier to focus on the information that matters most to your trading style.

How to Get the Most Out of It

  1. Set It Up: Once you’ve got the dashboard up and running in your trading platform (like MetaTrader), attach it to your chart.

  2. Pick Your Pairs: Choose which currency pairs you want to follow. You can start with the basics like EUR/USD, GBP/USD, and USD/JPY.

  3. Keep an Eye on Changes: Watch those current prices and percentage changes. This info is crucial for making informed trading decisions.

  4. Spot Trends: Use the dashboard to identify trends. If a currency pair keeps showing positive changes, it might be time to consider buying.

  5. Stay Updated: The dashboard updates regularly (you can set the interval). This means you’re always looking at fresh data, which is super important in the fast-moving forex market.

Wrap-Up

The Forex Dashboard is a powerful tool for anyone serious about trading. It helps you track multiple currency pairs in one glance, giving you the insights you need to make smart trading choices. Don’t be afraid to play around with it, pick your favorite pairs, and make it visually appealing. It can be a game-changer for your trading journey!


おすすめのプロダクト
MetaCOT 2 is a set of indicators and specialized utilities for the analysis of the U.S. Commodity Futures Trading Commission reports. Thanks to the reports issued by the Commission, it is possible to analyze the size and direction of the positions of the major market participants, which brings the long-term price prediction accuracy to a new higher-quality level, inaccessible to most traders. These indicators, related to the fundamental analysis, can also be used as an effective long-term filter
To get access to MT4 version please click here . - This is the exact conversion from TradingView: "Stochastic Momentum Index" By "UCSgears". - This is a popular version of stochastic oscillator on tradingview. - This is a light-load processing and non-repaint indicator. - Buffers are available for the lines on chart. - You can message in private chat for further changes you need. Thanks for downloading
O indicador duplo estocástico RSI Forex é uma modificação do oscilador estocástico para a plataforma MetaTrader 5. INFORMAÇÕES SOBRE O INDICADOR O indicador Forex estocástico duplo implementa um estocástico duplo aplicado ao RSI, usando níveis flutuantes em vez de fixos para avaliar sobrevenda e sobrecompra. Nos casos em que o período RSI é <=1, obtém-se apenas um estocástico duplo. Você pode usar suavização adicional dos resultados (a EMA integrada é usada para isso). O conjunto habitu
MT4版  |  FAQ Owl Smart Levels Indicator は、 Bill Williams の高度なフラクタル、市場の正しい波構造を構築する Valable ZigZag、エントリの正確なレベルをマークする Fibonacci レベルなどの一般的な市場分析ツールを含む 1 つのインジケーター内の完全な取引システムです。 利益を得るために市場と場所に。 戦略の詳細な説明 インジケータを操作するための指示 顧問-取引助手 プライベートユーザーチャット ->購入後に私に書いて、私はプライベートチャットにあなたを追加し、あなたはそこにすべてのボーナスをダウンロードすることができます 力はシンプルさにあります! Owl Smart Levels 取引システムは非常に使いやすいので、専門家にも、市場を勉強し始めて自分で取引戦略を選択し始めたばかりの人にも適しています。 戦略と指標に秘密の数式や計算方法が隠されているわけではなく、すべての戦略指標は公開されています。 Owl Smart Levels を使用すると、取引を開始するためのシグナルをすばやく確認し、注文を出すため
Stochastic  Reversal  allows you to recognize reversals professionally. Stochastic Indicator: This technical indicator was developed by George Lane more than 50 years ago. The reason why this indicator survived for so many years is because it continues to show consistent signals even in these current times. The Stochastic indicator is a momentum indicator that shows you how strong or weak the current trend is. It helps you identify overbought and oversold market conditions within a trend.  Rules
This indicator implements the logic behind Traders Dynamic Index to the classic MACD Indicator. It helps to find powerful trende changes and ignore meaningless ones. It is simply the classic MACD indicator plotted with volatility bands on top designed with the sole purpose of being able to ignore trend changes that do not follow an over-extension or over-contraction of the market. The indicator alerts on trend changes after the volatility bands have been breached and implements alerts of all ki
Pipfinite creates unique, high quality and affordable trading tools. Our tools may or may not work for you, so we strongly suggest to try the Demo Version for MT4 first. Please test the indicator prior to purchasing to determine if it works for you. We want your good reviews, so hurry up and test it for free...we hope you will find it useful. Combo Channel Flow with Strength Meter Strategy: Increase probability by confirming signals with strength Watch Video: (Click Here) Features Detects ch
Leave a review for this product, and receive another "Free" product that you choose. You can see my other products here: https://www.mql5.com/en/users/zakri/seller Trend Detective is an advanced trend detection indicator which shows accurate entry points in direction of trend. It uses smart technology in order to detect entry points, trend changing points, and TP points. It also shows hit rate for current chart using selected parameters. Hit rate for this indicator on different charts can be
40% off. Original price: $50 Advanced Bollinger Bands Scanner is a multi symbol multi timeframe Bollinger bands dashboard that monitors and analyzes the Bollinger Bands indicator from one chart. This panel scans the Bollinger bands indicator in up to 28 configurable instruments and 9 timeframes for price overbought/oversold, price consolidation (Bollinger bands squeeze), and consolidation breakout (squeeze break)  with a deep scan feature to scan all market watch symbols (up to 1000 instrumen
フラットとトレンドを決定するための指標。 価格が2つのヒストグラムと2つの線(赤と青)のいずれかを下回っている場合、これは売りゾーンです。 このバージョンのインジケーターを購入するときは、1つの実際のアカウントと1つのデモアカウント用のMT4バージョン-ギフトとして(受け取るには、プライベートメッセージを書いてください)! 価格が2つのヒストグラムと2つの線(赤と青)のいずれかを上回っている場合、これは購入ゾーンです。 MT4バージョン: https//www.mql5.com/en/market/product/3793 価格が2つの線の間、またはいずれかのヒストグラムのゾーンにある場合、市場に明確な傾向はありません。簡単に言えば、市場は横ばいです。 インジケーターの動作は、スクリーンショットでより明確に示されています。
The Antique Trend Indicator is a revolutionary trend trading and filtering solution with all the important features of a trend tool built into one tool! The Antique Trend indicator is good for any trader, suitable for any trader both for Forex and binary options. There is no need to configure anything, everything has been perfected by time and experience, it works great during flats and trends. The Antique Trend indicator is a tool for technical analysis of financial markets, reflecting curre
it depends on ATR period to get swing points to help make better trading decisions  blue dot and red dot is the default color scheme of course you can change it later if you'd like  you can change the following : ATR PERIOD  sending notifications number of times to send notifications  sending notifications to your smart phone that's it very simple to use just drag and drop and follow the trend 
GIVE A LOOK TO MY OTHER PRODUCTS ! 100 % PER MONTH PROFIT---- MY NEW SIGNAL HERE ------->   https://www.mql5.com/en/signals/2162238?source=Site+Signals+My# BROKEN TRENDLINE ALERT IS A SIMPLE TOOL INDICATOR. JUST DRAW IN YOUR CHART A DYNAMIC OR STATIC TRENDLINE,AND THE INDICATOR WILL SEND YOU ALERT WHENEVER THE PRICE CROSSES BELOW OR ABOVE YOUR DRAWN TRENDLINE. IT WORKS IN ANY TIMEFRAME AND ANY CHART YOU WANT.JUST GOT A VPS AND DON'T STRESS IN FRONT OF YOUR COMPUTER. FOR ANY KIND OF QUESTION
PipFinite Exit Scope MT5
Karlo Wilson Vendiola
4.33 (3)
Did You Have A Profitable Trade But Suddenly Reversed? Exiting a trade is equally important as entering! Exit Scope helps maximize your current trade profit and avoid turning winning trades to losers. Attention Exit Signals are NOT to be used in entering a trade! Exit means closing your trades to avoid correction/reversal which can wipe out existing profit or haunt break-even orders. Please watch presentation (Click Here) Features Generates instant exit signals based on price action, volat
PipFinite Reversal PRO MT5
Karlo Wilson Vendiola
4.73 (26)
The Controversial 5-Step System That Professional Traders Use To Unlock Trading Success! Reversal Pro effectively combines price action, ideal location and reliable statistics in one smart algorithm. Understanding the market in this unique perspective allows you to recognize reversals professionally. Discover The Secret Of Professional Traders Get instant access www.mql5.com/en/blogs/post/716077 Copy & Paste what professional traders are doing right now! How To Trade Step 1: Trade Setu
Noize Absorption Index - is the manual trading system that measures the difference of pressure between bears forces and bulls forces. Green line - is a noize free index that showing curent situation. Zero value of index shows totally choppy/flat market.Values above zero level shows how powerfull bullish wave is and values below zero measures bearish forces.Up arrow appears on bearish market when it's ready to reverse, dn arrow appears on weak bullish market, as a result of reverse expectation.
This indicator provides you with MACD formula applied to volume-aware Accumulation/Distribution and OnBalance Volumes indicators. In addition to tick volumes it supports special pseudo-real volumes, synthesized for Forex symbols where real volumes are unknown. More details on the volume surrogates may be found in description of another indicators - TrueVolumeSurrogate and OnBalanceVolumeSurrogate (algorithm of the latter is used internally in MACDAD for AD and OBV calculation before they procee
Elevate Your Trading Experience with Wamek Trend Consult!   Unlock the power of precise market entry with our advanced trading tool designed to identify early and continuation trends. Wamek Trend Consult empowers traders to enter the market at the perfect moment, utilizing potent filters that reduce fake signals, enhancing trade accuracy, and ultimately increasing profitability.   Key Features: 1. Accurate Trend Identification: The Trend Consult indicator employs advanced algorithms and unparall
Технический индикатор Universal Oscillator является комбинацией торговых сигналов самых популярных и широко используемых осцилляторов. Индикатор представлен гистограммами, а также линиями fast и slow MA, что позволяет расширить список получаемых торговых рекомендаций и работать как по тренду, так и в боковом движении рынка. Таким образом, гистограммы позволяют определить момент пробоя ценовых значений и движение в новой фазе рынка, а линии указывают на зоны перекупленности и перепроданности.  Ос
Supertrend indicator uses a combination of a moving average and average true range to detect the trend of a trading instrument. Supertrend indicator for MetaTrader 5 easily shows the trend as a line following the price. Triple SuperTrend Histo indicator  calculate  three supertrends to show the trend as a histogram. Changing the color from red to green means you can BUY , from green to red means you can SELL . Description of the method of drawing a histogram. The price is above the EMA 20
The Gann Box (or Gann Square) is a market analysis method based on the "Mathematical formula for market predictions" article by W.D. Gann. This indicator can plot three models of Squares: 90, 52(104), 144. There are six variants of grids and two variants of arcs. You can plot multiple squares on one chart simultaneously. Parameters Square — selection of a square model: 90 — square of 90 (or square of nine); 52 (104) — square of 52 (or 104); 144 — universal square of 144; 144 (full) — "full"
I really like this indicator. But I made it, so of course I would.. NOW FREE. But please consider supporting me by buying my 2 for sale indicators. You can multiply the weight of each indicator used to give more emphasis on it's value when averaging between the 3. Boost fast TEMA and it can move the indicator faster. Boost slow FrAMA and watch it smooth out. I like to use them as open/close lines and set them up so they move quick, but have the FrAMA smooth it out more.  Check out my other ind
無限からの通貨の強さを測定するためのこの革新的な指標は、長い間取引されているダフ屋やトレーダーにとって不可欠な助手です。 通貨の強さ/弱さを分析するためのシステムは、世界の主要なトレーダーによって市場で長い間知られており、使用されてきました。 任意の裁定取引は、この分析なしでは完全ではありません。 私たちの指標は、互いに関連して基本通貨の強さを簡単に決定します。 これは、インスタント分析を可能にし、最強のエントリポイントを検索し、すべてまたは現在の通貨ペアの折れ線グラフが表示されます。 インジケータは直感的で、すぐに見つけて任意のペアに切り替えることができ、地下室とメインチャートの両方に配置できるモバイルパネルがあります。 通貨の強さの変化の通知のタイマーモードは、トレーダーに電話で通知を受け取る機会を与えます。  通貨パワーメーターインフィニティ指標を使用するためのいくつかの戦略: 1. 通貨の強さの線形表示のチャートを使用して、交差点を新興トレンドの信号として検索します 2. トレンド反転信号が表示された後、強い通貨の方向に頭皮 3. 通貨の強さの発散分析を使用して、
Two Period RSI + Alerts compares long-term and short-term RSI lines, and plots a fill between them for improved visualization. Fill is colored differently according to an uptrend (short period RSI above long period RSI) or a downtrend (short period RSI below long period RSI). Short-term RSI crossing long-term RSI adds a more robust trend confirmation signal than using single period RSI alone. This is a tool to help visualize and confirm RSI trends. We hope you enjoy! Alerts Email, message, and
Meet the Tweezer Hunter, an essential tool for every Forex trader looking to make accurate, trend-following trades. This powerful, intuitive indicator helps traders spot potential trend reversals before they happen, providing a significant advantage in the fast-paced world of Forex trading. The Tweezer Hunter is more than your average tweezer candle indicator; it's designed with a built-in trend identification feature that accurately detects whether the market is bearish or bullish. By integrat
MetaCOT 2 is a set of indicators and specialized utilities for the analysis of the U.S. Commodity Futures Trading Commission reports. Thanks to the reports issued by the Commission, it is possible to analyze the size and direction of the positions of the major market participants, which brings the long-term price prediction accuracy to a new higher-quality level, inaccessible to most traders. These indicators, related to the fundamental analysis, can also be used as an effective long-term filter
This scanner shows the trend values of the well known indicator SuperTrend for up to 15 instruments and 21 time frames. You can get alerts via MT5, Email and Push-Notification as soon as the direction of the trend changes. Important Information You have many possibilities to use the scanner. Here are two examples: With this scanner you can trade a top-down approach easily. If two higher time frames e.g. W1 and D1 are already showing green values (upward trend) but the H12 time frame shows a re
The indicator displays a matrix of indicators across multiple timeframes with a sum total and optional alert. Custom indicators can also be added to the matrix, in a highly configurable way. The alert threshold can be set to say what percentage of indicators need to be in agreement for an alert to happen. The alerts can turned on/off via on chart tick boxes and can be set to notify to mobile or sent to email, in addition to pop-up. The product offers a great way to create an alert when multiple
This MetaTrader 5 indicator helps traders by identifying and marking two important levels on the chart: 1. Previous Day's High (PDH):    - The highest price reached in the market during the previous trading day. 2. Previous Day's Low (PDL):    - The lowest price reached in the market during the previous trading day. How it Works: 1. Initialization:    - When you attach the indicator to a chart, it initializes by calculating the PDH and PDL based on the highest and lowest prices of
Linear Regression Angle is a directional movement indicator which defines a trend at the moment of its birth, and additionally defines trend weakening. The indicator calculates the angle of the linear regression channel and displays it in a separate window in the form of histogram. The signal line is a simple average of the angle. The angle is the difference between the right and left edges of regression (in points), divided by its period. The angle value above 0 indicates an uptrend. The higher
このプロダクトを購入した人は以下も購入しています
指示する     ロシア     -        utilizar con   el indicador の ESP 推奨事項 -   TPSpro トレンド プロフェッショナル版 -   MT5のバージョン 最も重要なことは、将来においても最も重要なことです。 機能のプリンシパル: ゾーンのほとんどは、ベンダーとコンプラドールによってアクティブ化されます。 状況を直感的に把握できるよう、初期の衝動を修正します。 LOGIC AI: MUESTRA zonas (círculos) parabuscar puntos de entrada cuando se activa una plantilla 視覚的に優れた視覚効果があり、最も重要な機能がすべて揃っていることに注意してください。 優れたニベレス/ゾーンの視覚化 (modo MTF) 世界で最も人気のある場所/ゾーンです。これを使用するのに最適な方法です (   TPSproTREND PRO   )。 アルゴリズム プロフェッショナル セパラド パソ ア パソ パラ オペラ それは、オペラハウスやコントラ・デ・エラの指導におい
TPSpro TREND PRO は 、市場を自動的に分析し、トレンドとその各変化に関する情報を提供し、再描画せずに取引にエントリーするためのシグナルを提供するトレンド指標です。 インジケーターは各ローソク足を使用し、個別に分析します。上向きまたは下向きのさまざまな衝撃を指します。通貨、仮想通貨、金属、株、指数の取引への正確なエントリーポイント! バージョンMT5                   インジケーターの完全な説明     RFI LEVELS インジケーター と併用することをお勧めします。 主な機能: レンダリングなしで正確な入力信号! シグナルが表示されると、それは関連性を維持します。これは、シグナルを提供してからそれを変更し、その結果、入金された資金が失われる可能性があるリドローインジケーターとの重要な違いです。より高い確率と精度で市場に参入できるようになりました。矢印が表示された後、ターゲットに到達する (利益確定) か反転シグナルが表示されるまで、ローソク足に色を付ける機能もあります。 STOP-LOSS/TAKE-PROFITゾーンの表示 エントリーポイン
まず第一に、このトレーディングシステムがノンリペイント、ノンリドロー、ノンラグのインジケーターであることを強調する価値がある。これにより、手動取引とロボット取引の両方に理想的なものになっています。 オンラインコース、マニュアル、プリセットのダウンロード。 「スマートトレンドトレーディングシステム MT5」は、新規および経験豊富なトレーダー向けにカスタマイズされた包括的なトレーディングソリューションです。10以上のプレミアムインジケーターを組み合わせ、7つ以上の堅実なトレーディング戦略を備えており、多様な市場状況に対応する多目的な選択肢となっています。 トレンドフォロー戦略:トレンドを効果的に乗り越えるための正確なエントリーとストップロス管理を提供します。 リバーサル戦略:潜在的なトレンドの反転を特定し、トレーダーがレンジ相場を活用できるようにします。 スキャルピング戦略:高速で正確なデイトレードおよび短期取引のために設計されています。 安定性:すべてのインジケーターはノンリペイント、ノンリドロー、ノンラグであり、信頼性の高いシグナルを保証します。 カスタマイズ:個々の取引の嗜好に合わせ
Atbot
Zaha Feiz
4.91 (35)
AtBot: どのように機能し、どのように使用するか ### どのように機能するか MT5プラットフォーム用の「AtBot」インジケーターは、テクニカル分析ツールの組み合わせを使用して売買シグナルを生成します。単純移動平均(SMA)、指数移動平均(EMA)、および平均真実範囲(ATR)インデックスを統合して取引機会を特定します。さらに、Heikin Ashiキャンドルを使用してシグナルの精度を向上させることもできます。 購入後にレビューを残すと、特別なボーナスギフトを受け取ります。 ### 主な機能: - 再描画なし: シグナルはプロット後に変更されません。 - 再描画なし: シグナルは一貫しており、変更されません。 - 遅延なし: 遅延なくタイムリーなシグナルを提供します。 - 多様な時間枠: あらゆる時間枠で使用可能で、取引戦略に合わせることができます。 ### 操作手順: #### 入力と設定: - firstkey (TrendValue): トレンド検出の感度を調整します。 - Secondkey (SignalValue): 売買シグナル生成の感度を定義します。 - ma
まず第一に、この取引インジケーターは再描画されず、再描画されず、遅延しないことを強調する価値があります。これにより、手動取引とロボット取引の両方に理想的なものになります。 ユーザーマニュアル:設定、入力、戦略。 アトミックアナリストは、価格の強さとモメンタムを利用して市場でより良いエッジを見つけるためのPA価格アクションインジケーターです。ノイズや誤ったシグナルを除去し、取引ポテンシャルを高めるための高度なフィルターを備えています。複雑なインジケーターの複数のレイヤーを使用して、アトミックアナリストはチャートをスキャンし、複雑な数学的計算をシンプルなシグナルと色に変換します。これにより、どのような初心者トレーダーでも理解して使用し、一貫した取引の決定を行うことができます。 「アトミックアナリスト」は、新規および経験豊富なトレーダー向けにカスタマイズされた包括的な取引ソリューションです。プレミアムインジケーターとトップノッチの機能を1つの取引戦略に組み合わせ、すべてのタイプのトレーダーにとって汎用性のある選択肢にします。 デイリートレーディングとスキャルピング戦略:高速で正確な
Gold Stuff mt5
Vasiliy Strukov
4.92 (165)
Gold Stuff mt5 は、金専用に設計されたトレンド指標であり、あらゆる金融商品にも使用できます。 インジケーターは再描画せず、遅れません。 推奨時間枠 H1. 設定と個人的なボーナスを得るために、購入後すぐに私に連絡してください!  トレンド スキャナーの強力なサポートを利用して、無料のインジケーターを入手し、プライバシーを守ります。あーみー!   設定 矢印を描く - オンオフ。 チャートに矢印を描く。 アラート - 可聴アラートのオンオフ。 メール通知 - オンオフ。 電子メール通知。 プチ通知 - オンオフ。 プッシュ通知。 次に、色域を調整します。 Gold Stuff mt5 は、金専用に設計されたトレンド指標であり、あらゆる金融商品にも使用できます。 インジケーターは再描画せず、遅れません。 推奨時間枠 H1. 設定と個人的なボーナスを得るために、購入後すぐに私に連絡してください!   設定 矢印を描く - オンオフ。 チャートに矢印を描く。 アラート - 可聴アラートのオンオフ。 メール通知 - オンオフ。 電子メール通知。 プチ通
mql5と Telegramの モーニング・ブリーフィングで、詳細とスクリーンショットを含む毎日のマーケット・アップデートをご覧 ください! FX Power MT5 NGは 、長年の人気を誇る通貨強度計FX Powerの次世代モデルです。 この次世代ストレングスメーターは何を提供するのでしょうか?初代FXパワーの魅力すべて プラス GOLD/XAUの強さ分析 より正確な計算結果 個別に設定可能な分析期間 カスタマイズ可能な計算上限値により、さらに優れたパフォーマンスを実現 もっと見たい人のための特別なマルチインスタンス設定 すべてのチャートでお好みの色を無限に設定可能 数え切れないほどの通知オプションにより、重要なことを見逃すことはありません。 Windows 11とmacOSのスタイルで角を丸くした新しいデザイン 魔法のように動くインジケーターパネル FXパワーの主な機能 すべての主要通貨の強さの完全な履歴 すべての時間枠における通貨の強さの履歴 すべてのブローカーとチャートで同一の計算結果 100%信頼できるリアルタイム計算 -> リペイントなし ドロップダウン・リストから
Quantum Trend Sniper
Bogdan Ion Puscasu
4.8 (49)
ご紹介   クォンタム トレンド スナイパー インジケーターは 、トレンド反転を特定して取引する方法を変革する画期的な MQL5 インジケーターです。 13年以上の取引経験を持つ経験豊富なトレーダーのチームによって開発されました。     クォンタムトレンドスナイパーインジケーター   は、非常に高い精度でトレンドの反転を識別する革新的な方法で、あなたのトレーディングの旅を新たな高みに押し上げるように設計されています。 ***Quantum Trend Sniper Indicatorを購入すると、Quantum Breakout Indicatorを無料で入手できます!*** クォンタム ブレイクアウト インジケーターは、トレンドの反転を特定するとアラートを発し、矢印を示し、3 つのテイクプロフィットレベルを提案します。 初心者トレーダーにもプロのトレーダーにも適しています。 量子EAチャネル:       ここをクリック MT4のバージョン:       ここをクリック 推奨事項: 期間:すべての時間枠。最良の結果を得るには、M
トレンド スクリーナー インジケーターでトレンド取引の力を解き放ちます。ファジー ロジックと複数通貨システムを活用した究極のトレンド取引ソリューションです。 ファジー ロジックを活用した革新的なトレンド インジケーターである Trend Screener を使用して、トレンド取引を向上させます。 これは、13 を超えるプレミアム ツールと機能、および 3 つの取引戦略を組み合わせた強力なトレンド追跡インジケーターであり、Metatrader をトレンド アナライザーにする多用途の選択肢となります。 期間限定オファー : トレンド スクリーナー インジケーターは、わずか 100 ドルで生涯ご利用いただけます。 (元の価格 50$ ) (オファー延長) Trend Screener の 100% 非再描画精度の揺るぎない精度を体験して、取引の決定が過去の価格変動の影響を受けないようにしてください。 マルチタイムフレームおよびマルチ通貨機能の多用途性を解放し、比類のない自信を持って外国為替、商品、暗号通貨、インデックスの世界を取引できるようにします。 Trend Screener の包括的な
まず第一に、この取引ツールはノンリペイント、ノンリドロー、ノンラグの指標であり、プロの取引に理想的ですことを強調する価値があります。 オンラインコース、ユーザーマニュアル、デモ。 スマートプライスアクションコンセプトインジケーターは、新米から経験豊富なトレーダーまで、非常 に強力なツールです。Inner Circle Trader AnalysisやSmart Money Concepts Trading Strategiesなど、20以上の有用な指標を1つに組み合わせています。このインジケーターはスマートマネーコンセプトに焦点を当て、大手機関の取引方法を提供し、彼らの動きを予測するのに役立ちます。 特に、流動性分析に優れており、機関がどのように取引しているかを理解しやすくしています。市場のトレンドを予測し、価格の動きを慎重に分析するのに優れています。機関の戦略とトレードを合わせることで、市場の動向についてより正確な予測ができます。このインジケーターは多目的であり、市場構造を分析し、重要な注文ブロックを特定し、さまざまなパターンを認識するのに優れています。 このインジ
The AT Forex Indicator MT5 is a sophisticated trading tool designed to provide traders with a comprehensive analysis of multiple currency pairs. This powerful indicator simplifies the complex nature of the forex market, making it accessible for both novice and experienced traders. AT Forex Indicator uses advanced algorithms to detect trends, patterns and is an essential tool for traders aiming to enhance their forex trading performance. With its robust features, ease of use, and reliable signal
note: this indicator is for METATRADER4, if you want the version for METATRADER5 this is the link:  https://www.mql5.com/it/market/product/108106 TRENDMAESTRO ver 2.4 TRENDMAESTRO recognizes a new TREND in the bud, he never makes mistakes. The certainty of identifying a new TREND is priceless. DESCRIPTION TRENDMAESTRO identifies a new TREND in the bud, this indicator examines the volatility, volumes and momentum to identify the moment in which there is an explosion of one or more of these data a
このダッシュボードは、選択されたシンボルの最新の利用可能なハーモニックパターンを表示するので、時間を節約し、より効率的に /   MT4バージョン 。 無料インジケーター:   Basic Harmonic Pattern インジケーター列 Symbol : 選択したシンボルが表示されます。 Trend :   強気または弱気 Pattern : パターンの種類(ガートレー、バタフライ、バット、カニ、サメ、サイファー、ABCD) Entry : エントリー価格 SL: ストップロス価格 TP1: 1回目の利食い価格 TP2: 2回目の利食い価格 TP3:   3回目の利食い価格 Current price :   現在値 Age (in bars):    最後に描画されたパターンの年齢 主な入力項目 Symbols:   "28 Major Currency Pairs "または "Selected Symbols "から選択。 Selected Symbols:   カンマで区切られた監視したいシンボル("EURUSD,GBPUSD,XAUUSD")。ブローカーが
これはMT5のインジケーターで、再描画なしで取引に参入するための正確なシグナルを提供します。 外国為替、暗号通貨、金属、株式、インデックスなど、あらゆる金融資産に適用できます。かなり正確な見積もりを提供し、取引を開始して終了するのに最適な時期を教えてくれます。1つのシグナルを処理しただけでインジケーターの元が取れた例の 動画 (6:22)をご覧ください。Entry PointsPro インジケーターの助けを借りたほとんどのトレーダーの最初の1週間の結果が改善しています。 Telegramグループ に登録してください。Entry Points Proインジケーターのメリットは次の通りです。 再描画のないエントリーシグナル 再描画されるインジケーターでは一度表示されたシグナルが削除されて大きな金銭的損失につながることがありますが、これと異なり、表示されて確認されたシグナルは消えることがありません。 エラーなしの取引開始 インジケーターアルゴリズムによって取引を開始する(資産を売買する)理想的な瞬間を見つけることができます。それを使用するすべてのトレーダーの成功率が向上します。
WHY IS OUR FXACCCURATE LS MT5 THE PROFITABLE ? PROTECT YOUR CAPITAL WITH RISK MANAGEMENT Gives entry, stop and target levels from time to time. It finds Trading opportunities by analyzing what the price is doing during established trends. POWERFUL INDICATOR FOR A RELIABLE STRATEGIES We have made these indicators with a lot of years of hard work. It is made at a very advanced level. Established trends provide dozens of trading opportunities, but most trend indicators completely ignore them!
現在33%オフ 初心者にもエキスパートトレーダーにも最適なソリューション このインジケーターは独自の機能と新しい公式を多数内蔵しており、ユニークで高品質かつ手頃な取引ツールです。このアップデートでは、2つの時間枠ゾーンを表示できるようになります。より長いTFだけでなく、チャートTFとより長いTF(ネストゾーンを表示)の両方を表示できます。すべてのSupply Demandトレーダーの皆さんのお気に召すはずです。:) 重要情報の公開 Advanced Supply Demandの可能性を最大化するには、 https://www.mql5.com/ja/blogs/post/720245 にアクセスしてください。   エントリーまたはターゲットの正確なトリガーポイントを正確に特定できれば取引がどのように改善されるか想像してみてください。新しい基盤となるアルゴリズムに基づいて構築されているため、買い手と売り手の間の潜在的な不均衡をさらに簡単に特定できます。これは、最も強い需要と供給のゾーンと、過去のパフォーマンス(古いゾーンを表示)がグラフィカルに表現されるためです。これらの機能は、最適
TPA True Price Action indicator reveals the true price action of the market makers through 100% non-repainting signals strictly at the close of a candle! TPA shows entries and re-entries, every time the bulls are definitely stronger than the bears and vice versa. Not to confuse with red/green candles. The shift of power gets confirmed at the earliest stage and is ONE exit strategy of several. There are available now two free parts of the TPA User Guide for our customers. The first "The Basics"
ICT(情報通信技術)、SMC(スマートマネーコンセプト)、サポートとレジスタンス、トレンド分析、価格アクション、市場構造、オーダーブロック、ブレーカーブロック、モメンタムシフト、強い不均衡、HH/LL/HL/LH、公正な価値ギャップ、FVG、プレミアム&ディスカウントゾーン、フィボナッチリトレースメント、OTE、バイサイド流動性、セルサイド流動性、流動性の空白、市場セッション、NDOG、NWOG、シルバーバレット、ICTテンプレート 金融市場では、正確な市場分析は投資家にとって重要です。市場のトレンドや流動性をより良く理解するために、高度な市場分析のためのユーザーマニュアルを提供しています。以下は、いくつかの機能とその実装方法の簡単な紹介です: 1. 高時間枠の市場構造の表示:    パラメータを設定することで、チャート上に高時間枠の市場構造を表示することができます。これにより、全体的な市場のトレンドと構造をより良く理解することができます。必要に応じて時間枠をカスタマイズし、市場構造をチャート上に表示することができます。 2. 流動性の表示:    流動性は市場
Was: $299  Now: $99   Supply Demand uses previous price action to identify potential imbalances between buyers and sellers. The key is to identify the better odds zones, not just the untouched ones. Blahtech Supply Demand indicator delivers functionality previously unavailable on any trading platform. This 4-in-1 indicator not only highlights the higher probability zones using a multi-criteria strength engine, but also combines it with multi-timeframe trend analysis, previously confirmed swings
Auto Order Block with break of structure based on ICT and Smart Money Concepts (SMC) Futures Break of Structure ( BoS )             Order block ( OB )            Higher time frame Order block / Point of Interest ( POI )    shown on current chart           Fair value Gap ( FVG ) / Imbalance   -  MTF      ( Multi Time Frame )    HH/LL/HL/LH  -  MTF      ( Multi Time Frame )  Choch  MTF      ( Multi Time Frame )  Volume Imbalance     ,  MTF          vIMB Gap’s Power of 3 Equal High
ICT, SMC, SMART MONEY CONCEPTS, SMART MONEY, Smart Money Concept, Support and Resistance, Trend Analysis, Price Action, Market Structure, Order Blocks, BOS/CHoCH,   Breaker Blocks ,  Momentum Shift,   Supply&Demand Zone/Order Blocks , Strong Imbalance,   HH/LL/HL/LH,    Fair Value Gap, FVG,  Premium  &   Discount   Zones, Fibonacci Retracement, OTE, Buy Side Liquidity, Sell Side Liquidity, BSL/SSL Taken, Equal Highs & Lows, MTF Dashboard, Multiple Time Frame, BigBar, HTF OB, HTF Market Structure
IX Powerは 、FX Powerの無敵の精度をついにFX以外のシンボルにも提供します。 お気に入りの指数、株式、コモディティ、ETF、さらには暗号通貨の短期、中期、長期のトレンドの強さを正確に判断します。 お使いの端末が提供する すべてを分析する ことができます。ぜひお試しいただき、取引 タイミングが大幅に改善 されることをご体験ください。 IXパワーの主な特徴 100%正確で再描画されない計算結果 - ターミナルで利用可能なすべての取引シンボルに対して 予め設定され、さらに個別に設定可能な強度分析期間のドロップダウン選択 Eメール、メッセージ、モバイル通知による無数の通知オプション EAリクエストのためのアクセス可能なバッファ カスタマイズ可能な計算制限により、さらに優れたパフォーマンスを実現 もっと見たい人のための特別なマルチインスタンス設定 すべてのチャートでお好みの色を無限に設定可能 Windows 11とmacOSのスタイルで角を丸くした新しいパネルデザイン サブ・ウィンドウとメイン・チャートの間をシームレスに移動する、魔法のように動くイン
** All Symbols x All Timeframes scan just by pressing scanner button ** *** Contact me  to send you instruction and add you in "123 scanner group" for sharing or seeing experiences with other users. After 17 years of experience in the markets and programming, Winner indicator is ready. I would like to share with you! Introduction The 123 Pattern Scanner indicator with a special enhanced algorithm is a very repetitive common pattern finder with a high success rate . Interestingly, this Winner in
トレンド検出インジケーターはあらゆる戦略を補完し、独立したツールとしても使用できます。 インジケーターの操作に関する推奨事項、コメント   #8   でダウンロードできます 利点 使いやすく、不要な情報でチャートを過負荷にしません。 あらゆる戦略のフィルターとして使用できます。 利益を得るのとストップロスを設定するの両方に使用できる動的なサポートとレジスタンスのレベルが組み込まれています。 ローソク足が閉じた後、インジケーターの色は変わりません。  株式市場、指数、石油、金、およびすべての時間枠で機能します。 トースト通知、電子メール通知、プッシュ通知、サウンドアラートの機能があります。 私の他の開発はここで見つけることができます: https://www.mql5.com/ja/users/mechanic/seller 入力パラメータ Alert-オン/オフ。アラート; Push Notification-オン/オフ。プッシュ通知; Mail-オン/オフ電子メール通知; Fibo 1,2,3,4,5,6,7,11,21,31,41,51,61,71-動的サポートと抵抗
Step into the realm of Forex trading with confidence and precision using XQ, a cutting-edge Forex indicator designed to elevate your trading game to unprecedented heights. Whether you're a seasoned trader or just stepping into the world of currency exchange, XQ Forex Indicator empowers you with the insights and signals needed to make informed trading decisions. The signal conditions are a combination of three indicators, and XQ Forex Indicator only display  medium and long-term trends . The ind
FX Volume MT5
Daniel Stein
4.93 (14)
mql5と Telegramの モーニング・ブリーフィングで、詳細とスクリーンショットを含む毎日のマーケット・アップデートをご覧 ください! FX Volumeは、ブローカーの視点から市場のセンチメントをリアルに洞察する、最初で唯一の出来高インジケーターです。 ブローカーのような機関投資家が外国為替市場でどのようなポジションをとっているか、COTレポートよりもはるかに速く、素晴らしい洞察を提供します。 この情報をチャート上で直接見ることは、あなたの取引にとって真のゲームチェンジャーであり、画期的なソリューションです。 以下のようなユニークなマーケットデータ洞察から利益を得てください。 比率は 、通貨のロングポジションとショートポジションの比率をパーセントで表示します。 比率の変化は 、選択した期間内のロング比率とその変化率を表示します。 Volumes Totalは 、通貨の取引量(ロングとショート)の合計をロット単位で表示します。 Volumes Long :全通貨のロングポジションの取引量を表示します。 Volumes(ショート )は、全通貨のショートポジションの取引量を表示
Was: $249  Now: $99   Market Profile defines a number of day types that can help the trader to determine market behaviour. A key feature is the Value Area, representing the range of price action where 70% of trading took place. Understanding the Value Area can give traders valuable insight into market direction and establish the higher odds trade. It is an excellent addition to any system you may be using. Inspired by Jim Dalton’s book “Mind Over Markets”, this indicator is designed to suit the
Gartley Hunter Multi - An indicator for searching for harmonic patterns simultaneously on dozens of trading instruments and on all possible timeframes. Manual (Be sure to read before purchasing) | Version for MT4 Advantages 1. Patterns: Gartley, Butterfly, Shark, Crab. Bat, Alternate Bat, Deep Crab, Cypher 2. Simultaneous search for patterns on dozens of trading instruments and on all possible timeframes 3. Search for patterns of all possible sizes. From the smallest to the largest 4. A
このダッシュボードは、選択したシンボルの取引戦略に応じて、スキャルピングと長期モードの両方で、チャート上の需給ゾーンを発見し表示します。さらに、ダッシュボードのスキャナーモードは、一目ですべての希望のシンボルをチェックし、適切なポジションを見逃さないようにするのに役立ちます /  バージョンMT4 無料インディケータ:   Basic Supply Demand 特徴 複数の通貨ペアの取引機会を見ることができ、需給ゾーンの近さに応じてランク付けされた全ペアを明確かつ簡潔に表示します。 色から検出パラメータまで、特定のニーズに合わせてカスタマイズ可能な設定 主な入力 Indicator mode : 新機能を備えたインジケーター・モードまたはパネル・モードから選択。 Symbols :   "主要28通貨ペア "または "選択されたシンボル "から選択。 Selected Symbols :   カンマで区切られた監視したいシンボル (「EURUSD,GBPUSD,XAUUSD」)。お使いのブローカーがペアに接尾辞または接頭辞を付けている場合は、次の2つのパラメータ(ペア接頭
Stratos Pali Indicator is a revolutionary tool designed to enhance your trading strategy by accurately identifying market trends. This sophisticated indicator uses a unique algorithm to generate a complete histogram, which records when the trend is Long or Short. When a trend reversal occurs, an arrow appears, indicating the new direction of the trend. Important Information Revealed Leave a review and contact me via mql5 message to receive My Top 5 set files for Stratos Pali at no cost ! Do
作者のその他のプロダクト
HFTHackerMT5
Thomas Bradley Butler
5 (2)
シグナル: 私のプロフィールの HFT ハッカー リンク *テストして使用する前に EA を最適化してください。 最適化した場合のみ購入してください。 これは、最適化する方法を知っており、自分のメリットで利益を上げたいと考えているトレーダー向けです。 リスクパラメータを設定するのはあなたです。 選択してもうまくいかないトレードにストップを加えた高い勝率。 長生きのためのリスクを軽減します。 これはすべてのアカウントで機能し、リスク管理ツールです。すべてのコメント、説明、ブログを読んでください。 最良の結果を得る仕組み: https://www.mql5.com/en/blogs/post/754836 MT4バージョン: https://www.mql5.com/en/market/product/73834 マイクロ秒単位が重要な高頻度取引 (HFT) の賑やかな世界に、HFT ハッカーとしてのみ知られる謎の人物が住んでいました。 電光石火の反射神経と、市場の複雑なアルゴリズムを操る驚異的な能力を備えた HFT ハッカーは、トレーダーの間で伝説的な存在でした。 伝説に
スマート ボリューム トラッカーと組み合わせる: https://www.mql5.com/en/market/product/116650 フットプリントチャートと組み合わせる: https://www.mql5.com/en/market/product/94153 ゾーン内の取引と組み合わせる: https://www.mql5.com/en/market/product/110194 ボリュームデイトレーダーと組み合わせる: h https://www.mql5.com/en/market/product/72498 オーダーブックと組み合わせる: https://www.mql5.com/en/market/product/102247 レベル 2 取引は、MetaTrader チャート上で現在の買値と売値を視覚化するのに役立つ指標です。 これは、市場での売買活動のスナップショットを簡単に取得するようなもので、どこで圧力が高まっているかを理解することができます。 それが示すもの ビッド値とアスク値: インジケーターには、ビッド (買い) ボリュームと
Matrix Hacker
Thomas Bradley Butler
MT4 Version :   https://www.mql5.com/en/market/product/87060 Matrix Hacker はヘッジされたアカウント専用で、ランダム ウォークを使用します。過去は関係ありません。 EA は、市場で安定した足場を維持し、アスクとビッドの両方をカバーするように設定されています。トレーダーに応じて、さまざまな量のサイズとボリュームでビッドとアスクを売買します。これは、最適化と過度のレバレッジについての知識が必要なため、初心者にはお勧めできません。小さなピップをスキャルピングし、範囲内に保つための設定を使用することをお勧めします. この EA は 4 つの取引を開く可能性があるため、これを理解して、入力のサイズが正しいことを確認してください。固定ロット サイズを使用するため、固定ロットでの 4 つの取引を考慮する必要があります。ライブで取引する前に、この EA を最初にデモで使用し、確信が持てるまで増分ロットでのみライブに移行します。マイクロロットごとに1000ドルをお勧めします。デイトレードでは、DMA ブローカーを使用し、ス
MT4 indicator version https://www.mql5.com/en/market/product/72342 I personally use this indicator to scalp.  Accurate for accessing extremes and supports for buy positions primarily for 1 minute time frames.  Other time frames can be used but the levels are different. Its a better oscillator and compare with others to see the difference.          Day trade using neuro network concepts.  This indicator uses elementary forms of neuro networks to generate signals to buy and sell. Use the indicat
Optimize before use in back test or live for better results for you  and don't forget to account for spreads and slippage in optimization. This Expert is for 1 minute charts trading BTC/USD.  Bitcoin on 1 minute use MACD, CCI and RSI for entry and exit logic.  This EA was back tested and traded out of sample.  Each trade has a stop loss and take profit.   BTC compared to the indexes and Gold have huge differences, look at the example of traditional investing vs. Bitcoin.  Yellow line represents
NeuroScalper
Thomas Bradley Butler
5 (1)
アップデート!矢印が100レベルと200レベルに追加されました。 このインディケータは極値にアクセスするために正確であり、主に1分間の買いポジションをサポートします。他の時間枠を使用することもできますが、レベルは異なります。これは優れた発振器であり、他の発振器と比較して違いを確認します。 ニューロネットワークの概念を使用したデイトレード。このインジケーターは、基本的な形式のニューロネットワークを使用して売買するシグナルを生成します。 1分足チャートのインジケーターを使用します。インジケーターは再描画されません。 1分間のチャートまたはさまざまなレベルを使用する他のチャートを使用してテスターでダウンロードして実行し、取引を分析して自分で確認します。市場を頭皮にする多くの機会。より高い時間枠で使用できますが、レベルはあなたの裁量に応じて変更する必要があります。時間枠が長いほど、範囲が広くなります。 このモデルで考慮すべき概念と事項: 複数のインジケーターが使用され、重みが適用され、最大値と最小値に2つのデータポイントがあります。この指標は主に上昇トレンドを取引するための
HFTHacker
Thomas Bradley Butler
シグナル: 私のプロフィールの HFT ハッカー リンク *テストして使用する前に EA を最適化してください。 最適化した場合のみ購入してください。 これは、最適化する方法を知っており、自分のメリットで利益を上げたいと考えているトレーダー向けです。 リスクパラメータを設定するのはあなたです。 選択してもうまくいかないトレードにストップを加えた高い勝率。 長生きのためのリスクを軽減します。 これはすべてのアカウントで機能し、リスク管理ツールです。すべてのコメント、説明、ブログを読んでください。 最良の結果を得る仕組み: https://www.mql5.com/en/blogs/post/754836 MT4バージョン: https://www.mql5.com/en/market/product/73834 マイクロ秒単位が重要な高頻度取引 (HFT) の賑やかな世界に、HFT ハッカーとしてのみ知られる謎の人物が住んでいました。 電光石火の反射神経と、市場の複雑なアルゴリズムを操る驚異的な能力を備えた HFT ハッカーは、トレーダーの間で伝説的な存在でした。 伝説
Bitcoin M5
Thomas Bradley Butler
テストおよび使用前に EA を最適化してください。 Bitcoin M5 は、5 分チャートで BTC/USD を取引するためのものです。SL と TP は 50000 から開始する必要があります。使用前に最適化してください。 この取引戦略では、ボリンジャー バンドとエンベロープ インジケーターを使用して取引を行います。価格がバンドを突破するブレイクアウト ポイントを捉えて取引し、価格がエンベロープを越えたときに終了します。すべての取引で固定ロット数が使用され、SL と TP があります。EA は、ロジックでマーチンゲールやヘッジを使用しません。 テストおよび使用前に EA を最適化してください。 Bitcoin M5 は、5 分チャートで BTC/USD を取引するためのものです。SL と TP は 50000 から開始する必要があります。使用前に最適化してください。 この取引戦略では、ボリンジャー バンドとエンベロープ インジケーターを使用して取引を行います。価格がバンドを突破するブレイクアウト ポイントを捉えて取引し、価格がエンベロープを越えたときに終了しま
株式(CFD)のみのデイトレード。 取引には手間がかかります。 すべてのエントリと終了を通知するショートカットやインジケータはありません。 利益は心の状態から来ます。 指標は、お金の管理と成功の心理学と組み合わせて使用されるツールです。 ボリュームプロファイルの不均衡を見つけます。 取引価格のボリュームの不均衡。 多くの不均衡は、クローズとオープンおよびニュースで発生します。 株の買い手と売り手を参照してください。 5分から1時間使用して、誰が価格を管理できるかを確認し、価格の不均衡を見つけます。 より大きな在庫は15分以上です。 カラーボリュームバーの上にマウスを置くと、過去のバーの数が表示されます。 現在のバーの音量は上隅に書かれています。 ボリュームの不均衡を見つけて、しばらくの間価格がどの方向に進むかを確認します。 最良の結果を得るために支配的な傾向に従ってください トレンドが発生した場合は、トレンドをトレードするようにしてください。 トレーリングストップを使用し、大量の反転の不均衡に注意してください。
MarketMakerMT5
Thomas Bradley Butler
需要と供給の取引を自動化します。市場を作る。 このEAは、誰もが販売および模倣する人気のある需要と供給の指標に触発されて作成されました。 EAは取引とヘッジを続け、市場を作ります。非ヘッジ口座でも取引できます。リスクを評価し、時間枠、ロットサイズ、ヘッジ機能を使用する必要があります。一度に複数のペアをオンとオフで合計約1か月間取引しました。 システムの概念: EAは需要と供給のレベルを交換します。レベルが変わるので、EAは新しいレベルを交換し続けます。より低いロットの多くのペアに分散することは、システムの機能です。安定したゲインを維持しながら、大きなドローダウンを回避する必要があります。 SLは使用できますが、これをオプションにするために説明したヘッジされた側面。私が多くのペアで小ロットで得ているドローダウンは4%であり、これはSLなしです。より大きなロットは6%を示しています。したがって、小さいサイズは控えめで、大きいサイズはより積極的です。これらは、残高と比較して取引されるロットを低く保つ理由です。貿易は発展する余地が必要です。 特徴: 取引数 固定ロット ボ
Black Gold M1
Thomas Bradley Butler
OPTIMIZE BEFORE BACKTEST AND USE Trade crude oil with this EA.  No EA turns hundreds into millions in a year or 2, This is a lie if presented this way.  Black Gold trades Brent Crude on 1 min charts.  It uses RSI, moving averages and directional indicators.  Try it out, load it onto the tester if you have the history and ability to trade Brent crude.    Adjust and optimize to get the most out of the expert advisor
ForexReversal
Thomas Bradley Butler
4 (1)
忍耐はストレスのないスキャルピングの鍵です。 200の移動平均を通過するのを確認したら、矢印をトレードし、移動平均フィルターを使用せずに、最後のスイングポイントから拡大またはトレンドを作成します。 1分間の時間枠に最適で、日中の動きの勢いを捉えます。 トレーリングストップを使用して、簡単に20ピップを取るか、より大きなトレンドのために長く滞在します。 この指標からの本当に大きな取引の写真の例を見てください。 1分の時間枠が最適です。 ズームアウトしてトレンドを確認します。 矢印は再描画または再計算されません。 1分の時間枠に添付して取引を調査し、それが戦略に使用できるかどうかを確認します。 私 ルール: 購入のための青 販売のための赤 横向きの期間を避けてください 大量の取引と勢いの取引 ストップロスを使用する
GoldBuyBackScalper
Thomas Bradley Butler
4 (1)
このインジケーターはXAU / USD、1分足チャートのみを対象としています。 すべてのペアには、独自の特性と価格変動があります。 このインジケーターでV字型の反転をトレードします。 頭皮はトレーリングストップを使用して購入し、ニュースはより極端で突然の売りを引き起こす可能性があるため、ニュースを避けます。 バックテストで1分の時間枠にアタッチし、反転購入を確認します。 インジケーターが再描画または再計算されることはありません。 活動時間中のみの取引 このインジケーターはXAU / USD、1分足チャートのみを対象としています。 すべてのペアには、独自の特性と価格変動があります。 このインジケーターでV字型の反転をトレードします。 頭皮はトレーリングストップを使用して購入し、ニュースはより極端で突然の売りを引き起こす可能性があるため、ニュースを避けます。 バックテストで1分の時間枠にアタッチし、反転購入を確認します。 インジケーターが再描画または再計算されることはありません。 活動時間中のみの取引
This is based on short term strength or weakness and not on moving averages.  Moving averages are used for filter only. Trade supply and demand with arrows. Supply and demand breakouts and strength of the buyers or sellers .  Don't trade buy arrow to sell arrow.  Trade the strength with trendlines or moving averages and use stops.  The arrow can have some strong moves.  Trade on all time frames.  Try it out in the back tester. The pips can be made with this indicator, follow the arrows and mak
Master scalping with this indicator.  Trade on any time frame for scalps on buy or sells.  Follow trends using a 200 moving average and stops and targets.  Use with your own system.  This indicator can give pips if following it correctly.  Stick to rules and pick up pips daily.  Use as entries in a trend, scalp for a few pips or exit on opposite signal.  Best to follow higher time frame trends. Indicator doesn't repaint or recalculate. Rules: Don't trade overnight, only trade during active sessi
This indicator is good for small time frames like 1 and 5 minutes and made for day trading. The indicator never repaints or recalculates. The indicator works is for trading swing points in day trading, following bulls or bears.  Its a simple to use, non cluttered indicator with a high success rate.  This indicator works well to capture ranges.  All indicators come with limitations and no indicator or system is always accurate. Use money management for long term trading success.   Place in backte
DTKGold
Thomas Bradley Butler
This is the DayTradeKing for gold on a 1 minute time frame.  It is a different calculation for the range. Use a 200 period moving average as a filter.  Always use stops and avoid news, wait for more conformation.  This looks to capture intraday ranges. Put it in the back tester on 1 minute to see the price action and how it works. Trade with trend Use filter Use stops Alerts are added for pop ups and sound. 
Trade trends with the Super Scalper Use on all time frames and assets it is  designed for scalping trends. Works good on small time frames for day trading.  The arrows are easy to follow.  This is a simple no repaint/no recalculate arrow indicator to follow trends with.  Use in conjunction with your own system or use moving averages.  Always use stops just below or above the last swing point or your own money management system The indicator comes with push notifications, sound alerts and email
This indicator is a simple stripped down version of any advanced support and resistance indicator.  All the support and resistance indicators work from a number of bars that have developed over time. Get rid of clutter and confusing levels.  Find levels according to a number of bars. Look at days, session, numbers of hours, periods of consolidation.  Watch levels develop and use as breakout points, or areas of buyers and sellers.  Features and things to consider This indicator is for a frame of
https://www.mql5.com/en/market/product/57345 このEAは、外国為替反転インジケーターに基づいています。 システムを手動で取引したい場合は、インジケーターをダウンロードして試してみてください。 EAはトレンドに従い、それに応じてポジションをオープンします。 結果は、より低いドローダウンで安定したゲインを示していますが、バックテスター、オプティマイザー、および時間枠でそれを試して、何が機能するかを確認してください。 示されているすべての結果は架空のものです。 注:これはマーチンゲールやグリッドではありません。 インジケーターにはヘッジ機能があります このEAには以下の機能があり、リスクに応じて変更してください。 EAは自由証拠金に従って追加し、パラメーターに従って売買します。 入力を通じてリスクを管理します。 inp5は売りです inp7は購入です ストップロットを修正 固定テイクプロフィット   フリーマージンの%
MarketMaker
Thomas Bradley Butler
需要と供給の取引を自動化します。市場を作る。 このEAは、誰もが販売および模倣する人気のある需要と供給の指標に触発されて作成されました。 EAは取引とヘッジを続け、市場を作ります。非ヘッジ口座でも取引できます。リスクを評価し、時間枠、ロットサイズ、ヘッジ機能を使用する必要があります。一度に複数のペアをオンとオフで合計約1か月間取引しました。 システムの概念: EAは需要と供給のレベルを交換します。レベルが変わるので、EAは新しいレベルを交換し続けます。より低いロットの多くのペアに分散することは、システムの機能です。安定したゲインを維持しながら、大きなドローダウンを回避する必要があります。 SLは使用できますが、これをオプションにするために説明したヘッジされた側面。私が多くのペアで小ロットで得ているドローダウンは4%であり、これはSLなしです。より大きなロットは6%を示しています。したがって、小さいサイズは控えめで、大きいサイズはより積極的です。これらは、残高と比較して取引されるロットを低く保つ理由です。貿易は発展する余地が必要です。 特徴: 取引数
Top Trader
Thomas Bradley Butler
Top Trader Indicator This is an arrow reversal indicator. This is with deviations and arrows.  Trade a blue arrow for buy and trade a red arrow for sell.  Change the time period and the deviations of the bands.  This is similar to others but these arrows don't repaint.  Load in back tester and study which periods and deviations work the best.  It works on all time frames.  15 min to 1 hr would give good results for take profits.  Try according to your own risk management.
Quant Bot
Thomas Bradley Butler
Quant Botは、EUR / USDの1時間の時間枠でのトレンド取引用です。 セットファイルはありませんが、他のペアを使用する場合は、最適化が必要になる場合があります。 ボットについて: 遺伝子生成を使用し、ATRを使用して取引します。 カーブフィットを防ぐためにウォークフォワード期間が使用されました EAはすべての取引でストップを使用します。 お金の管理は、バランスの%でスケールアップします バックセット期間は2003年から2020年までであり、前進は2020年から2022年まででした(写真を参照)。 Quant Botは、EUR / USDの1時間の時間枠でのトレンド取引用です。 セットファイルはありませんが、他のペアを使用する場合は、最適化が必要になる場合があります。 ボットについて: 遺伝子生成を使用し、ATRを使用して取引します。 カーブフィットを防ぐためにウォークフォワード期間が使用されました EAはすべての取引でストップを使用します。 お金の管理は、バランスの%でスケールアップします バックセット期間は2003年から2020年までであり、前進は2
Crypto Net
Thomas Bradley Butler
Crypto Netは、1時間の時間枠でBTCUSDを取引するためのものです。 それは戦略を進化させるために遺伝的進化を使用します。 このEAトレードトレンドは、ATRと一目の嘘の指標に続いています。 これは構築され、モンテカルロやウォークフォワードを含む一連の堅牢なテストに合格しました。 入力: 最小リスクであるアカウントの割合。 最大ロット数 取引を停止する時間 他に何も変更されていません。 フォワードのみのトレード。 バックテストはありません。 ブローカーの時間は、戦略が組み込まれたものとは異なります。 Crypto Netは、1時間の時間枠でBTCUSDを取引するためのものです。 それは戦略を進化させるために遺伝的進化を使用します。 このEAトレードトレンドは、ATRと一目の嘘の指標に続いています。 これは構築され、モンテカルロやウォークフォワードを含む一連の堅牢なテストに合格しました。 入力: 最小リスクであるアカウントの割合。 最大ロット数 取引を停止する時間 他に何も変更されていません。
XAU / USDの場合 これは、ランダムな世代とトレンドフォロートレーディングを使用する安定したトレーディングシステムです。 エキスパートは品質データでバックテストされ、モンテカルロシミュレーションとともに最適化期間を完了して、XAU / USDの1時間の時間枠でのオーバーフィットを回避しました。 ストップロスとテイクプロフィットが使用されます。 EAには複数の構成があり、取引するロット数を把握する以外に行うことはありません。 特徴: バランス化合物の利益のパーセントを使用します XAU / USDの場合 これは、ランダムな世代とトレンドフォロートレーディングを使用する安定したトレーディングシステムです。 エキスパートは品質データでバックテストされ、モンテカルロシミュレーションとともに最適化期間を完了して、XAU / USDの1時間の時間枠でのオーバーフィットを回避しました。 ストップロスとテイクプロフィットが使用されます。 EAには複数の構成があり、取引するロット数を把握する以外に行うことはありません。 特徴: バランス化合物の利益のパ
PropTrader
Thomas Bradley Butler
*使用前にEAを最適化してください* EUR/USD向けに最適化された外国為替取引戦略 Expert Advisor (EA) を使用して 1 ~ 2 年以内に多額の富を達成するというのは非現実的な主張です。 バックテストと実際の取引は、EUR/USD 通貨ペアに焦点を当てています。 この戦略について: これは私たちの戦略の最初の反復を表しており、さらなる進歩の可能性があります。 100% 品質のデータを使用して厳密にテストされており、MT4 エラーはありません。 この戦略は、トレンドフォローの論理原則に基づいて機能します。 トレンドが強気の場合、EA が開始してトレーリング ストップを展開します。逆の場合も同様です。 本質的には、これは単純なトレンド追跡アプローチです。 主な利点と考慮事項: 簡単なセットアップ: デフォルト設定をそのまま使用し、好みに応じてロットサイズを変更するだけです。 リスク管理: この戦略ではマーチンゲールやヘッジは使用されません。 リスク軽減: 各取引には、アベレージ トゥルー レンジ (ATR) によって決定されるトレーリング ス
Down Under
Thomas Bradley Butler
ダウンアンダーは1時間の時間枠でAUD/USDペアを取引します。 このEAはATRとOHLCをトレードします。 この時間枠でこのペア用にフォーマットされます。 複利は分で使用されます。 ロットサイズと最大。 ロットサイズ。 残高のパーセンテージは、勝ちトレードで合成されます。 バランスが変動すると、ロットサイズも変動します。 設定: mmリスク% mmロット 最大ロット 他に変更するものはありません。 これには、マーチンゲールまたはヘッジ機能はありません。 変更する他の機能は、取引している場合、AUD/USDのCFDのみです。 ブローカープラットフォームでこれを小数点以下で変更します。 リスク免責事項 先物、オプション、通貨取引はすべて大きな潜在的な見返りがありますが、大きな潜在的なリスクもあります。 これらの市場に投資するには、リスクを認識し、喜んで受け入れる必要があります。
Cable Trader
Thomas Bradley Butler
GBP/USD 1hr.  このEAは勢いとセッションを交換します。 これには固定ロットコンポーネントがあり、開発中にTPを変更し続けます。 設定: ロットサイズ 他に変更するものはありません。 これには、マーチンゲールまたはヘッジ機能はありません。 変更する他の機能は、取引している場合、GBP/USDのCFDのみです。 ブローカープラットフォームでこれを小数点以下で変更します。 リスク免責事項 先物、オプション、通貨取引はすべて大きな潜在的な見返りがありますが、大きな潜在的なリスクもあります。 これらの市場に投資するには、リスクを認識し、喜んで受け入れる必要があります。 リスク免責事項 先物、オプション、通貨取引はすべて大きな潜在的な見返りがありますが、大きな潜在的なリスクもあります。 これらの市場に投資するには、リスクを認識し、喜んで受け入れる必要があります。
Euclidean
Thomas Bradley Butler
ユークリッドは、私が8年前に思いついたユニークな取引アルゴリズムです。 このEAはこのシステムの一部です。 閉鎖系として機能します。 EAは、トレンドをキャッチするために角度の程度が正しいときに購入を開始します。 ストップロスは角度から10%です。 とても簡単です。 入力: ロット1マイクロロットの残高の%($ 1,000) ボリューム上位ロット=ロットの最大量 利益レベルを取る=デフォルトは50ピップス 方法と考慮事項: ストップロスが組み込まれており、10%の角度で価格に応じて取引されます。 テイクプロフィットは50ピップスに設定されていますが、希望する金額にすることができます。 1分から5分のような短い時間枠で取引します。 バックテスターでこれをテストする際のエラーはありませんでした。 プラットフォームやブローカーが異なればデータも異なるため、テストするデータのダウンロードを確認してください。 外国為替取引のリスク免責事項 証拠金で外国為替を取引することはリスクが高く、すべての投資家に適しているとは限りません。 過去のパフォーマンスは将来の結果を示す
Pip Scalper
Thomas Bradley Butler
みんなのための指標 Pip Scalperは、スキャルピングトレンド用です。 この指標を使用して、トレンドに長くとどまります。 すべての時間枠とアセットで機能します。 このツールで毎日のピップを拾います。 200の移動平均を使用して取引をフィルタリングします。 より短い時間枠をお勧めします。 デイトレードに使用します。 使用方法と使用方法: Pips Scalperは、長期的なトレンド取引に基づいています。 青で購入 赤で売る フィルターとして200移動平均を使用し、アクティブな期間中に取引します。 Pip Scalperは、スキャルピングトレンド用です。 この指標を使用して、トレンドに長くとどまります。 すべての時間枠とアセットで機能します。 このツールで毎日のピップを拾います。 200の移動平均を使用して取引をフィルタリングします。 より短い時間枠をお勧めします。 デイトレードに使用します。 使用方法と使用方法: Pips Scalperは、長期的なトレンド取引に基づいています。 青で購入 赤で売る フィルターとして200移動平均を使用し、アク
フィルタ:
レビューなし
レビューに返信