Highest High and Lowest Low indicator
- インディケータ
- Seti Gautama Adi Nugroho
- バージョン: 1.0
Highest High and Lowest Low (HH_LL) Indicator
Description:
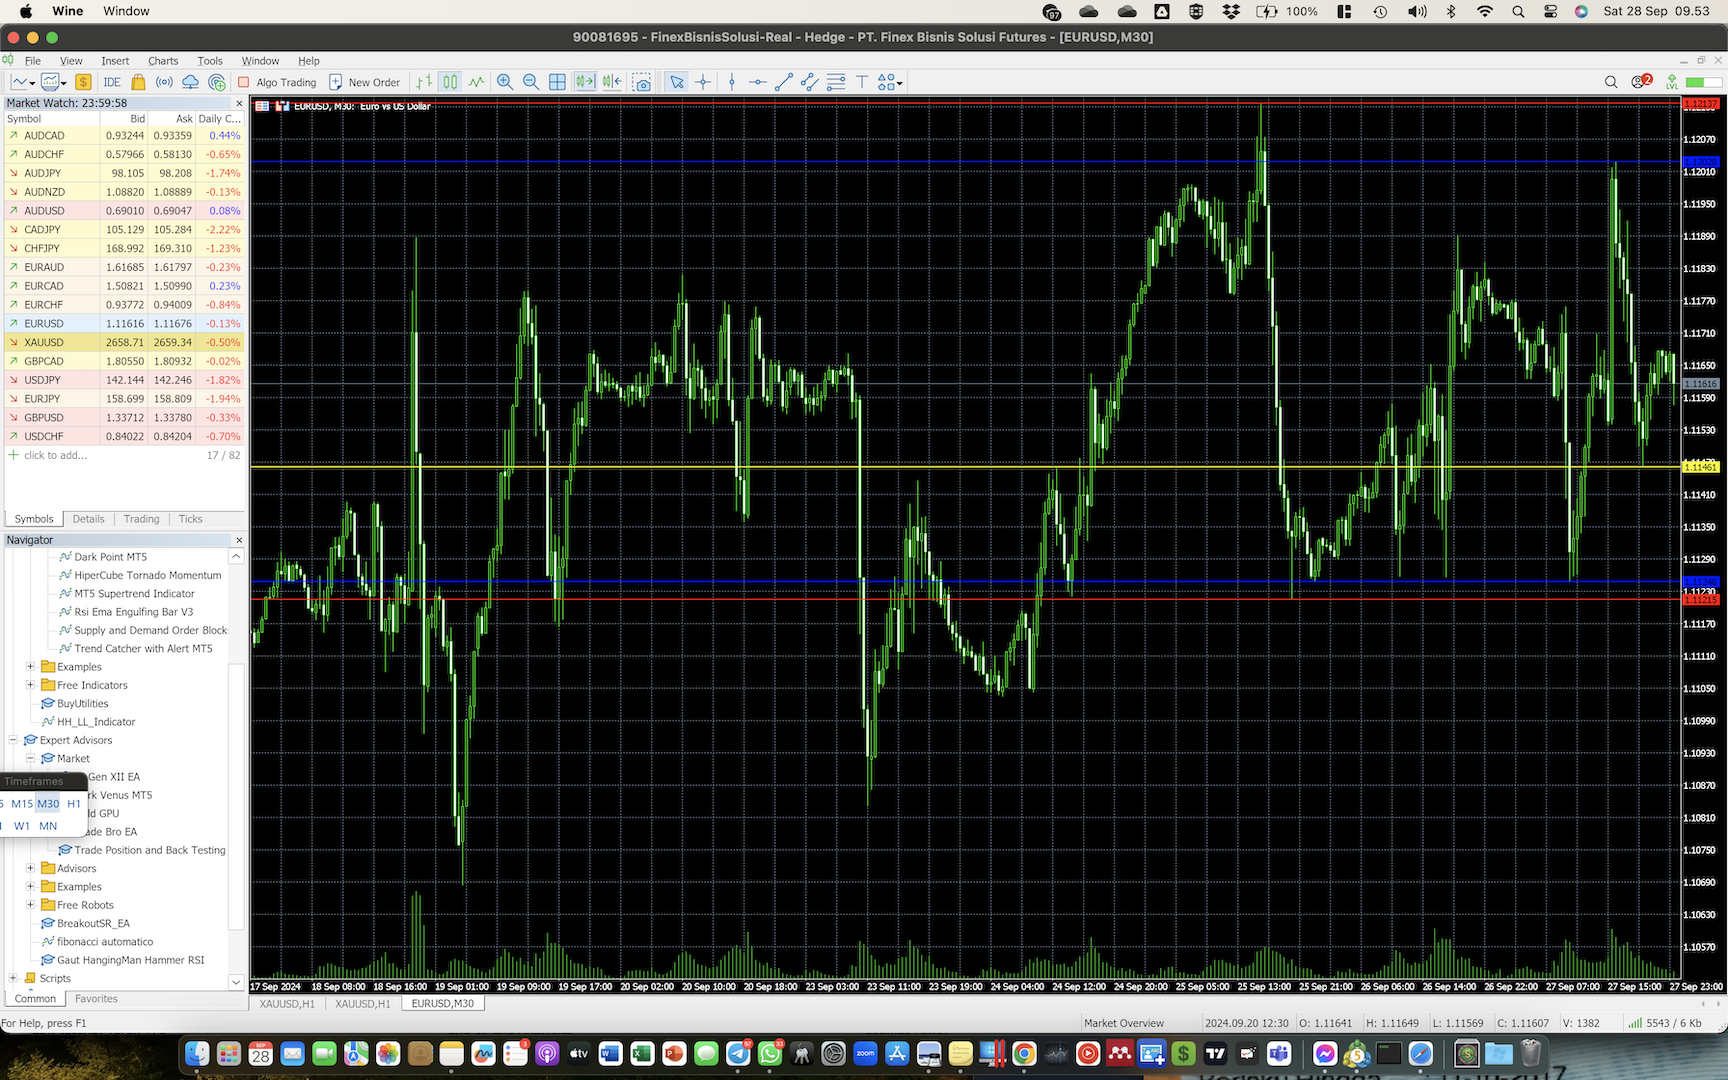
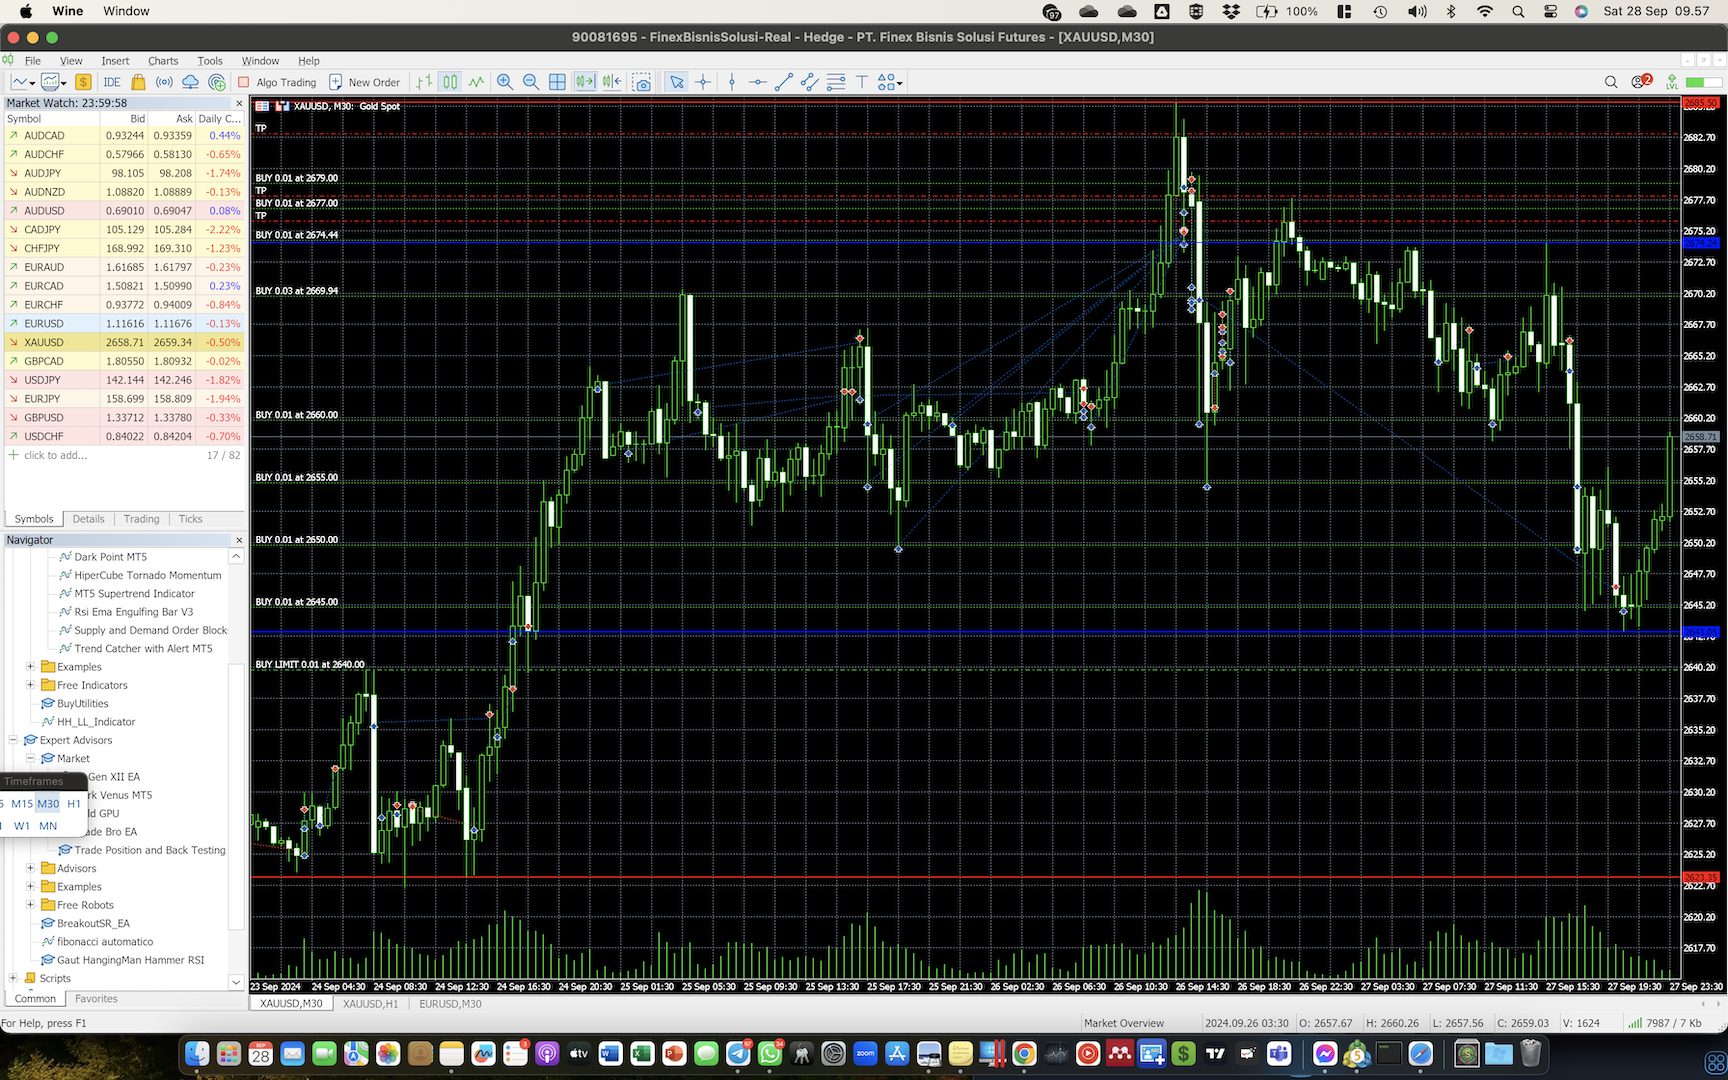
The HH_LL Indicator is a trading tool designed to help traders identify key market points by automatically drawing Higher High (HH) and Lower Low (LL) lines across multiple timeframes. This indicator allows traders to easily spot significant levels on the chart, facilitating more accurate trading decisions.
Key Features:
- Multi-Timeframe Analysis: The indicator supports various timeframes, including M30, H1, and H4. This enables traders to view HH and LL levels from a broader or more specific perspective depending on their needs.
- Clear Color Coding: Each timeframe is represented by a different line color for easy identification. HH and LL lines on the M30 timeframe are yellow, H1 lines are blue, and H4 lines are red.
- Real-Time Updates: The HH and LL lines are automatically updated with every new bar that forms on the chart, ensuring that traders always have the most current information.
- User-Friendly: This script is designed to be used directly as an indicator on the MetaTrader 5 (MT5) platform. Simply install the HH_LL_Indicator.mq5 script, and the indicator will be ready to use.
How It Works: The HH_LL Indicator works by analyzing the highest and lowest prices within a specified period on each predetermined timeframe. It then draws horizontal lines at these levels, providing traders with a clear visual guide to potential entry or exit points in the market.
With the HH_LL Indicator, traders can quickly identify support and resistance areas based on historical data, which is a crucial element in successful trading strategies.