• 概要
  • レビュー
  • コメント

Forex Scalper Indicator for MT4

Forex Scalper Indicator – 金融市場で利益を得るための精密ツール

MT4用のForex Scalper Indicatorは、市場で最大の精度でスキャルピングを行いたいすべてのトレーダーにとって完璧な味方です。正確なデータに基づいた分析により、このインジケーターは迅速な決定を下すのに理想的な、タイムリーで正確なシグナルを提供します。

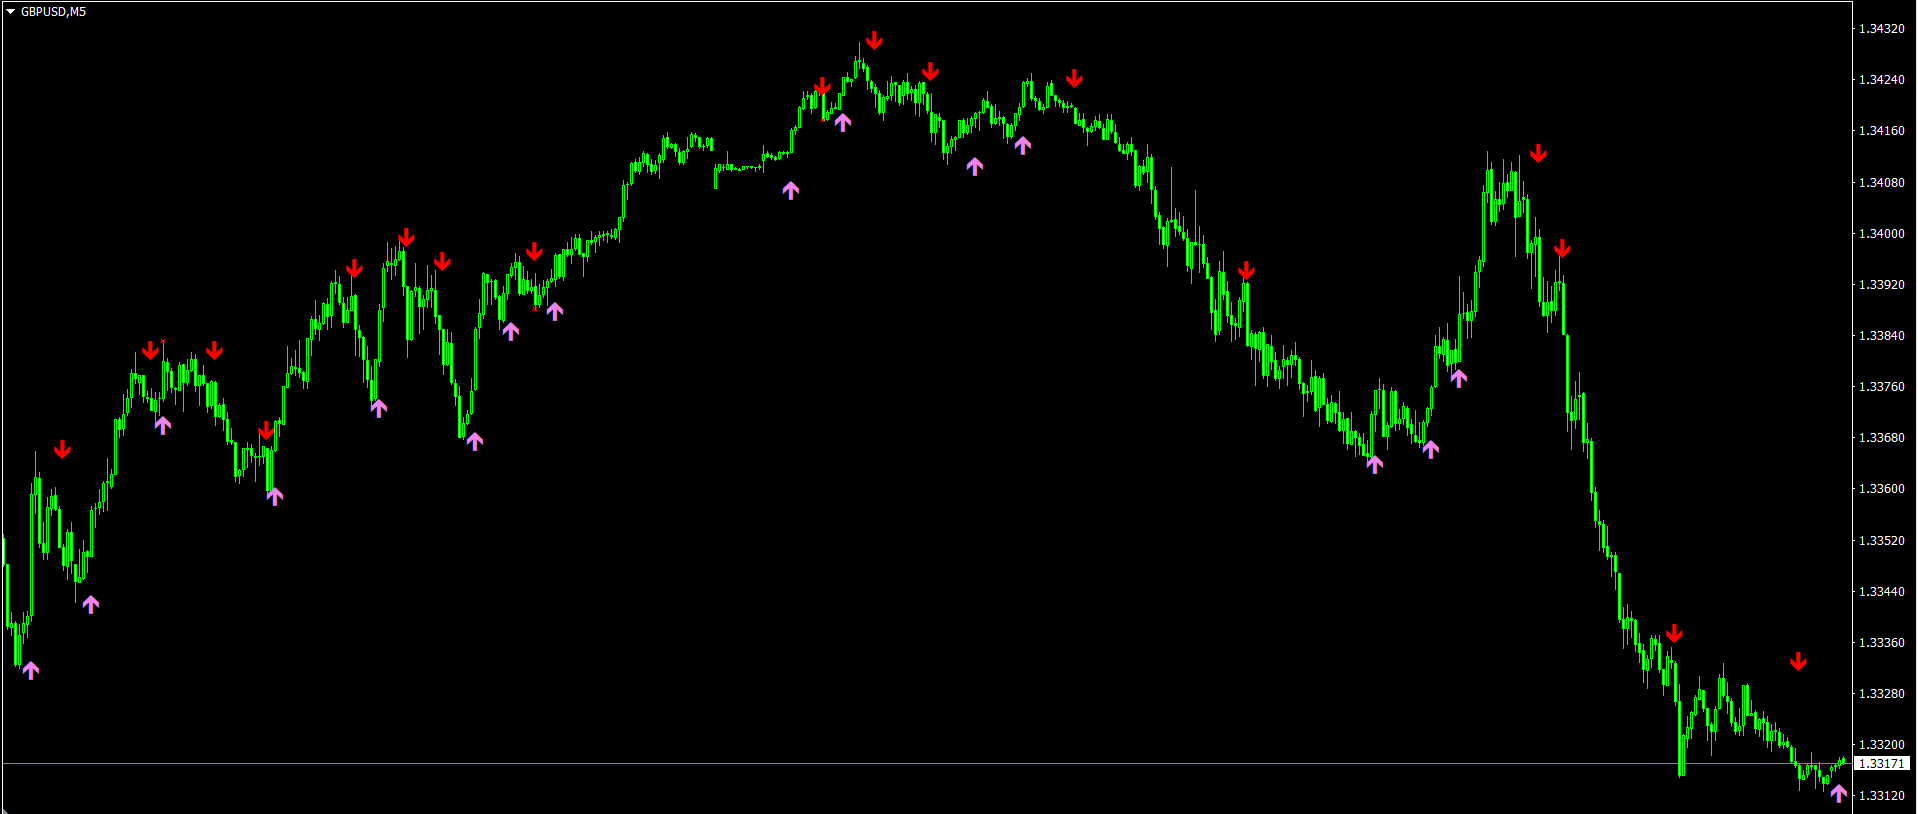
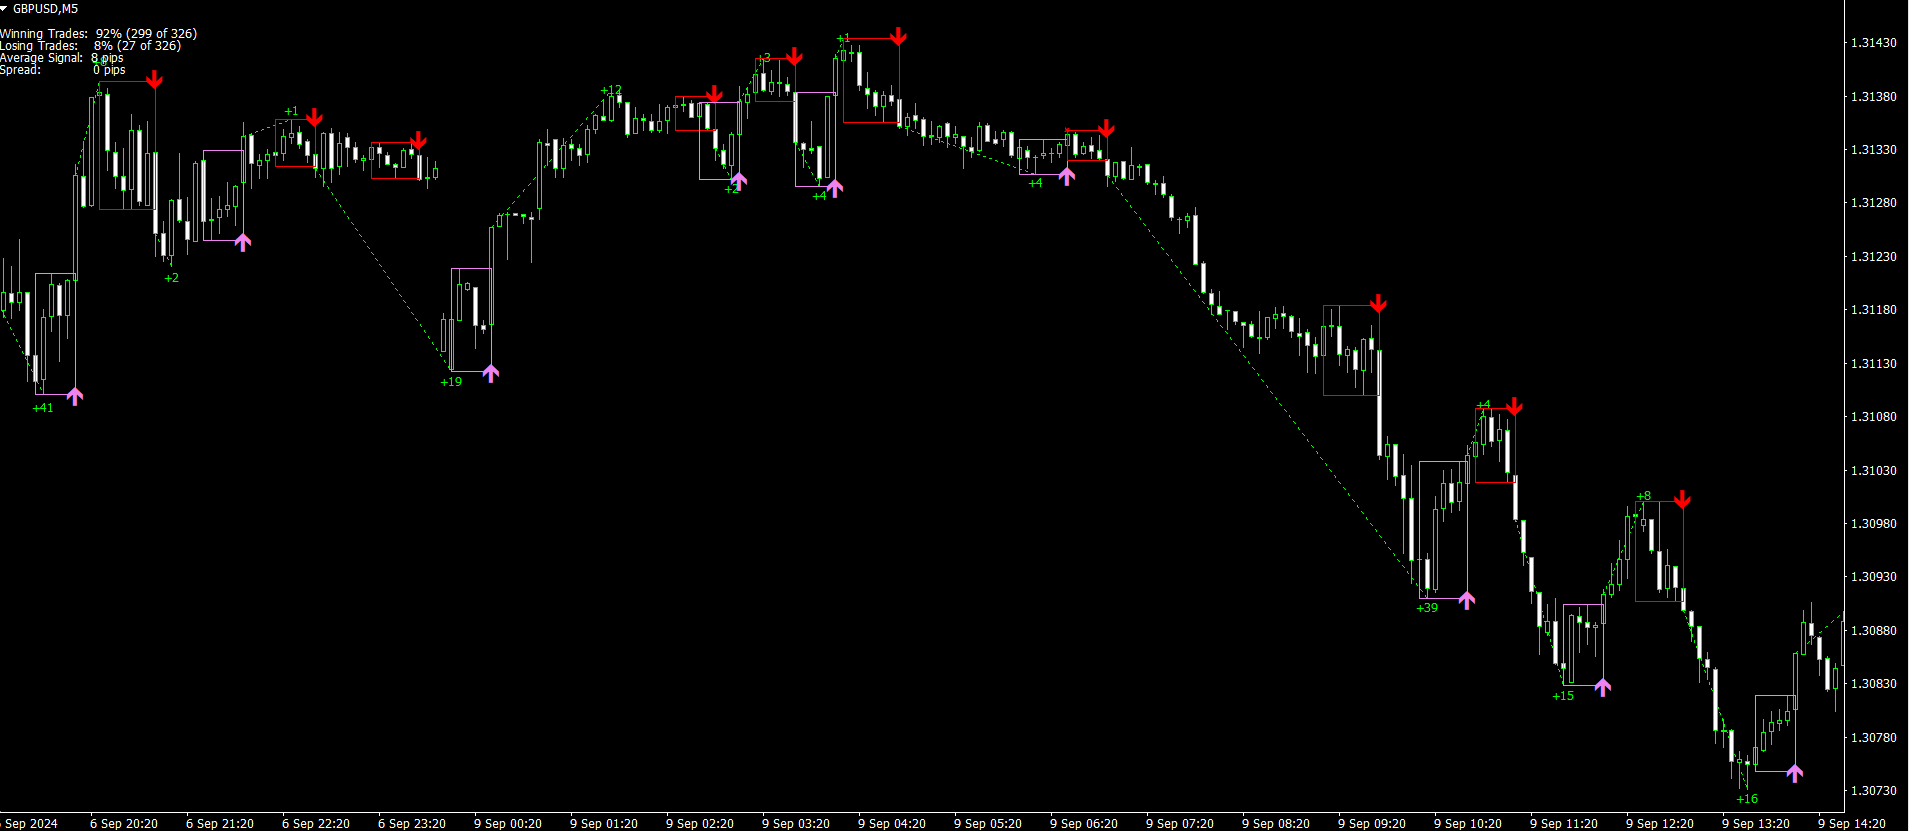
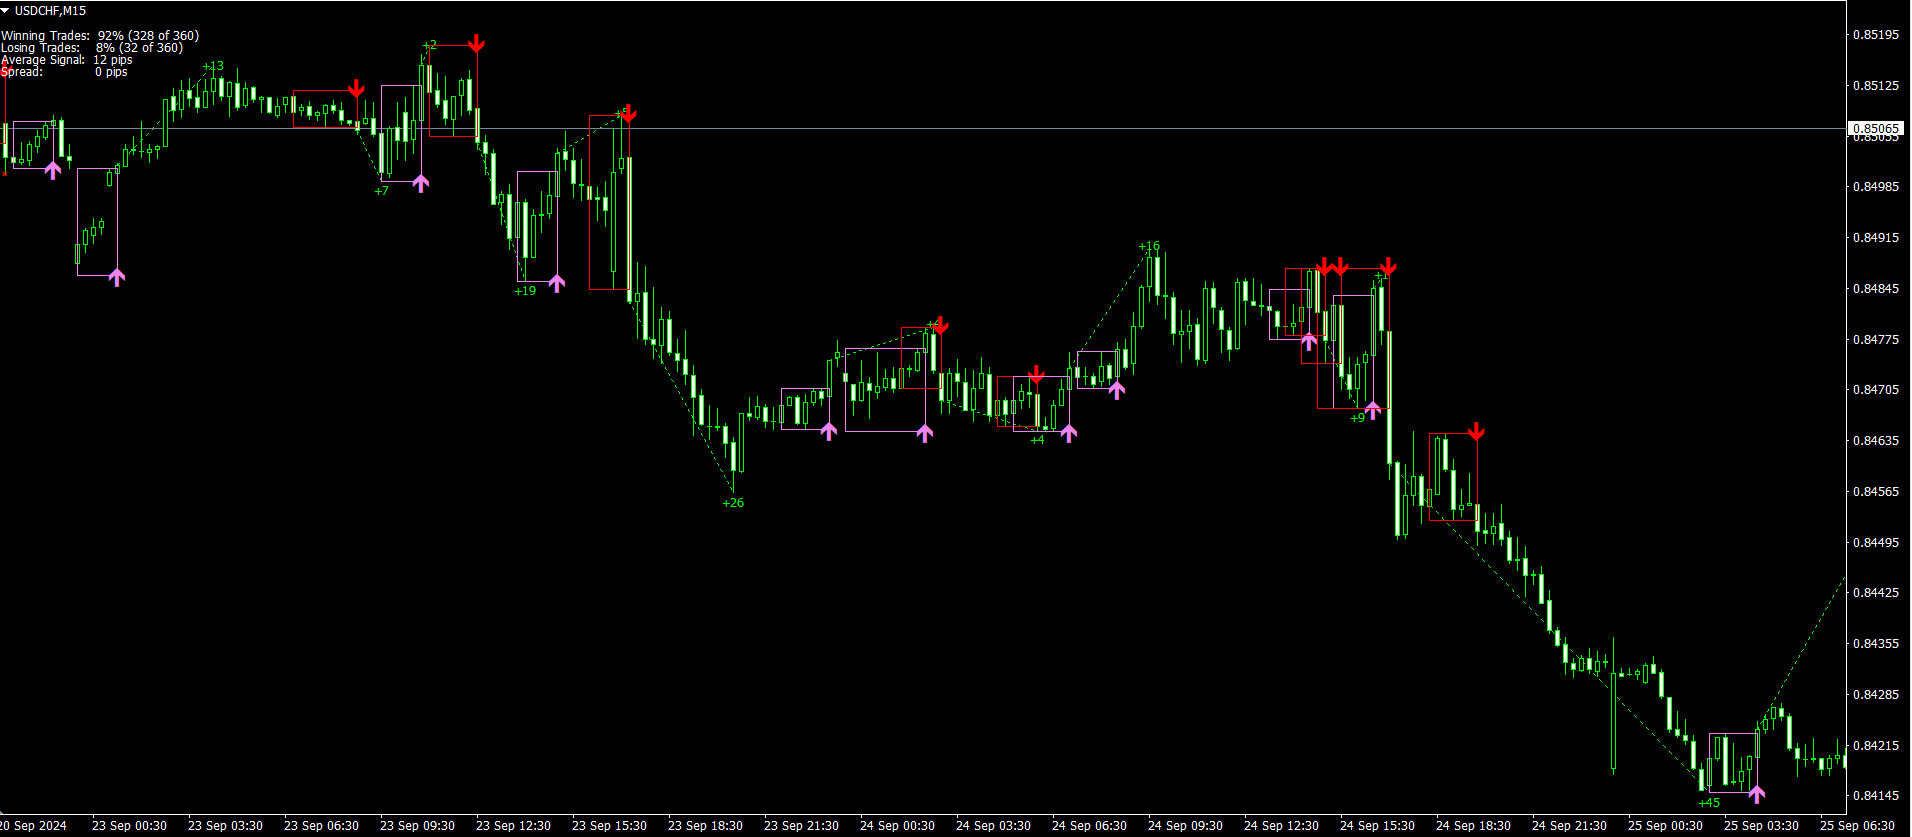
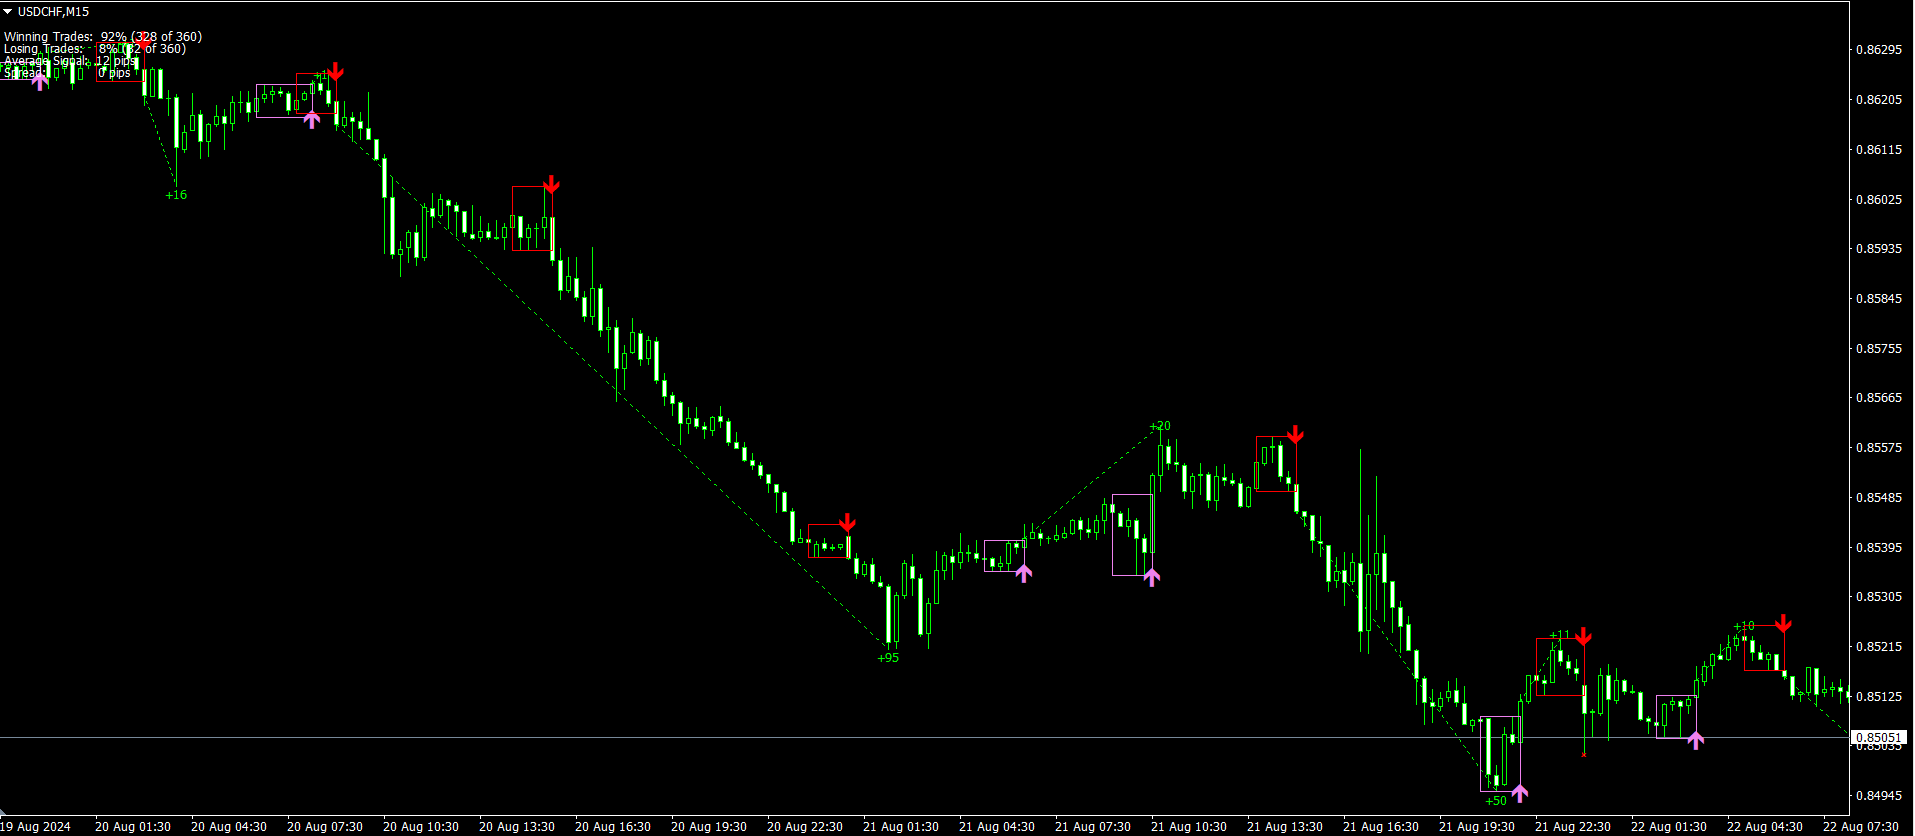
オーダーメイドの精度 チャートに表示される各矢印は綿密な計算に基づいており、最適なエントリーとエグジットの機会を提供します。これらはランダムなシグナルではなく、リアルタイムで市場を分析する正確な指示です。

反転ポイントの正確な検出 このインジケーターは、価格の潜在的な反転ポイントを高精度で識別し、取引において不可欠なツールとなります。信頼できるデータに基づいて生成されたシグナルにより、市場が最も不安定な局面でも利益を最大化できます。

クリーンで読みやすいインターフェース スクリーンショットで見られるように、Forex Scalper Indicatorはチャート上にわかりやすい矢印を表示し、シグナルの読み取りと解釈を簡単にします。最小の動きを捉える場合でも、より明確なシグナルを待つ場合でも、このインジケーターは正確で即時のインサイトを保証します。

なぜForex Scalper Indicatorを選ぶのか?

正確なデータに基づく信頼できるシグナル

短時間フレームのスキャルピング戦略に最適

MT4への簡単なインストールと設定

すべてのレベルのトレーダーに最適


今日、Forex Scalper Indicatorを手に入れて、取引の精度を向上させましょう!正確なデータに基づいて、より情報に基づいた操作を行うチャンスを逃さないでください。
おすすめのプロダクト
We present you the indicator "Candle closing counter", which will become your indispensable assistant in the world of trading. That’s why knowing when the candle will close can help: If you like to trade using candle patterns, you will know when the candle will be closed. This indicator will allow you to check if a known pattern has formed and if there is a possibility of trading. The indicator will help you to prepare for market opening and market closure. You can set a timer to create a p
Was: $249  Now: $99   Market Profile defines a number of day types that can help the trader to determine market behaviour. A key feature is the Value Area, representing the range of price action where 70% of trading took place. Understanding the Value Area can give traders valuable insight into market direction and establish the higher odds trade. It is an excellent addition to any system you may be using. Blahtech Limited presents their Market Profile indicator for the MetaTrader community. Ins
KT Renko Patterns MT4
KEENBASE SOFTWARE SOLUTIONS
2.33 (3)
KT Renko Patterns scans the Renko chart brick by brick to find some famous chart patterns that are frequently used by traders across the various financial markets. Compared to the time-based charts, patterns based trading is easier and more evident on Renko charts due to their uncluttered appearance. KT Renko Patterns features multiple Renko patterns, and many of these patterns are extensively explained in the book titled Profitable Trading with Renko Charts by Prashant Shah. A 100% automate
Super Reversal Pattern Indicator Unlock the power of advanced pattern recognition with our Super Reversal Pattern Indicator. Designed for traders seeking precision and reliability, this indicator identifies one of the most effective reversal patterns in technical analysis, offering a significant edge in your trading strategy. Key Features: Non-Repainting Accuracy: Enjoy the confidence of non-repainting technology. Once a Super Reversal Pattern is detected, it remains static, providing consis
Shark Deal Book
Philip Pankaj Suthagar
4 (3)
Term  "shark"  in the business world denotes a high volume investor who just made a good investment in a highly Potential business deal.So, sharks are the ones who make the market move. In our case, if an American shark bought a Japanese company, he/she has to convert American dollars into Japanese yen to make the deal. So, the demand for the Japanese yen will increase sharply. Thus USD/JPY will go short rapidly if the deal was from the shark. Another example, In the case of forex, if fed increa
Introduction to Chart Pattern MT Chart Pattern MT is a chart pattern scanner to detect the triangle pattern, falling wedge pattern, rising wedge pattern, channel pattern and so on. Chart Pattern MT uses highly sophisticated chart pattern detection algorithm. However, we have designed it in the easy to use with intuitive user interface. Chart Pattern MT will show all the patterns in your chart in the most efficient format for your trading. You do not have to do tedious manual pattern detection an
これは、キャンドルの終値を予測する指標です。 このインジケータは、主にD1チャートでの使用を目的としていますが. この指標は、従来の外国為替取引とバイナリオプション取引の両方に適しています。 インジケーターは、スタンドアロンのトレーディングシステムとして使用することも、既存のトレーディングシステムへの追加として機能させることもできます。 このインジケーターは、現在のキャンドルを分析し、キャンドル自体の内部の特定の強度係数と、前のキャンドルのパラメーターを計算します。 したがって、この指標は、市場の動きのさらなる方向性と現在のキャンドルの終値を予測します。 この方法のおかげで、この指標は、短期の日中取引だけでなく、中期および長期の取引にも適しています。 インジケーターを使用すると、市場の状況の分析中にインジケーターが生成する潜在的な信号の数を設定できます。 インジケーターの設定には、このための特別なパラメーターがあります。 また、インジケーターは、チャート上のメッセージの形式で、電子メールで、およびPUSH通知の形式で、新しい信号について通知することができます。 購入後は必ず私に書いて
M & W Pattern Pro is an advanced scanner for M and W patters , it uses extra filters to ensure scanned patterns are profitable. The indicator can be used with all symbols and time frames. The indicator is a non repaint indicator with accurate statistics calculations. To use , simply scan the most profitable pair using the statistics dashboard accuracy , then enter trades on signal arrow and exit at the TP and SL levels. STATISTICS : Accuracy 1 : This is the percentage of the times price hit
The   Volume Spread Analysis indicator   is based on the original Volume Spread Analysis method. It was designed for quick and easy recognition of VSA patterns. Even though this indicator looks very simple, it is the most sophisticated tool we've ever made. It is a really powerful analytical tool that generates very reliable trading signals. Because it is very user-friendly and understandable, it is suitable for every type of trader, regardless of his experience. What is VSA? VSA - Volume Spr
The Supply and Demand Zones indicator is one of the best tools we have ever made. This great tool automatically draws supply and demand zones, the best places for opening and closing positions. It has many advanced features such as multi timeframe zones support, displaying the width of zones, alert notifications for retouched zones, and much more. Because of market fractality, this indicator can be used for any kind of trading. Whether you are a positional, swing, or intraday trader does not ma
A technical indicator that calculates its readings on trading volumes. In the form of a histogram, it shows the accumulation of the strength of the movement of the trading instrument. It has independent calculation systems for bullish and bearish directions. Works on any trading instruments and time frames. Can complement any trading system. The indicator does not redraw its values, the signals appear on the current candle. It is easy to use and does not load the chart, does not require additi
The Th3Eng PipFinite indicator is based on a very excellent analysis of the right trend direction with perfect custom algorithms. It show the true direction and the best point to start trading. With StopLoss point and Three Take Profit points. Also it show the right pivot of the price and small points to order to replace the dynamic support and resistance channel, Which surrounds the price. And Finally it draws a very helpful Box on the left side on the chart includes (take profits and Stop loss
Daily FIBO Pro
Mark Thimoty Evangelista
BERG Daily FIBO Proであなたのトレーディングの可能性を解き放とう BERG Daily FIBO Pro   は、MetaTrader 4 (MT4) プラットフォーム専用に設計された強力でカスタマイズ可能なフィボナッチ・リトレースメント指標です。経験豊富なトレーダーであれ、初心者であれ、このインジケーターは重要なサポートとレジスタンスレベルを識別し、市場分析を向上させ、トレーディング戦略を最適化するための理想的なツールです。 BERG Daily FIBO Proを選ぶ理由   フィボナッチ分析の精度:   前日の高値と安値に基づいて自動的に計算されたフィボナッチ・リトレースメントレベルで、市場での優位性を手に入れましょう。 BERG Daily FIBO Pro   は、0%、23.6%、38.2%、50%、61.8%、78.6%、100% の各レベルを描画し、潜在的な市場の転換点を簡単に特定できるようにします。   インテリジェントアラートシステム:   カスタマイズ可能なアラートで、価格がフィボナッチレベルに触れた時に通知されるため、チャンスを逃し
This unique multi-currency strategy simultaneously determines the strength of trends and market entry points, visualizing this using histograms on the chart. The indicator is optimally adapted for trading on the timeframes М5, М15, М30, Н1. For the convenience of users, the indicator renders the entry point (in the form of an arrow), recommended take profit levels (TP1, TP2 with text labels) and the recommended Stop Loss level. The take profit levels (TP1, TP2) are automatically calculated for
の紹介     Quantum平均足PRO チャート 市場のトレンドに対する明確な洞察を提供するように設計された平均足キャンドルは、ノイズを除去し、誤ったシグナルを排除する能力で知られています。混乱を招く価格変動に別れを告げ、よりスムーズで信頼性の高いチャート表現を導入しましょう。 Quantum Heiken Ashi PRO を真にユニークなものにしているのは、従来のローソク足データを読みやすい色のバーに変換する革新的なフォーミュラです。赤と緑のバーはそれぞれ弱気トレンドと強気トレンドをエレガントに強調し、潜在的なエントリーポイントとエグジットポイントを驚くほど正確に見つけることができます。 量子EAチャネル:       ここをクリック MT5のバージョン:       ここをクリック この注目すべき指標には、いくつかの重要な利点があります。 明確性の向上: 価格変動を平滑化することで、平均足バーは市場トレンドをより明確に表現し、有利な取引機会を特定しやすくします。 ノイズの削減: 誤ったシグナルを引き起こすことが多い不安定な価格変動に別れを告げます。 Quan
マーケットシェーバー   マーケットスカルパー このインジケーターはRPTradeProSolutionsシステムの一部です。 Market Scalperは、プライスアクション、ダイナミックサポート、レジスタンスを使用した毎日のトレンド指標です。 誰でも使用できるように設計されており、トレーディングの初心者でも使用できます。 決して塗り直さないでください。 表示は近いものから近いものへと示されます。 単独で使用するように設計されているため、他のインジケーターは必要ありません。 明確でシンプルな表示を提供します どのように機能しますか MarketShaverはDualTimeFramesシステムを使用しています。 主な傾向はより高いTFによって取られますが、より速いものは取引を閉じるために使用されます トレードは1つずつ示され、同時に2つのトレードが存在することはありません。 マーケットシェーバーは次のことを示しています。 いつ取引するか いつそれを止めるか、利益か損失か。 貿易報酬 適切な期間終了TFを設定するのに役立つ多くの統計 マーケットシェーバーは動作します
Gold Bricks FX USES THE TREND WAVE INDICATOR AND IT CAN IDENTIFY THE BEGINNING AND THE END OF A NEW WAVE TREND MOVEMENT. AS AN OSCILLATOR, THE INDICATOR IDENTIFIES THE OVERBOUGHT AND OVERSOLD ZONES. IT WORKS GREAT TO CATCH THE SHORT TERM PRICE REVERSALS AND USES A MARTINGALE STRATEGY TO CLOSE ALL TRADES IN PROFIT. USE DEFAULT SETTINGS ON H1 OR HIGHER TIME FRAME ON ANY PAIR FOR MORE ACCURATE TRADES WHY THIS EA : Smart entries calculated by 4 great strategies The EA can be run on even a
This is a new strategy for SUPPLY DEMAND areas It is based on a calculation using the tick volume to detect the big price action in market for both bear /bull actions this smart volume action candles are used to determine the supply and demand areas prices in between main supply and demand lines indicate sideway market  up arrows will be shown when prices moves above the main supply and the secondary supply lines Down arrows will be shown when prices moves below the main demand and the secondary
Forex Gump
Andrey Kozak
2.4 (5)
Forex Gump is a fully finished semi-automatic trading system. In the form of arrows, signals are displayed on the screen for opening and closing deals. All you need is to follow the instructions of the indicator. When the indicator shows a blue arrow, you need to open a buy order. When the indicator shows a red arrow, you need to open a sell order. Close orders when the indicator draws a yellow cross. In order to get the most effective result, we recommend using the timeframes H1, H4, D1. There
Mean Reversion Supply Demand Indicator Mean Reversion Supply Demand is the indicator to detect the important supply demand zone in your chart. The concept of supply demand trading relies on the quantity mismatching between buying and selling volumes in the financial market. Typically, supply demand zone serves to predict the turning point. The wave pattern, for any supply demand zone to work as an successful trade, looks like the price must touch the base zone, move away and then return to zone
Owl smart levels
Sergey Ermolov
4.34 (35)
MT5版  |   FAQ Owl Smart Levels Indicator   は、 Bill Williams   の高度なフラクタル、市場の正しい波構造を構築する Valable ZigZag、エントリの正確なレベルをマークする Fibonacci レベルなどの一般的な市場分析ツールを含む 1 つのインジケーター内の完全な取引システムです。 利益を得るために市場と場所に。 戦略の詳細な説明 インジケータを操作するための指示 顧問-取引助手 プライベートユーザーチャット ->購入後に私に書いて、私はプライベートチャットにあなたを追加し、あなたはそこにすべてのボーナスをダウンロードすることができます 力はシンプルさにあります! Owl Smart Levels   取引システムは非常に使いやすいので、専門家にも、市場を勉強し始めて自分で取引戦略を選択し始めたばかりの人にも適しています。 戦略と指標に秘密の数式や計算方法が隠されているわけではなく、すべての戦略指標は公開されています。 Owl Smart Levels を使用すると、取引を開始するためのシグナルをすばやく確認し、
フィボナッチリトレースと拡張ラインツール DiNapoliポイント取引方法とゴールデンセクション取引を使用するトレーダーにとって理想的なMT4プラットフォームのフィボナッチリトレースと拡張ラインツール 主な特長: あなたはフィボナッチリトレースメントの複数のセットを直接描くことができ、重要なリターンポイント間の関係は一目瞭然です。 2.フィボナッチ拡張を描画することができます。 3.フィボナッチフォールドバックとラインの延長は、簡単な観察と数値表示のために左右に動かすことができます。 4.チャートは非常に爽やかな 5.数字キーでサイクルを切り替えることができます。 ファンクションキー: 1。 [戻るを押す、要求に応じて描画する、最大8つのグループにする 2。拡張]を描くには[押す] 3。 \を押すと、現在のサイクルの下にあるすべての拡張機能と折り畳みが削除されます 4。フォールドバックを移動して削除して展開する (1)最初のフォールドバックセットのF5行をクリックします。 一度クリックすると(黄色に変わります)、キーボードのDel
Volume Profile Indicator for MT4 Gain a trading edge with the "Volume Profile" indicator for MetaTrader 4 (MT4). This advanced technical analysis tool allows you to precisely identify key support and resistance levels based on transaction volume. Easily visualize market areas of high interest, where trading volumes are highest, and use this information to make more informed trading decisions. Key Features: Clear and detailed visualization : The indicator displays volume histograms directly on th
VR Cub
Vladimir Pastushak
VR Cub は、質の高いエントリーポイントを獲得するためのインジケーターです。このインジケーターは、数学的計算を容易にし、ポジションへのエントリーポイントの検索を簡素化するために開発されました。このインジケーターが作成されたトレーディング戦略は、長年にわたってその有効性が証明されてきました。取引戦略のシンプルさはその大きな利点であり、初心者のトレーダーでもうまく取引することができます。 VR Cub はポジション開始ポイントとテイクプロフィットとストップロスのターゲットレベルを計算し、効率と使いやすさを大幅に向上させます。取引の簡単なルールを理解するには、以下の戦略を使用した取引のスクリーンショットを見てください。 設定、設定ファイル、デモ版、説明書、問題解決方法は、以下から入手できます。 [ブログ] レビューを読んだり書いたりすることができます。 [リンク] のバージョン [MetaTrader 5] エントリーポイントの計算ルール ポジションをオープンする エントリーポイントを計算するには、VR Cub ツールを最後の高値から最後の安値までストレッチする必要があります。
The Penta-O is a 6-point retracement harmonacci pattern which usually precedes big market movements. Penta-O patterns can expand and repaint quite a bit. To make things easier this indicator implements a twist: it waits for a donchian breakout in the right direction before signaling the trade. The end result is an otherwise repainting indicator with a very reliable trading signal. The donchian breakout period is entered as an input. [ Installation Guide | Update Guide | Troubleshooting | FAQ | A
Supply and Demand Indicator + FREE Currency Strength Meter ADD-ON Looking for a powerful tool that can help you identify the most reactive zones in the forex market? Our supply and demand indicator for MetaTrader 4 and 5 is exactly what you need. With its advanced algorithms and real-time analysis, this indicator helps traders of all experience levels make informed trading decisions. The supply and demand indicator is a cutting-edge tool that helps traders identify areas where buyers and seller
This indicator allows to analyze a chart using the rule of supple and demand. You will see zones of sales and purchases and determine the most profitable points to open positions. The indicator is based on the principle of market fractality. Chart zones show places where a strong buyer or seller has made the price reverse and change its direction. The indicator has several types of zones calculation. Color and type of zones displaying are set as desired. The zone width can be displayed in pips.
Price Breakout pattern Scanner is the automatic scanner for traders and investors. It can detect following patterns automatically from your chart. Head and Shoulder - Common tradable pattern. Reverse Head and Shoulder - This pattern is the reverse formation of the Head and Shoulder. Double Top - When the price hits resistance level twice and decline toward the support level, the trader can anticipate sudden bearish breakout through the support level. Double Bottom - The double bottom pattern is
PipFinite Exit EDGE
Karlo Wilson Vendiola
4.83 (115)
Did You Have A Profitable Trade But Suddenly Reversed? In a solid strategy, exiting a trade is equally important as entering. Exit EDGE helps maximize your current trade profit and avoid turning winning trades to losers. Never Miss An Exit Signal Again Monitor all pairs and timeframes in just 1 chart www.mql5.com/en/blogs/post/726558 How To Trade You can close your open trades as soon as you receive a signal Close your Buy orders if you receive an Exit Buy Signal. Close your Sell orde
このプロダクトを購入した人は以下も購入しています
まず第一に、この取引インジケーターは再描画されず、再描画されず、遅延しないことを強調する価値があります。これにより、手動取引とロボット取引の両方に理想的なものになります。 ユーザーマニュアル:設定、入力、戦略。 アトミックアナリストは、価格の強さとモメンタムを利用して市場でより良いエッジを見つけるためのPA価格アクションインジケーターです。ノイズや誤ったシグナルを除去し、取引ポテンシャルを高めるための高度なフィルターを備えています。複雑なインジケーターの複数のレイヤーを使用して、アトミックアナリストはチャートをスキャンし、複雑な数学的計算をシンプルなシグナルと色に変換します。これにより、どのような初心者トレーダーでも理解して使用し、一貫した取引の決定を行うことができます。 「アトミックアナリスト」は、新規および経験豊富なトレーダー向けにカスタマイズされた包括的な取引ソリューションです。プレミアムインジケーターとトップノッチの機能を1つの取引戦略に組み合わせ、すべてのタイプのトレーダーにとって汎用性のある選択肢にします。 デイリートレーディングとスキャルピング戦略:高
Enigmera
Ivan Stefanov
5 (3)
エニグメラ:市場の中核 https://www.enigmera.com はじめに このインディケータと取引システムは、金融市場に対する驚くべきアプローチです。ENIGMERAは、フラクタルサイクルを使用して、サポートとレジスタンスレベルを正確に計算します。本格的な蓄積局面を示し、方向性と目標を示します。 トレンド中でも調整中でも機能するシステムです。 どのように作動するのか? ENIGMERAは、支持線・抵抗線、目標線、乖離線の3つのラインで構成されています。このシステムは、過去のデータを現在と未来に外挿する典型的な市場指標とは異なり、現在の完全な画像を提供します。支持線上にある場合、それは本当の支持を意味し、抵抗線上にある場合、それは本当の抵抗を意味する。ある水準が破られた場合、それはトレンドの変化を意味する。再描画はしない。 市場は常に進化しているため、ENIGMERAはその評価ツールを適応させ、定期的に戦略を修正しています。  これにより、すべてのシナリオが徹底的に評価されることが保証されます。この市場指標の独自性は、その能力を見れば明らかです。  ENIGM
現在20%OFF! 初心者やエキスパートトレーダーのためのベストソリューション! このダッシュボードソフトウェアは、28の通貨ペアで動作しています。それは私達の主要な指標(高度な通貨の強さ28と高度な通貨インパルス)の2に基づいています。それは全体の外国為替市場の大きい概観を与えます。それは、すべての(9)時間枠で28の外国為替ペアのための高度な通貨の強さの値、通貨の動きの速度と信号を示しています。チャート上で1つのインディケータを使用して市場全体を観察し、トレンドやスキャルピングの機会をピンポイントで見つけることができたら、あなたのトレードがどのように改善されるか想像してみてください。 このインディケータには、強い通貨と弱い通貨の識別、潜在的な取引の識別と確認がより簡単になるような機能が搭載されています。このインディケータは、通貨の強さや弱さが増加しているか減少しているか、また、すべての時間枠でどのように機能しているかをグラフィカルに表示します。 新機能として、現在の市場環境の変化に適応するダイナミックなマーケットフィボナッチレベルが追加され、すでに当社のAdvan
Dynamic Forex28 Navigator - 次世代の Forex 取引ツール。 現在 49% オフ。 Dynamic Forex28 Navigator は、長年人気のインジケーターを進化させたもので、3 つの機能を 1 つにまとめています。 Advanced Currency Strength28 インジケーター (レビュー 695 件)  + Advanced Currency IMPULSE with ALERT (レビュー 520 件) + CS28 コンボ シグナル (ボーナス)。 インジケーターの詳細 https://www.mql5.com/en/blogs/post/758844 次世代の Strength インジケーターが提供するもの  オリジナルで気に入っていたすべての機能が、新機能と精度の向上によって強化されました。 主な機能: 独自の通貨強度計算式。 すべての時間枠でスムーズかつ正確な強度ライン。 トレンドの特定と正確なエントリーに最適です。 ダイナミックマーケットフィボナッチレベル (マーケットフィボナッチ)。 このインジケー
指示する     ロシア     -        utilizar con   el indicador の ESP 推奨事項 -   TPSpro トレンド プロフェッショナル版 -   MT5のバージョン 最も重要なことは、将来においても最も重要なことです。 機能のプリンシパル: ゾーンのほとんどは、ベンダーとコンプラドールによってアクティブ化されます。 状況を直感的に把握できるよう、初期の衝動を修正します。 LOGIC AI: MUESTRA zonas (círculos) parabuscar puntos de entrada cuando se activa una plantilla 視覚的に優れた視覚効果があり、最も重要な機能がすべて揃っていることに注意してください。 優れたニベレス/ゾーンの視覚化 (modo MTF) 世界で最も人気のある場所/ゾーンです。これを使用するのに最適な方法です (   TPSproTREND PRO   )。 アルゴリズム プロフェッショナル セパラド パソ ア パソ パラ オペラ それは、オペラハウスやコントラ・デ・エラの指導におい
Gold Channel is a volatility-based indicator, developed with a specific timing algorithm for the XAUUSD pair, which consists of finding possible corrections in the market. This indicator shows two outer lines, an inner line (retracement line) and an arrow sign, where the theory of the channel is to help identify overbought and oversold conditions in the market. The market price will generally fall between the boundaries of the channel. If prices touch or move outside the channel it is a tra
Precautions for subscribing to indicator This indicator only supports the computer version of MT4 Does not support MT5, mobile phones, tablets The indicator only shows the day's entry arrow The previous history arrow will not be displayed (Live broadcast is for demonstration) The indicator is a trading aid Is not a EA automatic trading No copy trading function The indicator only indicates the entry position No exit (target profit)  The entry stop loss point is set at 30-50 PIPS Or the front
TrendMaestro
Stefano Frisetti
5 (3)
note: this indicator is for METATRADER4, if you want the version for METATRADER5 this is the link:  https://www.mql5.com/it/market/product/108106 TRENDMAESTRO ver 2.4 TRENDMAESTRO recognizes a new TREND in the bud, he never makes mistakes. The certainty of identifying a new TREND is priceless. DESCRIPTION TRENDMAESTRO identifies a new TREND in the bud, this indicator examines the volatility, volumes and momentum to identify the moment in which there is an explosion of one or more of these data a
NAM Order Blocks
NAM TECH GROUP, CORP.
5 (1)
MT4マルチタイムフレームオーダーブロック検出インジケーター。 特徴 -チャートコントロールパネルで完全にカスタマイズ可能で、完全な相互作用を提供します。 -必要な場所でコントロールパネルを表示および非表示にします。 -複数の時間枠でOBを検出します。 -表示するOBの数量を選択します。 -さまざまなOBユーザーインターフェイス。 -OBのさまざまなフィルター。 -OB近接アラート。 -ADRの高線と低線。 -通知サービス(画面アラート|プッシュ通知)。 概要 注文ブロックは、金融機関や銀行からの注文収集を示す市場行動です。著名な金融機関と中央銀行が外国為替市場を牽引しています。したがって、トレーダーは市場で何をしているのかを知る必要があります。市場が注文ブロックを構築するとき、それは投資決定のほとんどが行われる範囲のように動きます。 注文の構築が完了すると、市場は上向きと下向きの両方に向かって急激に動きます。注文ブロック取引戦略の重要な用語は、機関投資家が行っていることを含むことです。それらは主要な価格ドライバーであるため、機関投
現在20%OFF! このダッシュボードは、複数のシンボルと最大9つのタイムフレームで動作するソフトウェアの非常に強力な部分です。 このソフトは、弊社のメインインジケーター(ベストレビュー:Advanced Supply Demand)をベースにしています。    Advanced Supply Demand ダッシュボードは、素晴らしい概要を提供します。それは示しています。  ゾーン強度評価を含むフィルタリングされた需給値。 ゾーン内/ゾーンへのPips距離。 ネストされたゾーンがハイライトされます。 選択されたシンボルの4種類のアラートを全ての(9)時間枠で提供します。 それはあなたの個人的なニーズに合わせて高度に設定可能です。 あなたの利益! すべてのトレーダーにとって最も重要な質問です。 市場に参入するのに最適なレベルはどこか? 成功のチャンスとリスク/リターンを得るために、強力な供給/需要ゾーン内またはその近くで取引を開始します。 損切りの最適な位置はどこですか? 最も安全なのは、強力な供給/需要ゾーンの下/上にストップを置くことで
Indicator : RealValueIndicator Description : RealValueIndicator is a powerful tool designed specifically for trading on the EURUSD pair. This indicator analyzes all EUR and USD pairs, calculates their real currency strength values, and displays them as a single realistic value to give you a head start on price. This indicator will tell you moves before they happen if you use it right. RealValueIndicator allows you to get a quick and accurate overview of the EURUSD currency pair tops and bottoms,
This indicator is based on the Gann Signal indicator and acts as a market scanner. All you need to do is fill in the selected currency pairs in the settings and that’s it. Next, the indicator itself will view all these currency pairs and time frames from M5 to D1 simultaneously. When a new signal appears, the indicator will give you an Alert and also draw the letter N where this new signal will be.
Bomb Bank Signal
Igor Pereira Calil
5 (1)
Bomb Bank シグナル: MetaTrader 4 の信頼度インジケーター Bomb Bank Signal は、金融市場で最も関連性の高いトレンドを特定するように設計された MetaTrader 4 の強力なインジケーターです。動きを正確に予測するツールをお探しなら、Bomb Bank が最適です。 仕組み: このインジケーターは、出来高分析、ローソク足終値、対称トレンドという 3 つの異なる方法を組み合わせて、売買の機会を検出してシグナルを送ります。 Bomb Bank は、買いの機会を特定するときは「爆弾」のようなものであり、売りシグナルを検出するときは「ドクロ」のようなものです。 ボムバンクはなぜ違うのですか? 完全な信頼性: Bomb Bank Signal は信号を削除しません。一度シグナルが発せられると、シグナルは残り続けるので、チャンスを逃すことはありません。 極めて高い精度: Bomb Bank は誤った信号を送信しません。リアルタイムで最新情報を更新し、市場の進化に合わせて調整しながら、以前のシグナルの透明性を維持します。 ライブアップデ
もちろんです。以下は、提供いただいたテキストの日本語への翻訳です: MT4用の天文学指標をご紹介します:究極の天体トレーディングコンパニオン トレーディング体験を天空の高みに高める準備はできていますか?私たちの革命的なMT4用の天文学指標をご紹介します。この革新的なツールは、複雑なアルゴリズムの力を借りて、類まれなる天文学的洞察と精密な計算を提供します。 あなたの指先で宇宙の情報を: 宝のような天文学的データが明らかになる包括的なパネルをご覧ください。惑星の地理的/太陽中心座標、太陽と地球の距離、星の大きさ、伸び、星座、黄道座標および赤道座標、さらには水平座標まで、それぞれが綿密に計算され美しく表示されています。指標によって生成される垂直線は時間値に対応し、トレーディングの旅に宇宙の視点を提供します。 惑星のラインと関係: グラフを飾る惑星のラインの魔法を体験し、スケールと角度をカスタマイズできます。直感的なコントロールパネルを介して各惑星のラインの表示を簡単に切り替えることができます。指定された時刻範囲内での合会、六分会、四分会、三分会、対会、逆行の指標で天体の関係の芸術を発見してく
製品を購入する前に、以下の情報をお読みください。 Apollo Pips PLUS SP はユニークな製品です。これは、私の新しい「アポロ ピップス」インジケーターと、私のすべての取引インジケーターにアクセスできる「スーパー パック」ボーナスを手に入れたい人のためのものです。 Apollo Pips PLUS SP 製品を購入すると、実際には私の Apollo Pips インジケーターのまったく新しいバージョンを購入することになります。このバージョンのインジケーターには改良されたアルゴリズムと使いやすいパラメーターがあり、あらゆる市場およびあらゆる取引スタイルでインジケーターを使用する機会が得られます。 この製品の購入者は、私のスーパーボーナスとして、他のすべてのインジケーターにも無料でアクセスできます!私のすべての取引ツールにアクセスしたい場合は、この製品が最適です!:) しかし、これがすべてではありません!:) この製品のすべての購入者は、私の新しいインジケーターを無料で入手する資格もあります!:)新しい取引インジケーターを利用できるようになりました。私の特権のある「スーパー パッ
ON Trade Waves Patterns Harmonic Elliot Wolfeをご紹介します。これは手動および自動の方法を使用して市場のさまざまなパターンを検出するために設計された高度なインジケーターです。以下はその動作方法です: ハーモニックパターン: このインジケーターは、チャートに表示されるハーモニックパターンを識別できます。これらのパターンは、Scott Carneyの「Harmonic Trading vol 1および2」で説明されているように、ハーモニックトレーディング理論を実践するトレーダーにとって重要です。手動で描画するか、自動検出に頼るかにかかわらず、ON Trade Waves Patternsがお手伝いします。 コントロールパネル: このインジケーターはユーザーフレンドリーなコントロールパネルを備えています。チャートと時間枠の設定を保存し、異なる構成間をスムーズに切り替えることができます。チャートスペースを最大限に活用するために最小化することもできます。他の分析ツールで作業することを好む場合、閉じるボタンをクリックするだけで、すべてのインジケーターデ
今、147ドル(いくつかの更新後に499ドルに増加します) - 無制限のアカウント(PCSまたはMac) RelicusRoad ユーザー マニュアル + トレーニング ビデオ + プライベート Discord グループへのアクセス + VIP ステータス 市場の新しい見方 RelicusRoad は、外国為替、先物、暗号通貨、株式、および指数の世界で最も強力な取引インジケーターであり、トレーダーに収益を維持するために必要なすべての情報とツールを提供します。初心者から上級者まで、すべてのトレーダーが成功するためのテクニカル分析と取引計画を提供します。これは、将来の市場を予測するのに十分な情報を提供する重要な取引指標です。意味をなさないチャート上のいくつかの異なる指標ではなく、完全な解決策を信じています.これは、信号、矢印 + 価格アクション情報を表示するオールインワンのインジケーターで、他に類を見ない非常に正確です。 強力な AI に基づいて、RelicusRoad は不足している情報とツールを提供して、あなたを教育し、トレーディングのプロ、成功したトレーダーにします。
3 Indicators in 1 indicator Strategy based on price action Made specifically for the best forex currency pairs Can be used in the best time frame of the market at a very reasonable price This indicator is basically 3 different indicatos . But we have combined these 3 indicators in 1 indicator so that you can use 3 indicators at the lowest price. All three strategies are based on price action. But based on different trends. Long term, medium term and short term Attributes : No repaintin
Currency pairs never go up or down in a straight line. They rise and fall constantly, creating pullbacks and reversals. And with each rise and fall, so your emotions rise and fall. Hope, then fear, then hope. This is when the market will try to frighten you out of a strong position. It is when you are most vulnerable. But not if you have the Quantum Trend Monitor. And here, you even get two indicators for the price of one! The Quantum Trend Monitor has been designed to absorb these temporary pau
The Quantum VPOC indicator has been developed to expand the two dimensional study of volume and price, to a three dimensional one which embraces time. The volume/price/time relationship then provides real insight to the inner workings of the market and the heartbeat of sentiment and risk which drives the price action accordingly. The Quantum VPOC indicator displays several key pieces of information on the chart as follows: Volume Profile - this appears as a histogram of volume on the vertical pr
The AT Forex Indicator MT4 is a sophisticated trading tool designed to provide traders with a comprehensive analysis of multiple currency pairs. This   powerful indicator   simplifies the complex nature of the forex market, making it accessible for both novice and experienced traders. AT Forex Indicator uses   advanced algorithms   to detect trends, patterns and is an essential tool for traders aiming to enhance their forex trading performance. With its robust features, ease of use, and reliabl
Volatility Trend System - a trading system that gives signals for entries. The volatility system gives linear and point signals in the direction of the trend, as well as signals to exit it, without redrawing and delays. The trend indicator monitors the direction of the medium-term trend, shows the direction and its change. The signal indicator is based on changes in volatility and shows market entries. The indicator is equipped with several types of alerts. Can be applied to various trading
まず最初に、このトレーディングシステムがリペイントされず、再描画されず、遅延しないことを強調する価値があります。これにより、プロのトレーディングに最適な状態になります。 オンラインコース、ユーザーマニュアル、デモ。 「スマートサポートアンドレジスタンストレーディングシステム」は、新規および経験豊富なトレーダー向けにカスタマイズされた高度なインジケーターです。この包括的なシステムは、7以上の戦略、10のインジケーター、およびデイトレード戦略、スイングトレード戦略、サポートおよびレジスタンス戦略、ローソク足パターン戦略、VWAP戦略、マルチタイムフレームトレンド戦略など、さまざまなトレーディングアプローチを組み合わせています。これは、矢印信号、エントリーポイント、出口ポイント、トレードアラート、より高い時間枠のトレンド分析、リアルタイムのトレードモニタリング、そして洞察力のあるトレンドとボリュームキャンドルの着色を提供します。自動的なサポートとレジスタンスの検出により、さまざまな市況下でトレーダーが的確な決定を下すのを支援する多面的なインジケーターとなっています。 スマートサポートア
ECM Elite Channel is a volatility-based indicator, developed with a specific time algorithm, which consists of finding possible corrections in the market. This indicator shows two outer lines, an inner line (retracement line) and an arrow sign, where the channel theory is to help identify overbought and oversold conditions in the market. The market price will generally fall between the boundaries of the channel. If prices touch or move outside the channel, it's a trading opportunity. The
An arrow indicator showing price reversals and following the trend. The indicator determines price reversals on the chart and is suitable for scalping on TF 1M-5M and day trading on TF 1H and 4H. Buy and sell arrows are displayed on the chart as entry signals. Diamonds are displayed behind the arrows as a continuation of the signal. They are not repainted and are formed after the candle closes. Red arrows are buy signals. Orange arrows are sell signals. The indicator also contains green pre
Theq HAG
Luis Alberto Vazquez Carpio
5 (6)
___________________________________________________________________________________________________ THEQ HAG Indicator. ___________________________________________________________________________________________________ - THEQ HAGインジケーターには、シグナルを表示する利益最大化と損失最小化の数学アルゴリズムがあります. -シグナルでトレンドと取引し、利益アラートシグナルを受け取ります。 -このインジケーターは、バーが閉じられた後、再計算、再描画、バック再描画、または遅延することはありません。 -すべての時間枠と通貨のペア。
How to use Pair Trading Station Pair Trading Station is recommended for H1 time frame and you can use it for any currency pairs. To generate buy and sell signal, follow few steps below to apply Pair Trading Station to your MetaTrader terminal. When you load Pair Trading Station on your chart, Pair Trading station will assess available historical data in your MetaTrader platforms for each currency pair. On your chart, the amount of historical data available will be displayed for each currency pai
The indicator " ZigZag on Trend " is an assistant in determining the direction of price movement, as well as a calculator of bars and points. It consists of a trend indicator, which follows the price direction by the trend line presented in the form of a zigzag and a counter calculating the number of bars traversed in the direction of the trend and the number of points on the vertical scale. (calculations are carried out by the opening of the bar) The indicator does not redraw. For convenience,
Cluster indicator working in the price channel. For operation, the indicator builds a channel line - (dashed line). Inside the channel, cluster sections are determined that determine the direction of the price movement - (histograms in two directions), start with large arrows. Small arrows are plotted above / below each histogram - indicator increase volatility. The indicator does not redraw the values. Works on any tools and timeframes. Entrances are made when large arrows appear, inside s
Septermber OFFER 85% OFF next price for unlimited version will be 2500$. This is the only time you can get this institutional and professional indicator at this price for unlimited version. Don't dare to miss this. The tool I am about to introduce to you you can't compare it with other tools due to its strategy and accuracy level in predicting the next price directional movement. This tool is designed for serious traders who have decided to make a difference through trading. Be the next person t
作者のその他のプロダクト
Ultimate Gold Advisor for MetaTrader 4 – 成功を保証する最先端のトレーディングツール! Ultimate Gold Advisorは単なるインジケーターではなく、MetaTrader 4でのトレーディングアプローチを革命的に変えるテクノロジーの宝石です。最も要求の厳しいトレーダーのニーズを満たすように設計されたこの最先端のインジケーターは、外科的な精度、洗練された分析、強力な機能を組み合わせて、市場での無敵の競争優位性を提供します。金の取引に最適ですが、幅広い資産に対応できるUltimate Gold Advisorは、あなたの真の利益の可能性を引き出す鍵です。 Ultimate Gold Advisorがすべてのトレーダーにとって必需品である理由は? 優れたパフォーマンス:成功率が驚異の89%に達するこのインジケーターは、信頼性が高いだけでなく、非常に効果的です。勝ちトレードと負けトレードはすべてグラフ上で明確に表示され、リアルタイムで戦略の真の潜在能力を確認できます。これにより、アプローチを最適化し、数学的な精度で利益を最大化できます。 明確
Follow Line インジケーターは、マーケットのトレンドを正確に把握し、フォローするための重要なツールです。このインジケーターは、価格変動に動的に適応し、価格の動きを滑らかかつ継続的に追跡するラインを描きます。その視覚的なシンプルさとトレンド変化を示唆する効果的な機能により、Follow Line はすべてのトレーダーの戦略にとって素晴らしい追加ツールです。 主な特徴: トレンド追跡: Follow Line は価格を厳密に追跡し、トレーダーが現在の市場トレンドを簡単に特定できるようにします。 視覚的なシンプルさ: 明確でよく定義されたラインにより、初心者のトレーダーでも市場の方向をすばやく理解することができます。 適応性: さまざまなタイムフレームやインストゥルメントで機能し、デイトレードからスイングトレードまで、さまざまなトレード戦略に最適です。 使用方法: インストール: 分析したい金融商品のチャートに Follow Line インジケーターを追加します。 設定: トレード戦略に合わせてインジケーターのパラメーターを調整します。 トレンド分析: Follow Line のラ
MetaTrader 5 無料スプレッドインジケーター このインジケーターは、MetaTrader 5でのスプレッドの詳細な分析を提供します。スプレッドは、トレーダーにとって重要なパラメーターの一つであり、資産の買い価格(Ask)と売り価格(Bid)の差を表しています。 インジケーターには以下が含まれます: 平均スプレッド :その日の観察された最大スプレッドと最小スプレッドの平均値として計算されます。 現在のスプレッド :現在の市場スプレッドを表示します。 最小スプレッド :その日に達成された最小スプレッド値を示します。 最大スプレッド :その日に達成された最大スプレッド値を示します。 このインジケーターは、市場状況を明確かつ即時に表示し、トレーダーが取引コストをより適切に評価し、戦略に影響を与える可能性のあるスプレッドの変動を特定するのに役立ちます。 私の製品に興味がある場合は、以下のページをご覧ください: エキスパートアドバイザー : https://www.mql5.com/it/market/product/119456?source=Site+Profile インジケーター
FREE
FREE Spread indicator for MetaTrader 4 this indicator includes: -average spread -current spread -minimum spread -maximum spread If you are interested in my products I recommend you visit my page where you can find: Experts Advisors:  https://www.mql5.com/it/market/product/119456?source=Site+Profile indicators:  https://www.mql5.com/it/market/product/120038?source=Site+Profile I hope the spread indicator will be useful to you. https://www.mql5.com/it/users/kappa05
FREE
Enhance Your Trading Strategies with the "Order Block" Indicator for MT4 Discover the "Order Block" Indicator: The "Order Block" Indicator for MT4 is designed to help you precisely identify order blocks in the market by marking the highs and lows of the order block candles. This powerful tool enables you to understand where large institutions place their orders, improving your ability to predict market movements. Key Features: Precise Order Block Detection: Automatically highlights the highs and
IMPORTANT: The indicator will remain at the price of $34.90 until the release of the update scheduled for July 16, 2024. The New Price will be $49.90 (taxes excluded) FVG indicator. If you are an SMC trader this indicator will be very useful to you, it automatically identifies the FVGs on the graph distinguishing them into 2 types: bearish FVGs and bullish FVGs (see the photos to understand better). This indicator works on any Timeframe and on any market you want to use it. If you are interested
Volume Profile Indicator for MT4 Gain a trading edge with the "Volume Profile" indicator for MetaTrader 4 (MT4). This advanced technical analysis tool allows you to precisely identify key support and resistance levels based on transaction volume. Easily visualize market areas of high interest, where trading volumes are highest, and use this information to make more informed trading decisions. Key Features: Clear and detailed visualization : The indicator displays volume histograms directly on th
Presentation of the "Color Range Indicator" The "Color Range Indicator" is a powerful technical analysis tool designed for the MT4 platform, perfect for traders who want a clear and immediate view of market trends. This indicator draws a colored line based on the current trend, making it easier to interpret price movements. Indicator Description: Green line : Indicates an uptrend. Use this signal to consider buying opportunities. Red line : Indicates a downtrend. Use this signal to consider sell
「リアルタイム・マルチインジケーター」とは何ですか? 「リアルタイム・マルチインジケーター」は、テクニカル分析を簡素化し、最適化するために設計された高度なトレーディングツールです。この革新的なインジケーターは、複数のタイムフレームやテクニカル指標からのシグナルを収集し、それらを単一の、わかりやすく読みやすいテーブルに表示します。チャートを頻繁に切り替えたり、各インジケーターを手動で分析したりすることなく、マーケットの全体像を把握したい方には、「リアルタイム・マルチインジケーター」が最適なソリューションです。 「リアルタイム・マルチインジケーター」を選ぶ理由は? マルチタイムフレーム分析: 「リアルタイム・マルチインジケーター」は、異なるタイムフレームで市場を同時に監視することができます。M15からH4まで、このインジケーターは各タイムフレームでトレンドが上昇か下降かを明確に示し、市場の全体像に基づいた情報に基づいた意思決定をサポートします。 複数の指標の統合: このツールは、パラボリックSAR、MACD、SMA、ADX、およびCCIなど、いくつかの重要なテクニカル指標のシグナルを組み合
9月1日(日)まで、77.90ドルから37.90ドルに割引 「Forex Scanner」とは何ですか? 「Forex Scanner」は、外国為替市場をリアルタイムで包括的に把握するために設計された強力な取引ツールです。この高度なインジケーターは、複数のテクニカルインジケーターや時間枠から重要なデータを収集し、取引の機会を迅速に特定できるようにします。複数の資産やパラメーターを監視しつつ、チャートを切り替えることなく取引したい場合、「Forex Scanner」は最適なソリューションです。 「Forex Scanner」を選ぶ理由 マルチタイムフレームスキャン: 「Forex Scanner」は、数分から数時間のさまざまな時間枠で市場を監視することができます。このツールは、複数の時間レベルでトレンドや取引シグナルを即座に識別するのに役立ち、完全で詳細な市場のビューに基づいて行動することを可能にします。 複数インジケーターの統合: このインジケーターは、ATR、RSI、ストキャスティクス、ADX、ピボット、MAなど、幅広いテクニカルツールを統合しており、各資産の市場状況を明確かつ正確に
Enhanced RSI: より深いテクニカル分析のためのハイブリッドインジケーター Enhanced RSIは、トレーダーにより包括的で正確な市場分析を提供するために設計された、多用途でカスタマイズ可能なテクニカルインジケーターです。移動平均、RSI、MACDの最良の特徴を組み合わせることで、このインジケーターはモメンタムとトレンドの強さの多次元的な視点を提供します。 主な特徴: 完璧なハイブリッド: Enhanced RSIは、移動平均、RSI、MACDの機能を融合させ、価格動向のより完全な把握を提供します。 最大の柔軟性: カスタマイズ可能な期間により、このインジケーターはどんなトレードスタイルや時間枠にも適応します。 汎用性: 外為市場から仮想通貨、株式、指数まで、あらゆる金融資産で機能します。 分析サポート: Enhanced RSIは自動取引システムではなく、あなたのテクニカル分析を強化するための有用なシグナルと確認を提供するツールです。 動作原理: Enhanced RSIは、RSIの指数移動平均を計算し、それをMACDからのシグナルと組み合わせます。その結果、買われ過ぎ
MetaTrader 5 用 Dynamic Cycle Indicator – サイクルトレーディングでの優位性! Dynamic Cycle Indicator は、市場サイクルを正確に識別し、 MetaTrader 5 上でのトレーディング戦略を最適化するための究極のツールです。高度なサイクル分析アルゴリズムに基づいて、このインディケーターは、転換点を検出し、将来の価格変動を予測する際に前例のない優位性を提供します。 Dynamic Cycle Indicator のユニークな点は? 完璧なサイクル識別 : 市場の揺れ動きの正確な分析により、このインディケーターは自動的にサイクルを検出し、グラフ上に明確なシンボルで転換点を強調します。これらのポイントは、最良のエントリーおよびエグジットタイミングを決定するために不可欠です。 即時にわかるビジュアルシグナル : グラフ上の赤と青の矢印が、明確にピークとボトムのシグナルを表示します。これらのビジュアルインディケーターにより、方向の変化を自信を持って予測でき、タイミングの精度が向上します。 シンプルな解釈 : グラフの下部にはサイクルオ
Order Block indicator, highs and lows; the indicator focuses mainly on OBs, on the chart they are represented with a horizontal line on the minimum and maximum of that candle. While for the maximums and minimums only one line is marked (see the images to understand better). The indicator is for MT5, it works on all Timeframes, on any Forex Pair, on any index and on crypto markets. (For any information on the indicator do not hesitate to contact me). Limited time discount (50%) 74.90$ -> 38.60$
Expert Advisor for scalping; This EA was built for monthly profitability. Works on any asset: Forex, Indices, Crypto and Stocks. Perfectly usable in MT5 tester and usable on any TimeFrame. The EA has various inputs available to customize operations: -Lots -Risk% (0 = Fix) -OrderDist (the distance between one order and another, the distance is calculated in points not pips) -TP (in points) -Sl (in points) -TrailingStopTrigger(the trailing stop trigger point in points) -TrailingStop(distance from
Highs, Lows and Bos Indicator for MT5; The indicator works on any type of market and on all TimeFrames. It also works on the MetaTrader5 Tester. the main function of the indicator is to identify the highs and lows by marking them with a point above/below the candle, then with a horizontal line it marks the Bos. It is very simple and intuitive, there are only 2 inputs: -the color of the maximums -the color of the minima For any other information do not hesitate to contact me.
Panel Info Trade For MT5; The indicator has 2 main objects: -An icon chart that you can change Timeframe, zoom, Forex Pair, crypto....the position of the graph can be modified via the (x;y) inputs. The chart is perfectly usable in the MT5 tester. If the graph isn't for you and doesn't help you with anything, you can press the button on the top right to make it smaller. -the second object is a dynamic control panel where you can change plots, place sl and tp, BE, close partial... (if you watch th
通貨強度指数 (Currency Strength Index - CSI) インジケーター インジケーターを有効化する前に、ペアを表示するために "TRUE" を設定することを忘れないでください 通貨強度指数 (Currency Strength Index - CSI) インジケーターは、主要な通貨の相対的な強さを測定するために使用される強力なツールです。このインジケーターは、トレーダーが特定の時点で最も強い通貨と最も弱い通貨を特定するのに役立ち、より情報に基づいた取引の意思決定を可能にします。 主な特徴: 比較分析: 過去および現在のデータに基づいて、異なる通貨の強さを比較します。 トレードシグナル: 相対的な強さに基づいて、取引に最適な通貨ペアを特定するのに役立ちます。 カスタマイズ: ユーザーは計算期間やその他のパラメータを設定し、自分の取引戦略に合わせることができます。 直感的なビジュアル表示: 情報を明確かつ視覚的に表示し、データの解釈を容易にします。 使用方法: インストール: 希望する通貨ペアのチャートにCSIインジケーターを追加します。 設定: 計算期間など、希望の
In the world of trading, the key to success lies in having the right tools at the right time. Our innovative Volume Profile indicator was developed with one goal in mind: to provide traders with unprecedented access to vital market activity information. This cutting-edge tool allows you to not only see where and when volumes are traded but also to understand market depth with clarity never seen before. Main Features: Temporal Flexibility: Set the analysis range up to 1800 minutes to perfectly ma
Maximize Your Trading Opportunities with the "Auto Trendlines" Indicator Discover the "Auto Trendlines" Indicator: "Auto Trendlines" is the essential tool for every technical trader. This indicator automatically plots trend lines, pinpointing support and resistance levels with surgical precision. It's ideal for those looking to capitalize on market breakouts and reversals. Key Features: Automatic Trendline Plotting: Identifies and draws crucial trend lines without manual intervention. Advanced C
Optimize Your Trading Decisions with the "autoFibo" Indicator Discover the "autoFibo" Indicator: "autoFibo" is the essential analysis tool for traders who want to fully leverage Fibonacci levels without the hassle of manual plotting. This indicator automates the Fibonacci retracement process, providing instant visual access to key support and resistance zones. Key Features: Automatic Fibonacci Retracement: Automatically plots Fibonacci levels, making it easy to identify support and resistance zo
Enhance Your Trading Performance with the "Better Volume" Indicator Discover the "Better Volume" Indicator: The "Better Volume" is the essential market volume analysis tool for traders aiming to stand out. It analyzes tick volumes with unprecedented accuracy, featuring an advanced moving average function (PERIOD_MA) and customizable buy and sell alerts. Key Features: Advanced Volume Analysis: Recognize volume peaks signaling crucial price movements. Intuitive Buy and Sell Alerts: Stay one step a
SuperTrend は、トレンドの方向を特定し、エントリーとエグジットのシグナルを生成するために、トレーディングで最も効果的かつ広く使用されているテクニカルインジケーターの1つです。ボラティリティとトレンドに基づいており、このインジケーターは市場の状況に動的に適応し、トレーダーに明確なビジュアル参照を提供します。 主な特徴: トレンド検出: SuperTrendは市場のトレンドに従い、下降トレンドでは価格の上に、上昇トレンドでは価格の下に線を描きます。 使いやすさ: 直感的なグラフィカル表現のおかげで、経験の浅いトレーダーでも簡単に解釈できます。 エントリー/エグジットシグナル: 価格がSuperTrendラインを上に切ると買いシグナルを生成し、下に切ると売りシグナルを生成します。 適応性: 異なるタイムフレームやツールで機能し、デイトレードからスイングトレードまで、さまざまなトレーディングスタイルに対応する汎用性を持っています。 使用方法: インストール: SuperTrendを、分析したい金融商品のチャートに追加します。 設定: 期間や乗数など、インジケーターのパラメータを設定し
新しい統合インジケーター - 3つの機能が1つに 市場分析と投資戦略を向上させるための取引ツールをお探しですか?私たちは、最も優れたインジケーター3つを1つの強力で便利なソリューションに組み合わせ、取引において最高の価値を提供します。 1. オーダーブロックインジケーター (以前は32.90$で販売) オーダーブロックインジケーターは、市場における重要な機関投資家の関心エリアを特定するための基本的なツールです。このインジケーターは、価格の反転やトレンドの継続が発生する可能性のあるキーゾーンを表すオーダーブロックキャンドルの高値と安値を示します。単独で使用する場合、オーダーブロックインジケーターは、潜在的なサポートとレジスタンスゾーンを特定し、取引の意思決定を向上させます。 リンク: https://www.mql5.com/it/market/product/121633?source=Site+Market+MT5+Search+Rating006%3aorderblock+indicator 2. FVGインジケーター (以前は34.90$で販売) FVGインジケーターは、公正価値
"Fair Value Gap" (FVG) インジケーター - 市場の不均衡の力を探る トレーディングの世界は隠れたチャンスに満ちていますが、それを効果的に見つけ出し活用できるのは、適切なツールを持っている人だけです。私たちの FVG インジケーター は、そのために設計されています。市場を読む能力を向上させ、最適なエントリーおよびエグジットポイントを見つけたいトレーダーにとって、FVG インジケーターは理想的な味方です。 Fair Value Gap (FVG) とは何ですか? Fair Value Gap の概念は、価格チャートに「ギャップ」を形成する供給と需要の間の不均衡を指します。このギャップは、価格がこの不均衡を埋めるために戻る可能性があるエリアを表し、これらのエリアは取引機会にとって潜在的に価値があるものです。これらのギャップは価格が急激に変動する際に発生し、将来の市場行動を理解するための鍵となり得ます。 なぜ FVG インジケーターが重要なのか? FVG インジケーターは、この不均衡のエリアをチャート上で簡単に特定し、価格がギャップを埋めるために戻る可能性のあるポイントを
"Schaff RSX" とは? "Schaff RSX" は、相対力指数(RSX)の有効性とSchaffサイクルの精度を組み合わせたユニークなインジケーターで、市場へのエントリーとエグジットの最適なタイミングを簡単に特定するのに役立ちます。まるで隠されたトレーディングチャンスを検出するレーダーを持っているかのように、他のトレーダーにはない競争力を提供します。 なぜ "Schaff RSX" を選ぶべきか? 明確で直感的な視覚的シンプルさ : "Schaff RSX" のカラーとラインは、市場が買われすぎや売られすぎの状態にあるときに、明確にそれを示してくれます。もはや直感や運に頼る必要はありません。正確で信頼性のある情報が目の前に表示されます。 完全なカスタマイズ : すべてのトレーダーには独自の戦略があり、"Schaff RSX" はそれに完全に適応します。パラメーターを自由に設定し、自分の求める結果を得ることができます。 あらゆるトレーディングスタイルに適応 : デイトレーダーであろうと、長期間のトレードを好む方であろうと、"Schaff RSX" は柔軟で、M1チャートから日足
MetaTrader 5用の**「Positions Manager」**は、ポジション管理を効率的かつ自動的に最適化したいトレーダーにとって、必須のツールです。この高度なツールは、トレーダーが操作を管理し、リスク管理を改善し、Break EvenやTrailing Stopなどの機能を利用して潜在的な利益を最大化できるように設計されています。 主な機能: 自動Break Even: Break Evenを有効にするオプションを使用すると、市場がトレーダーに有利に動いたときに利益を保護できます。アクティベーションに必要なピップ数を設定し、手数料をカバーするための追加のピップを追加できます。 動的なTrailing Stop: Trailing Stopを有効にして、市場の動きを追い、利益を保護します。この機能は価格の動きに自動的に適応し、市場が有利な間はポジションを維持し、トレンドが逆転したときに自動的にポジションを閉じます。 完全にカスタマイズ可能: Break EvenおよびTrailing Stopの設定は完全にカスタマイズ可能です。トレーダーは、アクティベーションに必要なピップ
Smart Fractals Indicator - あなたのMT5トレードのための強化フラクタル Smart Fractalsは、あなたがチャートで使用している従来のフラクタル指標の進化版です。MetaTrader 5用に特別に設計されたこの指標は、従来の市場反転ポイントを識別するだけでなく、それを超えて、あなたのトレードをより効率的で収益性の高いものにします。私たちはフラクタルの基本概念を取り、それをよりスマートで機能的なツールに変えました。 主な特徴: 売買シグナル:従来の市場転換点を示すフラクタルに加えて、Smart Fractalsには、グラフ上に黄色と紫の矢印で表示される、明確に定義された買いと売りのシグナルが含まれています。これにより、自信を持ってポジションに入ることができます。 改善されたビジュアル:各フラクタルは、カスタマイズ可能な色で「アップ」フラクタルと「ダウン」フラクタルを区別し、明確で直感的に表示されます。さらに、市場の構造的なブレイク (BOS) はリアルタイムで表示され、方向性の有効性を確認します。 色とスタイルのカスタマイズ:さまざまなシグナルに対して、
フィルタ:
レビューなし
レビューに返信