YouTubeにあるマーケットチュートリアルビデオをご覧ください
ロボットや指標を購入する
仮想ホスティングで
EAを実行
EAを実行
ロボットや指標を購入前にテストする
マーケットで収入を得る
販売のためにプロダクトをプレゼンテーションする方法
MetaTrader 5用取引ユーティリティ

取引 ごとのリスクの 計算、新規注文 の 簡単 な 設置、部分的 な 決済機能 を 持 つ 注文管理、 7 種類 のトレーリングストップなど 、便利 な 機能 を 備 えています 。
追加の資料と説明書
インストール手順 - アプリケーションの手順 - デモアカウント用アプリケーションの試用版
ライン機能 チャート上にオープニングライン、ストップロス、テイクプロフィットを表示します。この機能により、新規注文を簡単に設定することができ、注文を出す前にその特徴を確認することができます。 リスク計算 リスク計算機能は、設定されたリスクとストップロス注文のサイズを考慮して、新規注文のボリュームを計算します。ストップロスの大きさを自由に設定できると同時に、設定したリスクを守ることができます。 Lot calc ボタン - リスク 計算 を 有効 / 無効 にします 。 Risk フィールドでは 、必要 なリスクの 値 を 0 から 100 までのパーセンテージまたは 預金通貨 で 設定 します 。 設定」 タブで 、 リスク 計算 の 種類 を 選択 します :「 $ 通

Trade Manager EAへようこそ。これは、取引をより直感的、正確、そして効率的にするために設計された究極の リスク管理ツール です。これは単なるオーダー実行ツールではなく、包括的な取引計画、ポジション管理、リスク管理のためのソリューションです。初心者から上級者、迅速な実行を必要とするスキャルパーまで、Trade Manager EAはあらゆるニーズに対応し、為替、指数、商品、暗号通貨などさまざまな市場で柔軟に対応します。 Trade Manager EAを使用すると、複雑な計算が過去のものになります。市場を分析し、エントリーポイント、ストップロス、テイクプロフィットのレベルをチャート上のラインでマークし、リスクを設定するだけで、Trade Managerが最適なポジションサイズを即座に計算し、SLとTPをピップ、ポイント、口座通貨でリアルタイムに表示します。すべての取引が簡単かつ効果的に管理されます。 主な機能: ポジションサイズ計算機 :定義されたリスクに基づいて取引サイズを瞬時に決定します。 簡単な取引計画 :エントリー、ストップロス、テイクプロフィットを設定するためのド

Trade Panel は、多機能の取引アシスタントです。このアプリケーションには手動取引用の 50 を超える取引機能が含まれており、ほとんどの取引操作を自動化できます。 注意、アプリケーションはストラテジー テスターでは動作しません。購入する前に、デモアカウントでデモ版をテストできます。デモ版 ここ 。 完全な手順 こちら 。 取引。 ワンクリックで取引操作を実行できます: 自動リスク計算を使用して未決の注文とポジションをオープンします。 ワンクリックで複数の注文とポジションをオープンします。 注文グリッドを開きます。 未決の注文とポジションをグループごとにクローズします。 ポジション反転 (買いを閉じて売りを開く、または売りを閉じて買いを開く)。 ポジションをロックします(買いポジションと売りポジションの量を均等にする追加のポジションをオープンします)。 ワンクリックですべてのポジションを部分的にクローズします。 すべてのポジションのテイクプロフィットとストップロスを同じ価格レベルに設定します。 すべてのポジションのストップロスをポジションの損益分岐点レベルに設定します。 注文とポ

Local Trade Copier EA MT5 による、驚くほど高速な取引コピーを体験してください。1分で簡単にセットアップできるこの取引コピー機は、同じWindowsコンピュータまたはWindows VPS上の複数のMetaTrader端末間で取引をコピーすることができ、0.5秒未満の高速コピースピードを実現します。
初心者であろうとプロのトレーダーであろうと、 Local Trade Copier EA MT5 には、あなたの特定のニーズに合わせてカスタマイズするための幅広いオプションが用意されています。これは、利益の可能性を高めたい人にとって究極のソリューションです。 今すぐ試してみて、これが市場で最も速くて簡単なトレードコピー機である理由を理解してください。 ヒント: デモアカウントで Local Trade Copier EA MT5 デモバージョンをダウンロードして試すことができます: ここ ダウンロードした無料のデモ ファイルを MT5 >> ファイル >> データ フォルダを開く >> MQL5 >> Experts フォルダに貼り付けて、ターミナルを再起動しま

The product will copy all telegram signal to MT5 ( which you are member) , also it can work as remote copier. Easy to set up, copy order instant, can work with almost signal formats, image signal, s upport to translate other language to English Work with all type of channel or group, even channel have "Restrict Saving Content", work with multi channel, multi MT5 Work as remote copier: with signal have ticket number, it will copy exactly via ticket number. Support to backtest signal. How to s

Tired of complex order placement and manual calculations? Trade Dashboard is your solution. With its user-friendly interface, placing orders becomes effortless, by a single click, you can open trades, set stop loss and take profit levels, manage trade lot size, and calculate risk to reward ratios, allowing you to only focus on your strategy. Say goodbye to manual calculations and streamline your trading experience with Trade Dashboard. Download Demo Version right now. You can find Details of

「Grid Manual」は、注文のグリッドを操作するための取引パネルです。 ユーティリティはユニバーサルで、柔軟な設定と直感的なインターフェイスを備えています。 それは、損失を平均化する方向だけでなく、利益を増やす方向でも注文のグリッドで機能します。 トレーダーは注文のグリッドを作成して維持する必要はありません。 すべてが「Grid Manual」によって行われます。 注文を開くだけで十分であり、「Grid Manual」は注文のグリッドを自動的に作成し、非常に閉じるまでそれに付随します。 完全な説明とデモバージョン ここ。 ユーティリティの主な機能と機能 ユーティリティは、モバイル端末から開かれた注文を含め、あらゆる方法で開かれた注文を処理します。 「制限」と「停止」の2種類のグリッドで機能します。 グリッド間隔の計算には、固定と動的(ATRインジケーターに基づく)の2つの方法で機能します。 オープンオーダーグリッドの設定を変更できます。 チャート上の各注文グリッドの損益分岐点を表示します。 各注文グリッドの利益率を表示します。 ワンクリックでグリッドから収益性の高い注文を閉じるこ

MT5 to Telegram Signal Provider は、Telegramのチャット、チャンネル、またはグループに 指定された シグナルを送信することができる、完全にカスタマイズ可能な簡単なユーティリティです。これにより、あなたのアカウントは シグナルプロバイダー になります。 競合する製品とは異なり、DLLのインポートは使用していません。 [ デモ ] [ マニュアル ] [ MT4版 ] [ Discord版 ] [ Telegramチャンネル ]
セットアップ
ステップバイステップの ユーザーガイド が利用可能です。 Telegram APIの知識は必要ありません。必要な全ては開発者から提供されます。
主な特長 購読者に送信する注文の詳細をカスタマイズする機能 例えば、Bronze、Silver、Goldといった階層型のサブスクリプションモデルを作成できます。Goldサブスクリプションでは、すべてのシグナルが提供されます。
id、シンボル、またはコメントによって注文をフィルターできます
注文が実行されたチャートのスクリーンショットが含まれます 追加の確認のために
Trade Manager は、リスクを自動的に計算しながら、取引を迅速に開始および終了するのに役立ちます。 過剰取引、復讐取引、感情的な取引を防止する機能が含まれています。 取引は自動的に管理され、アカウントのパフォーマンス指標はグラフで視覚化できます。 これらの機能により、このパネルはすべてのマニュアル トレーダーにとって理想的なものとなり、MetaTrader 5 プラットフォームの強化に役立ちます。多言語サポート。 MT4バージョン | ユーザーガイド + デモ Trade Manager はストラテジー テスターでは機能しません。 デモについてはユーザーガイドをご覧ください。 危機管理 % または $ に基づくリスクの自動調整 固定ロットサイズを使用するか、ボリュームとピップに基づいた自動ロットサイズ計算を使用するオプション RR、Pips、または価格を使用した損益分岐点ストップロス設定トレーリングストップロス設定 目標に達したときにすべての取引を自動的に終了するための 1 日あたりの最大損失 (%)。 過度のドローダウンからアカウントを保護し、オーバートレードを防ぎます

Custom Alerts: 複数の市場を同時にモニターし、重要なチャンスを逃さない 概要
Custom Alerts は、複数の銘柄で発生する潜在的なセットアップを統合して追跡したいトレーダーに向けたダイナミックなソリューションです。FX Power、FX Volume、IX Power などの主力ツールから得られるデータを統合することで、 Custom Alerts は、複数のチャートを切り替えたり、絶好の機会を逃したりするリスクなしに、市場での重要な変化を自動的に通知します。よりスマートかつ効率的にトレードしたい方は、 Custom Alerts を活用してモニタリング能力を大幅に向上させましょう。
1. なぜ Custom Alerts がトレーダーにとって非常に有益なのか 全てを一括管理するマーケットモニタリング
• Custom Alerts は、主要8通貨、ゴールド、および最大7つの指数や商品など、さまざまな銘柄からのシグナルを集約・統合します。
• 多数のチャートを切り替える手間を省き、明確かつ一元化された通知を受け取ることが可能です。 戦略に合わせたカスタムア

あなたがメンバーである任意のチャネルから(プライベートおよび制限されたものを含む)シグナルを直接あなたのMT5にコピーします。 このツールは、トレードを管理し監視するために必要な多くの機能を提供しながら、ユーザーを考慮して設計されています。 この製品は使いやすく、視覚的に魅力的なグラフィカルインターフェースで提供されています。設定をカスタマイズして、数分で製品を使用を開始できます!
ユーザーガイド + デモ | MT4版 | Discord版 デモを試してみたい場合は、ユーザーガイドにアクセスしてください。 Telegram To MT5 受信機は、ストラテジーテスターで動作しません!
Telegram To MT5の特徴 複数のチャネルから一度にシグナルをコピー プライベートおよび制限されたチャネルからシグナルをコピー BotトークンまたはChat IDは必要ありません (必要に応じて使用することができます) リスク%または固定ロットを使用して取引 特定のシンボルを除外 すべてのシグナルをコピーするか、コピーするシグナルをカスタマイズするかを選択 すべてのシグナルを認

************************************************ *********************************************** GoldMine Train は、ゴールドのトレンド取引戦略 EA です。
オペレーターは主要なトレンドの方向を決定し、トレインに指示を出します。
トレインはその方向で継続的に売買します。ロット数は、アカウント残高と事前設定されたレバレッジ比率によって異なります。
オペレーターがトレンドの方向を変更すると、トレインは停止し、利益を固定します。
ユーザーはチャート上のボタンを使用してトレンドの方向を簡単に選択できます。 ************************************************ ***********************************************

Trade Copierは、取引口座間の取引をコピーして同期するように設計された専門的なユーティリティです。 コピーは、同じコンピューターまたはvps にインストールされている、サプライヤーのアカウント/端末から受信者のアカウント/端末に行われます。 購入する前に、デモ アカウントでデモ バージョンをテストできます。 デモ版 こちら 。 詳細な説明は こちら 。 主な機能と利点: MT5ネッティングアカウントを含む、MT5> MT5、MT4> MT5、MT5> MT4のコピーをサポートします。 高いコピー速度(0.5秒未満)。 ベンダーモードと受信者モードは同じ製品内に実装されています。 チャートから直接リアルタイムでコピーを制御できる、簡単で直感的なインターフェイス。 接続が切断されたり、端末が再起動されたりしても、設定と位置が失われることはありません。 コピーするシンボルを選択できます。また、受信者のシンボルを置き換えることもできます(例:EURUSD> USDJPY)。 バックコピーをサポートします。 特定の注文のみのコピーを有効にする機能。 取引開始価格の最大差と最大遅延時間を

MT5のトレードコピー機は、МetaТrader5プラットフォームのトレードコピー機です 。
それは間の 外国為替取引をコピーします 任意のは 、MT5 - MT5、MT4 - MT5 COPYLOT MT5版の アカウント (またはを MT4 - MT4 MT5 - MT4 COPYLOT MT4版用) 信頼できるコピー機! MT4のバージョン
完全な説明 +DEMO +PDF 購入する方法
インストールする方法
ログファイルの取得方法 テストと最適化の方法 Expforex のすべての製品 МТ4ターミナルでトレードをコピーすることもできます( МТ4 - МТ4、МТ5 - МТ4 ): MT4のCOPYLOT CLIENT このバージョンには、端末間 МТ5 - МТ5、МТ4 - МТ5が含まれ ます。 ディールコピー機は、2/3/10端末間でディール/ポジションをコピーするために作成されます。 デモ口座と投資口座からのコピーがサポートされています。 プログラムは、複数の端末バインデ

2025 happy new year -25% discount ($199 -> $149) Advanced trading tool: One click smart orders that execute under your conditions Developed by trader for trading community: position size calculator (lot size), open position after price action, strategy builder, set and forget trading, mobile notifications...
Risk Management - Risk percentage position size calculator, gain percentage, target risk reward ratio, spread and commissions are included in calculations 7 Advanced order types - Set a

-25% discount ($149 -> $111) Everything for chart Technical Analysis indicator mt5 in one tool Draw your supply demand zone with rectangle and support resistance with trendline and get alerts to mobile phone or email alert - Risk reward indicator mt5 Video tutorials, manuals, DEMO download here . Find contacts on my profile .
1. Extended rectangles and trendlines Object will be extended to the right edge of the chart when price will draw new candles on chart. This is rectangle extende

トレードポジションとバックテストツール:
「トレードポジションとバックテストツール」、またの名を「リスクリワード比ツール」としても知られるこの包括的かつ革新的な指標は、技術分析とトレード戦略を向上させるために設計されています。 リスクツールは、外国為替取引における効果的なリスク管理のための包括的で使いやすいソリューションです。エントリーポイント、ストップロス(SL)、テイクプロフィット(TP)など、取引ポジションのプレビューを含め、今後の取引の透明な表示を提供します。使いやすいパネルには、自動バランスとカスタムバランスのオプションが備わっており、自動ロットおよびリスク計算をサポートしています。市場での買い注文、売り注文、買いストップ、売りストップ注文など、さまざまな取引プレビューをサポートしています。このツールには、高度なリスクリワード比機能が含まれており、チャート上の任意の場所で高度にカスタマイズ可能な動きを提供し、購入および販売セットアップが完了します。トレード情報のスマートな表示には、開始用のロットサイズ、ストップロス、TP、注文タイプなど、重要な詳細が含まれます。また、SL
FREE

Cerberus the Equity Watcher はリスク管理ツールであり、アカウントの資産を常に監視し、不完全な EA や裁量的なトレーダーの場合は感情的な行動によって引き起こされる大きなドローダウンを回避します。これは、バグを含む可能性のある EA や、予想外の市況でうまく機能しない可能性のある EA に依存するシステマティック トレーダーにとって非常に役立ちます。 Cerberus では、最小エクイティ値と (オプションで) 最大値を設定できます。これらのいずれかに達すると、すべてのポジションがフラットになり、すべての未決注文がクローズされ、すべての EA が「強制終了」されます。すべての位置を平坦化すると、ユーザーの携帯電話に通知が送信され、画面に明確なメッセージが表示されます。 「平坦化」の後、Cerberus は株式価値を監視し続け、再初期化されるまでそれ以上の取引の試みを停止し続けます。 Cerberus によって実行されるすべての操作は、画面に明確に表示され、Expert advisor タブに報告され、通知がユーザーに送信されます。ユーザーのミスを避けるために、

ATTENTION the expert does not work in strategy tester, for a trial version visit my profile. Manual to download the automatic journal visit my profile RiskGuard Management – Professional trading, without compromise RiskGuard Management is the ultimate ally for traders who want to maximize profits and minimize losses with advanced risk management. It’s not just a tool; it’s an intelligent system that helps you stick to your trading plan, avoid emotional mistakes, and operate with maximum efficie
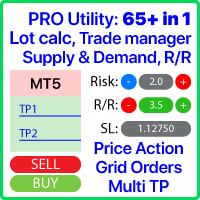
多機能ツール 搭載機能: ロット計算機、プライスアクション、リスク/リワードレシオ、トレードマネージャー、需要供給ゾーンなどをはじめ65以上の機能。 バージョ:デモ版 | ユーザーマニュアル | MT5版 このユーティリティはストラテジー テスターでは機能しません。 ここからデモ バージョンをダウンロードして製品をテストできます。
ご不明な点や改善提案、バグの発見などございましたら、 連絡してください 。 取引プロセスを簡素化、高速化、自動化します。このダッシュボードで標準端末機能を拡張します 1. 新しい取引を開始します : ロット / リスク / RR の計算 1. Lot計算機(リスクサイズに基づく取引量計算
2. リスク計算機(ロットサイズに基づくリスク量)
3. リスク/リワードレシオ (R/R)
4. 注文のアクティベーション トリガー + Buy StopLimit / Sell StopLimit
5. 仮想 SL / TP レベル (隠しSL、TP: ブローカーには見えない)
6. Smart SL / エントリー レベル: バーがそれを超

MT5 to Discord Signal Provider は、Discord へ直接トレーディングシグナルを送信するために設計された、使いやすく完全にカスタマイズ可能なユーティリティです。このツールは、あなたのトレーディングアカウントを効率的なシグナルプロバイダーに変えます。 スタイルに合わせてメッセージフォーマットをカスタマイズ!利便性を考え、事前にデザインされたテンプレートから選択し、メッセージのどの要素を含めるか除外するかを選択できます。 [ デモ ] [ マニュアル ] [ MT4 バージョン ] [ Telegram バージョン ]
セットアップ 簡単なセットアップのために、私たちの詳細な ユーザーガイド に従ってください。 Discord API の事前知識は必要ありません。必要なツールはすべて提供されます。
主な特徴 購読者の更新のための注文詳細をカスタマイズ。 ブロンズ、シルバー、ゴールドなど、各レベルで異なるシグナルアクセスを提供する階層的サブスクリプションモデルを実装。 注文が実行されたチャートのスクリーンショットを添付。 これらのスクリーンショットに表示さ

KT Equity Protector EA は口座の純資産を継続的に監視し、純資産が設定された損失許容額または利益目標に達すると、すべての市場注文および保留中の注文を閉じます。 すべての取引ポジションを閉じた後、EA はすべての開いているチャートを閉じ、他の EA による新規注文の発注を防ぐことができます。
純資産ストップロス
現在の口座残高が $5000 で、純資産ストップロスを $500 に設定した場合、KT Equity Protector は口座の純資産が $4500 以下に達するとすべての注文を閉じます。
純資産利益目標
現在の口座残高が $5000 で、純資産利益目標を $1000 に設定した場合、KT Equity Protector は口座の純資産が $6000 以上に達するとすべての注文を閉じます。
純資産計算モード
相対モード: 相対モードでは、損益は初期口座残高を基準に計算されます。たとえば、口座残高が $5000 で、純資産ストップロスと利益目標を $500 に設定した場合、EA は口座残高が $4500 または $5500 に達すると取引を停止します
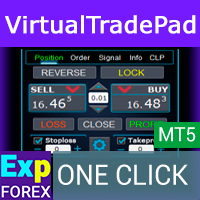
ワンクリックで取引できるトレーディングパネル。ポジションと注文の操作!チャートまたはキーボードから取引。
当社の取引パネルを使用すると、チャートから直接シングルクリックで取引を実行でき、標準の MetaTrader コントロールよりも 30 倍高速に取引操作を実行できます。 パラメータと関数の自動計算により、トレーダーにとって取引がより速く、より便利になります。 グラフィックのヒント、情報ラベル、取引取引に関する完全な情報はチャート MetaTrader にあります。 MT4のバージョン
完全な説明 +DEMO +PDF 購入する方法
インストールする方法
ログファイルの取得方法 テストと最適化の方法 Expforex のすべての製品 手動取引用の取引パネル。チャート(チャートウィンドウ)またはキーボードから取引できます。 開閉、リバース、ロックポジションと注文を処理する МetaТrader5 のメインオーダーのトレーディングコントロールパネル:売買、売却、売却、売却、売却、閉じる、削除、修正、トレーリングストップ、ストップロス、takeproft

Wouldn't it be great if AI had a second look at your trading data — graphics, indicators, and beyond? Introducing AI Trading Station , a revolutionary utility seamlessly integrated with the MetaTrader platform. Powered by the advanced intelligence of OpenAI's ChatGPT, this complete solution covers every step of your trading journey, from data gathering to trade execution.
The Complete Trading Process. Reinvented Data Gathering & Visualization: Collect and display vital market data on intuitive

This is an automatic parameter optimizer for the Trend Line PRO indicator Easily and quickly you will select the optimal parameters for your favorite Trend Line PRO indicator. Optimization takes only a few seconds. The optimizer allows you to find the best parameters for each pair and period: Amplitude, TP1-TP3, StopLoss, as well as values for Time Filter and HTF Filter on the selected history section (Days) To optimize different timeframes, you need a different range of history:
M5-M15 set

Trade Utility Pro is a bot utility designed to help you manage trades more easily, quickly, and accurately. This utility features a control panel interface and supports MetaTrader 5 exclusively. This utility does not link to any account information or external sources, ensuring safety. Main Features: Open Trade Support: Lot size calculation Fixed Lot: Custom input lot required Money Risk Lot: Automatically calculated based on stop loss and money risk Account % Risk Lot: Automatically calculated
FREE

Seconds Chart — MetaTrader 5で秒足チャートを作成するユニークなツールです。 Seconds Chart を使用すると、秒単位のタイムフレームでチャートを構築でき、標準的な分足や時間足チャートでは得られない柔軟性と分析精度を実現します。例えば、 S15 は15秒足を表します。あらゆるインジケーター、エキスパートアドバイザー、スクリプトを利用可能で、標準的なチャートと同様に便利に操作できます。 標準的なツールとは異なり、 Seconds Chart は超短期のタイムフレームでも高い精度と遅延なく作業できるように設計されています。 Seconds Chartの利点 1秒から900秒 までのタイムフレームをサポート。 組み込みのティックデータベースにより、ヒストリカルデータを 瞬時にロード 。 リアルタイムでデータが更新され、 遅延やラグなし 。 複数の秒足チャートを同時に作成可能。 Seconds Chartが最適な用途 スキャルピング や高頻度取引。 正確なエントリーとエグジット。 短期タイムフレームでの取引戦略のテスト。 タイムフレームの設定 デフォルトの設定
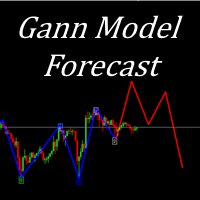
I present to your attention a powerful utility for predicting the future movement of an asset based on W.D. Ganna’s law of vibration. This utility analyzes the selected market model and provides codes for future possible market movement patterns. If you enter the selected code into the appropriate box, you will receive a forecast of the potential market movement. The utility has the ability to display several potential forecast models. The forecast is not yet tied to time and price and gives th

Auto Trade Copier is designed to copy trades to multiple MT4, MT5 and cTrader accounts/terminals with 100% accuracy. The provider and receiver accounts must be on the same PC/VPS. With this tool, you can copy trades to receiver accounts on the same PC/VPS. All trading actions will be copied from provider to receiver perfectly. This version can be used on MT5 accounts only. For MT4 accounts, you must use Auto Trade Copier (for MT4). Reference: - For MT4 receiver, please download Trade Receiver Fr

この製品は、ニュースタイム中にすべてのエキスパートアドバイザーと手動チャートをフィルタリングするため、急激な価格変動によるマニュアルトレードのセットアップの破壊や他のエキスパートアドバイザーによって入力された取引について心配する必要はありません。この製品には、ニュースのリリース前にオープンポジションとペンディングオーダーを処理できる完全な注文管理システムも付属しています。 The News Filter を購入すると、将来のエキスパートアドバイザーのためにビルトインのニュースフィルターに頼る必要はなく、今後はすべてのエキスパートアドバイザーをここからフィルタリングできます。
ニュース選択
ニュースソースは、Forex Factoryの経済カレンダーから取得されます。 USD、EUR、GBP、JPY、AUD、CAD、CHF、NZD、CNYなど、任意の通貨数に基づいて選択できます。 Non-Farm(NFP)、FOMC、CPIなどのキーワード識別に基づいて選択することもできます。 影響レベルによってフィルタリングするニュースを選択することができ、低、中、高の影響範囲から選択できます。

OrderManager をご紹介:MT5用の革新的なユーティリティ 新しく設計されたOrder Managerユーティリティを使用して、MetaTrader 5での取引をプロフェッショナルなものにしましょう。シンプルさと使いやすさに焦点を当てたこのユーティリティは、各取引に関連するリスクを簡単に定義し、視覚化できます。これにより、情報に基づいた意思決定が可能になり、取引戦略を最適化できます。OrderManagerに関する詳細は、マニュアルをご参照ください。 [ マニュアル ] [ MT4 バージョン ] [ Telegram チャンネル ]
主な特長: リスク管理:取引のリスクを素早く簡単に定義し、より良い意思決定を行い、取引パフォーマンスを向上させます。 視覚表現:オープンなポジションとそれに関連するリスクをグラフィカルに表示し、明瞭かつ簡潔な理解が可能です。 注文変更:数回のクリックで注文を簡単に変更またはクローズし、取引プロセスを効率化し、貴重な時間を節約します。 手のひらの上の最新ニュース:ボタン一つで最新の市場ニュースに常にアクセスできます。
MT5トレーダーにとって

素晴らしい信号を見つけましたが、プロバイダーの敷地が小さすぎますか?より大きなポジションボリュームが必要ですが、ターミナルの設定が悪すぎますか? Signal Lot Manager は、必要な量の重複注文によってプロバイダーのポジション量を増やします。 ロットサイズと注文をコピーするシグナルの名前を設定するだけです。 Signal Lot Manager は、端末上で注文を複製するためのロット乗数ユーティリティです。ソースは、任意のアドバイザー、手動取引、個別の取引シグナルを選択できます。簡単なセットアップで幅広い機能を備え、高速性と信頼性も備えています。 Sign Lot Manager インストールおよび入力ガイド EA に関する通知を受け取りたい場合は、URL を MT4/MT5 ターミナルに追加してください (スクリーンショットを参照)。 MT4のバージョン https://www.mql5.com/en/market/product/34864 MT5のバージョン https://www.mql5.com/en/market/product/41610
一

Community, update news, feature discussions, complaints, suggestions, and first-line support are organized in a free Discord server .
Use Webmoney to pay in crypto. Lazy Trader is your personal risk management assistant that independently finds the best market entries, manages positions, and helps you extract maximum profit from every trading idea!
It monitors charts from M1 to W1 , finds optimal entry points based on your parameters, and manages trades without your involvement:
- Got a

コピー機->便利で高速なインターフェースインタラクション、ユーザーはすぐに使用できます ->>>> WindowsコンピュータまたはVPS Windowsでの使用を推奨 特徴: 多様でパーソナライズされたコピー取引設定:1. 異なるシグナルソースに異なるロットモードを設定できます。2. フォワードコピー取引とリバースコピー取引に異なるシグナルソースを設定できます。3. シグナルはコメントで設定できます。4. 契約ロットに応じてロットを調整するかどうか 多様でパーソナライズされたコピー注文設定2:1.品種ごとに異なるロットモードを設定できます2.順方向コピー注文と逆方向コピー注文に異なる品種を設定できます3.コメントでシグナルを設定できます4.契約ロットに応じてロットを調整するかどうか
コメントフィルタリング、MAGICフィルタリング、シグナルロットフィルタリング、ローカル製品フィルタリング 勤務時間設定 逆同期SLAVE終了 注文バインド機能: 任意の注文を設定されたシグナルソース注文にバインドできます (テーブルをダブルクリックして編集します) アカウントリスク管理 基本

The ultimate control panel for your trading! With the One Click Trading tool, you will be able to trade with the keyboard and just 1 click, with the CTRL and SHIFT buttons! Some of the features: Determine Stop Loss and Take Profit Levels. Button to close all trades Button to close all trades and pending orders Buy and Sell at limit price Buy and Sell at ask price Order positioning with CTRL (Sell) and SHIFT Buy
FREE

MT5のエキスパートアドバイザーリスクマネージャーは非常に重要であり、私の意見ではすべてのトレーダーにとって必要なプログラムです。
このエキスパートアドバイザーを使用すると、取引口座のリスクを管理することができます。リスクと利益の管理は、金銭的およびパーセンテージの両方で実行できます。
エキスパートアドバイザーが機能するには、それを通貨ペアチャートに添付し、許容可能なリスク値を預金通貨または現在の残高の%で設定するだけです。 PROMO BUY 1 GET 2 FREE - https://www.mql5.com/en/blogs/post/754725
アドバイザ機能
このリスクマネージャーは、リスクの管理を支援します。
-取引のために -1日あたり - 1週間 - ひと月ほど
制御することもできます
1)取引時の最大許容ロット 2)1日あたりの最大注文数 3)1日あたりの最大利益 4)エクイティを引き受ける利益を設定する
それだけではありません。設定で自動設定を指定した場合、アドバイザーはデフォルトのSLとTPを設定することもできます。
アドバイザーは各イ
The Expert Advisor is a risk manager helping users to control their trading. In the settings, it is possible to specify the parameters at which the risk manager force closes the opened trades and closes the terminal as well, if it is needed to prevent opening trades on emotions, which do not correspond to the trading strategy.
Risk Manager settings Check limit to close - check the equity limit Limit to close - minimum account equity triggering loss prevention measures Check day limit to cl
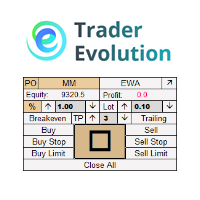
" Trader Evolution " - A utility designed for traders who use wave and technical analysis in their work. One tab of the utility is capable of money management and opening orders, and the other can help in making Elliott wave and technical analysis.
Manual (Be sure to read before purchasing) | Version for MT4
Advantages
1. Trading in a few clicks. Immediate and pending orders are available in the panel
2. Money management. The program automatically selects the appropriate lot size
3. Simplifies

EA DIDI アラート - ATM システム検針器
金融市場で最高の取引機会を活用するのに役立つツールをお探しですか? 次に、ATM SystemsのDIDI Alert - Agulhadas Detectorは、DIDI INDEXを通じてDidi Aguiarの強力なNeedles Setup取引戦略を使用する市場で唯一のアドバイザーであり、この戦略の他の専任アドバイザーとは異なり、利用可能なさまざまなリソースを備えていることを知っておく必要があります。非常に完成度が高く、機能的で実用的です。ボリンジャーバンドのニーズ、トレンド、空き状況を特定し、「完全なニーズ」が検出されると、プッシュ通知や電子メールを介してアラートを発します。また、ボリンジャーバンドの結果を迅速かつ簡単に表示するための直感的なグラフィカルダッシュボードも提供します。分析。 DIDI Alert は最先端の人工知能を使用して開発され、コードのすべての行が最適化および洗練され、最大限のパフォーマンスと精度を保証します。さらに、DIDI Alert は、世界最大かつ最も信頼できる取引コミュニティである MQL
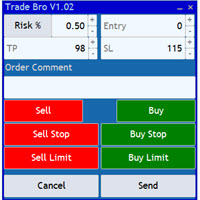
The Trade Bro tool helps you to calculate your positions size and place orders quickly. You no longer need to count ticks or do time consuming calculations. The easy to understand graphical panel is designed to interact with the chart of your symbol perfectly. Please leave a 5 star rating if you like this free tool! Thank you so much :)
List of Inputs: <Graphic> InpFontSize: FontSize of the text of the trading panel. InpShowLinesRight: When set to true the entry, TP and SL lines will be oriente
FREE

Equity Protect Pro: 安心取引のための総合的な口座保護エキスパート 口座保護、資産保護、ポートフォリオ保護、マルチ戦略保護、利益保護、利益確定、取引セキュリティ、リスク管理プログラム、自動リスク管理、自動決済、条件付き決済、スケジュール決済、動的決済、トレーリングストップロス、ワンクリッククローズ、ワンクリック決済、ワンクリック復元などの機能をお探しなら、Equity Protect Pro が最適なプログラムです。 設定は簡単で、事前設定された条件に達すると、すべてのチャートを閉じることができ、シグナルサブスクリプションのキャンセルもサポートします(これは、すべての取引プログラムも停止することを意味します)。この時点で、新しい注文は生成されなくなり、最終的にすべての注文が閉じられ、予期せぬ損失を効果的に防止し、安心して取引できるようになります。 Equity Protect Pro には 11 の主要な機能があり、すべてが独立して動作します。取引戦略に応じて、適切な機能の組み合わせを選択して使用できます。これらの機能はデフォルトでオフになっており、使用しない場合は

ニュースイベントの洞察でトレードを強化
トレードの世界では、ニュースイベントが市場価格に大きな影響を与えることがあります。これらのイベントが価格変動にどのように影響するかを理解することは、ボラティリティの高い時期にトレードを管理するために重要です。News Tool EA は、過去および今後のニュースイベントに関する洞察を提供し、情報に基づいたトレードの意思決定を支援します。 このEAは、ストラテジーテスターでは実行できません。 ユーザーガイド 主な機能:
歴史的影響分析 過去の特定のニュースイベントに対して価格変動がどのように反応したかを理解します。イベントがしばしば強気または弱気のトレンドに従うかを分析し、調整可能な時間枠でポイントまたはパーセンテージの平均価格影響を表示します。ビジュアルグラフを使用して、ニュースイベントと価格反応を並べて観察し、より深い市場の洞察を得ることができます。 リアルタイムニュースの統合 MT5内で直接、今後のニュースイベントのライブアップデートを受け取ります。特定のイベントや重要度レベルに対するアラートを設定し、通貨や関連性でイベントをフィルタリン

Drawdown Limiter EA You are in the right place if you were searching for Drawdown control, Drawdown limiter, Balance protection, Equity Protection or Daily Drawdown Limit related to Prop Firm, FTMO, or Funded account trading, or if you want to protect your trading account. Have you suffered from controlling your drawdown when trading funded accounts? This EA is meant for you. Prop firms usually set a rule called “Trader Daily Drawdown”, and if it is not respected, you are disqualified. I am an

バスケットEAMT5 は、最高の利益ハーベスターであり、究極のアカウントプロテクターであり、すべてが1つの非常に使いやすいソリューションです。 バスケットEAΜΤ5 の背後にある考え方は、すべてのオープンポジションを合わせて、バスケットレベルでトレーディングアカウント全体の利益および/または損失を制御できるようにすることです。 これは、すべての管理されたポジションについて、口座残高のパーセンテージまたは口座通貨(金銭)で、バスケットテイクプロフィット、ストップロス、損益分岐点、およびトレーリングストップロス設定を提供します。 マジックナンバーやシンボルに応じて、特定の取引の管理または管理からの除外を可能にします。 また、アカウント保護設定を備えており、アカウントが利益を得るかストップロスのエクイティに達したときに、すべてのオープントレードを閉じ、すべての保留中の注文を削除し、すべてのチャートを閉じ、それらに添付されている他のEAを削除します。
ヒント:Basket EA MT5 デモバージョンをダウンロードして、デモアカウントで試すことができます: こちら ダウンロードした無料

Smart Copy is an Easy-to-Use EA that supports Multi Copying Metatrader4 and Metatrader5 and Local/Remote Copying. (Remote Version is coming soon)
Free version is available on Smart Copy Local Free MT5
Specifications :
Real Time, Multi Terminal - Multi Account - MT4/MT5 trade copying Copy from netting to hedge and hedge to netting is supported.
Fast and instant copy
All settings are input visually. Easy modifying symbol names, prefix, suffix Enable/Disable copying
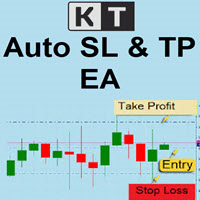
KT Auto SL TP は、手動で発注された注文を検出すると、自動的にストップロスとテイクプロフィットを設定します。市場注文、指値注文、逆指値注文に対して同時にストップロスとテイクプロフィットを簡単に設定できます。
機能
1つのチャートからすべてのアクティブな通貨ペアにストップロスとテイクプロフィットを設定可能。 ステップ付きのトレーリングストップ機能を搭載。 市場注文および未決注文(指値・逆指値注文)にも対応。 チャート上に情報テキストを表示。
入力パラメータ 現在の通貨ペア: 現在の通貨ペア/チャートにのみストップロスとテイクプロフィットを設定。 すべての通貨ペア: すべての通貨ペアにストップロスとテイクプロフィットを設定。 市場注文: 市場注文のみストップロスとテイクプロフィットを設定。 未決注文: 未決注文(指値・逆指値注文)のみにストップロスとテイクプロフィットを設定。 両方: 市場注文と未決注文の両方にストップロスとテイクプロフィットを設定。 ストップロスポイント (0: 無効) テイクプロフィットポイント (0: 無効) トレーリングストップポ
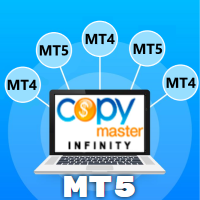
このユーティリティを使用すると、マスター設定のある端末からスレーブ設定の他の端末に任意の取引をコピーすることができます
同時に、コピーするペアを選択し、いくつかのパラメータでコピーされた順序のサイズを設定することができます。 ドローダウンでリミット損失を設定するか、収益性の高い取引のみをコピーします
あなたはMT4またはMT5からMT4またはMT5他のブローカーに取引をコピーすることができます
これで、MT4で動作するExpert Advisorの信号をMT5ターミナルまたはバックにコピーすることは困難ではありません
コピーマスターを使用して、他のシグナル、Ea、手動取引から任意の取引をコピーします。
設定を使用すると、ロットサイズ、取引方向を変更し、利益取引のみをコピーし、setdbvalueを使用して預金を保存することができます
コピーマスターは、一つのアカウント上の異なるサブスクリプションシグナルのいくつかの戦略を統合することができます
MT4で取引をコピーするには、コピーマスター MT4バージョンが必要です: -ここで
コピーマスター設定の詳細については:

50% Off Today Only! Price Goes Back Up at 11 PM (EST)
Marketkeys Trade Manager EA for MT5: Your Pathway to Forex Trading Mastery
What Traders Are Saying: "Much better than lots of other trade managers I've tested..." – R Vdr "Saves me time from manually calculating lots sizes and risks...amazing support." – Richard Obi Efficiency and precision are paramount in Forex trading. Marketkeys Trade Manager EA for MT5 offers just that - a seamless interface combined with robust risk management tools.

UTM Manager は、迅速かつ効率的な取引執行を提供する直感的で使いやすいツールです。際立った機能の 1 つは、「スプレッドを無視」モードです。これにより、スプレッドを完全に無視して、ローソク足の価格で取引できるようになります (たとえば、LTF でより高いスプレッドのペアを取引でき、スプレッドによって取引から除外されるのを回避できます)。 UTM Manager のもう 1 つの重要な側面は、独自のローカル取引コピー機であり、各ブローカーで異なる取引戦略と設定 (たとえば、さまざまな TP、BE、およびリスク ルール) を柔軟に実行できます。
取引執行: 迅速かつ効率的な取引執行: チャート上のエントリー価格とストップロス価格をクリックして簡単に取引を入力するか、ワンクリックの固定ストップロスサイズ機能を使用します。 自動ロットサイズ計算: ロットは事前定義されたリスク設定に基づいて計算され、ドラッグによってポジションが変更されると再計算されます。 1 つまたは複数のポジションを同時に処理できる能力。 利益確定と損益分岐点: 柔軟なテイクプロフィット設定: 特定のリスク対報酬

Patrex Pro: Maximize Your Trading Potential Patrex Pro is an advanced trading bot designed to help traders optimize their trading strategies and maximize their potential returns. With its cutting-edge technology and user-friendly interface, Patrex Pro is the ultimate tool for traders seeking to elevate their trading game.
Key Features: 1. Position Hedging: Patrex Pro allows users to hedge their positions based on their individual risk tolerance and market analysis. 2. Advanced Risk Management:

AIP – MT4/MT5 To Telegram 1 Main features of MT4/MT5 EA To Telegram: Send all types of orders (Open Order/Close Order/Modify Order/Pending Order/Delete Order) Close and Modify Order with replies to the corresponding Open Order Support sending to both private and public channels Support sending to multiple channels simultaneously Send Chart Screenshots Manage all symbols with a single EA on one terminal Automatic loading of templates, logos, and screenshots Support sending Icon Emojis Emb
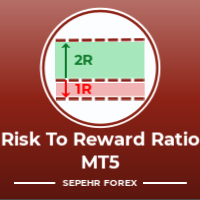
こんにちは皆さん
トレーダー向けのもう一つの無料ツール。
リスクと報酬の比率:
すべてのトレーダーにとって、良い取引かどうかを判断するために、利益の大きさに対する損失の大きさを計算するのは便利です。 また、損失と利益がピップとパーセンテージで表示されます。
各パーツの色を好みに設定できます。 あなたもこのパネルとトレードしてみませんか? 以下のリンクを参照してください Trader Assistant Mini MT5
MT4のバージョンは以下のリンクから確認できます。
Risk to Reward Ratio MT4
このツールのよりプロフェッショナルなバージョンについては、私の新製品をご覧ください。
Pro Risk Management Panel MT5
楽しんでいただければ幸いです ;)
やっと:
あなたの考えやフィードバックを共有することを強くお勧めします。
トレーダーが要求すると思われる情報を提供することが重要です。
著者:
私は MQL 言語プログラマーで、3 年間さまざまなプロジェクトを行ってきました。
私は電気エンジニアで、難しい問題
FREE

The added video will showcase all functionality, effectiveness, and uses of the trade manager. Drag and Drop Trade Manager. Draw your entry and have the tool calculate the rest. Advanced targeting and close portions of a trade directly available in tool (manage trades while you sleep). Market order or limit order on either side with factored spread. Just draw the entry, the tool does the rest. Hotkey setup to make it simple. Draw where you want to enter, and the stop loss, the tool calculates al

Telegram to MT5: The Ultimate Signal Copying Solution Simplify your trading with Telegram to MT5 , the modern tool that copies trading signals directly from Telegram channels and chats to your MetaTrader 5 platform, without the need for DLLs. This powerful solution ensures precise signal execution, extensive customization options, saves time, and boosts your efficiency. [Instructions ] [ DEMO ] Key Features Direct Telegram API Integration Authenticate via phone number and secure code. Easily man
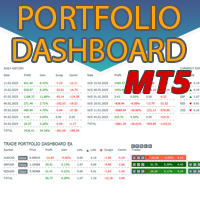
日ごとおよび週ごとのクローズ取引履歴、現在のオープン取引、および外国為替エクスポージャーを 1 つのチャートで即座に確認できます。ヒートマップを使用して、収益性の高い取引と、取引ポートフォリオ内の現在のドローダウンの位置を特定します。
クイック クローズ ボタン クイック クローズ ボタンを使用すると、1 つのシンボルのすべての取引をクローズしたり、個々の取引を完全にクローズしたり、ボタンをクリックするだけで部分的な利益または損失を取得したりできます。リストで取引を探したり、取引の一部をクローズする方法を考えたりする必要はもうありません。ダッシュボードには、外国為替ペアの取引中に各通貨シンボルの現在のエクスポージャーも表示されるため、主要なニュース イベントの前にエクスポージャーが過剰になっている可能性のある領域を特定するのに役立ちます。ボタンを使用して、ニュースの前にエクスポージャーを即座にすばやく減らすことができます。または、ニュースがすでに発生して利益が出ている場合は、1 回のクリックでその利益をすばやく銀行に預けることができます。
オープン取引ヒートマップ 取引ヒートマッ
The product will copy all Discord signal to MT5 ( which you are member ) , also it can work as remote copier. Easy to set up. Work with almost signal formats, support to translate other language to English Work with multi channel, multi MT5. Work with Image signal. Copy order instant, auto detect symbol. Work as remote copier: with signal have ticket number, it will copy exactly via ticket number.
How to setup and guide: Let read all details about setup and download Discord To MetaTrader
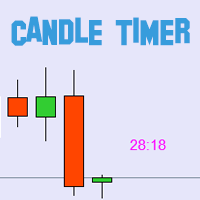
BLZキャンドルタイマー:トレーディングの未来を解き放つ Our Telegram Channel : https://t.me/Nas100scalpingEA2
BLZ Candle Timerは、現在のバーが終了し、新しいバーが出現するまでの残り時間を表示する高度なバータイマー・カウントダウンで、最先端のトレーディングの世界に足を踏み入れましょう。
このインジケーターは、チャート上の最後のバーの残り時間を表示し、市場のリズムを先取りします。新しいバーの到着をタイムリーに通知することで、あなたの取引戦略にダイナミックなエッジを加えます。
汎用性が鍵です: - M1タイムフレーム*の速いペースから*MNタイムフレーム*の広大なビューまで、あらゆるタイムフレームでシームレスに動作します。 - カスタマイズ可能なパラメーターで取引体験を調整し、お好みに応じて*色*、*文字サイズ*、*可視性*で遊ぶことができます。
*これは単なるツールではなく、スキャルパーや日中トレーダーのニーズに応える、すべての取引スタイル*のための多目的なコンパニオンです。電光石火の高速計
FREE

シームレスな注文エントリーと自動化されたロットサイズ計算のために設計されたポジションサイジングエキスパートアドバイザーで、プロップファームのあらゆる課題をうまく乗り切りましょう。後で私たちに感謝することになるでしょう!
最新のフル機能をご利用いただくには、メルカリ ポジションサイジング PRO にアップグレードしてください!このEAは取引ストラテジーではないため、ストラテジーテスターでは動作しません!
主な機能 機関投資家レベルのリスク配分: すべての取引で残高のわずか1%しかリスクを取らないことで、取引の運命をコントロールしましょう。 自動ポジションサイジング: 推測やピップ値の手動計算はもう必要ありません。Expert Advisorがあなたの代わりに計算を行い、より迅速で正確な反応を保証します。 簡単な取引執行: プロのように成行注文を執行します。損切り(SL)と利益確定(TP)を設定し、買いまたは売りをクリックするだけです。とても簡単です! 高度な保留注文: 正確な注文を発注できます。エントリー価格、SL、TPを指定し、戦略を簡単に実行できます。 ブレイク
FREE

The most advanced news filter on MQL market - free demo available Take a Break has transformed from a basic news filter into a comprehensive account protection solution. It seamlessly pauses any other Expert Advisors during news events or based on your custom filters, all while safeguarding your EA settings - restoring them automatically when trading resumes for complete peace of mind. Typical use cases: A single news filter for all your EAs. Stop trading during news/high volatility (+ close all

概要 Stats Dashboardを使用して、トレーディングパフォーマンスを追跡、分析、および向上させましょう。日次、週次、月次、カスタム期間など、さまざまな期間にわたる主要な統計を表示します。インタラクティブなラインチャートを使用して、最もパフォーマンスの良い、または悪い取引商品を簡単に特定できます。 EAはストラテジーテスターでは動作しません。無料トライアルをご希望の方はご連絡ください。 表示される統計: 利益 - 利益率(%)および総純利益($) 取引 - 総取引数および勝率 統計 - 利益ファクターおよび回復ファクター 勝率 % ドローダウン - エクイティドローダウン %およびバランスドローダウン % ブローカーフィー - 総手数料および総スワップフィー 総取引ロット数および平均取引期間 初期バランスおよび現在のバランス 主な機能 詳細な利益とパフォーマンスのメトリクス リアルタイムデータ分析 日次サマリーレポート 月次カレンダービュー 特定のアルゴリズムでフィルタリング(マジックナンバー) リアルタイムデータ分析 リアルタイムのトレーディングデータにアクセス : 最新の市

ADAM EA Special Version for FTMO Please use ShowInfo= false for backtesting ! Our 1st EA created using ChatGPT technology
Trade only GOOD and checked PROP FIRMS Default parameters for Challenge $100,000 Tested on EURUSD and GBPUSD only Use 15MIN Time Frame Close all deals and Auto-trading before Weekend at 12:00 GMT+3 Friday For Prop Firms MUST use special Protector https://www.mql5.com/en/market/product/94362 --------------------------------------------------------------------------------

自動設定、ストップロス、テイクプロフィット、トレーリングストップ、損益分岐点レベルにより、 仮想 ストップロスとテイクプロフィットが可能になります。
Exp Assistant は、 ポジションの維持を計画するのに役立ちます。 このプログラムである Expert Advisor は、 リアルまたはバーチャルを 自動的に設定するように設計されています。 取引中のポジションの ストップロスとテイクプロフィット のレベル。 Expert Advisor のすべての操作は、チャート上のコントロール パネルから簡単に管理できます。 オープンポジションの ストップロス、テイクプロフィット、 トレーリングストップ 、 損益 分岐点 の設定が難しい場合 、または手動で取引したい場合は、アシスタントを使用できます。 取引のストップロスとテイクプロフィットの設定、トレーリングストップのオン、必要に応じてストップロスを損益分岐点に移動するなど、必要なアクションが自動的に実行されます。 アシスタントには、 パラボリック Sar インジケーターに基づくトレーリング ストップ機能も備えています。 MT4
FREE

Attention: You can view the program operation in the free version YuClusters DEMO . YuClusters is a professional market analysis system. The trader has unique opportunities to analyze the flow of orders, trade volumes, price movements using various charts, profiles, indicators, and graphical objects. YuClusters operates on data based on Time&Sales or ticks information, depending on what is available in the quotes of a financial instrument. YuClusters allows you to build graphs by combining da

TP & SL Calculator Indicator for MT5
The Take Profit & Stop Loss Calculator Indicator serves as a valuable risk and capital management tool for determining and setting take profit (TP) and stop loss (SL) levels . These levels can be easily drawn directly on the chart using the indicator. This tool enhances capital management by providing a separate box that includes the following features: The ability to create and manage take profit and stop loss levels for both Buy and Sell positions; Dete
FREE

The Easy Strategy Builder (ESB) is a " Do It Yourself " solution that allows you to create a wide range of the automated trading strategies without any line of codes. This is the world’s easiest method to automate your strategies that can be used in STP, ECN and FIFO brokers. No drag and drop is needed. Just by set conditions of your trading strategy and change settings on desired values and let it work in your account. ESB has hundreds of modules to define unlimited possibilities of strategi

特定のストップロス レベルに基づいてポジション サイズやリスクを即座に計算できるツールは、プロのトレーダーにとっても初心者のトレーダーにとっても重要です。TRADE PRO トレーディング ユーティリティは、迅速かつ正確な計算を提供し、時間に敏感で変動の激しい市場での意思決定に役立ちます。 追加の設置資材
アプリケーションマニュアル – 試用版をダウンロード MT4 - MT5 MT5バージョン 主な機能: オリジナル。シンプル。効果的。 メイン取引パネルの独創的で便利な開き方: マウスをチャートの右側に移動し、適切な方向をクリックして先物注文を配置します。 マーケット注文の迅速なインストール TRADE PRO でリスクに充てる残高または資本の割合を設定するか、リスクに充てる特定の金額を指定します。チャート上でストップロス レベルを視覚的に定義すると、ツールが各通貨ペアの最適なポジション サイズを自動的に計算します。ツールは、指定されたリスク/報酬比率に基づいて、利益目標 (テイク プロフィット) を自動的に設定することもできます。 複数の

This simple visual expert advisor allows you to trade easily from the chart. It handles risk management for you and can perform several useful tasks with your existing trades, saving time and making risk-management for each individual trade easier. [ Installation Guide | Update Guide | Troubleshooting | FAQ | All Products ] Trade easily from the chart Trade with precise risk management, hassle free Trade pending order with drag and drop price selection Set SL and TP levels with drag and drop pr

すべてのトレーダーは、1 回の取引で 5% (または 7%) を超えるリスクを負ってはならないことを知っています。これはマネー管理の法則であり、トレーダーは異なる取引レベルに対して異なるストップロス値を使用する必要があるため、使用可能な LotSize を毎回計算する必要があります。このインディケータは、チャートに配置する瞬間に適切な LotSize を計算し、「ストップ ロス ライン」を任意の方向にドラッグするたびに計算します。
期間限定オファー: すべてのプレミアム インジケーターはわずか 50$ で利用できます。MQL5 ブログにアクセスすると、プレミアム インジケーターのすべての詳細を確認できます。ここをクリック。
入力 MAX_RISK_PER_TRADE - トレーダーがトレードごとにリスクを負うパーセンテージ。 CUSTOM_BALANCE - リスクの計算に使用される金額を定義します。 0 => 電卓は口座残高を使用します。 ENTRY_PRICE_LINE_COLOR - TP (テイクプロフィット) ラインの色 STOP_PRICE_LINE_COLOR-
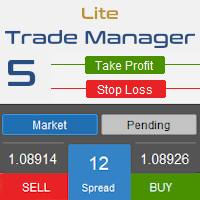
Trade Manager 5 Lite is trading panel developed with a goal to make manual trading in some (routine) task easier.
Version for Meta Trader 4 is here: Trade Manager 4 Lite . (MT4 version also works in Strategy Tester)
Main features of Trade Manager 5 Lite Trading for Forex and CFDs Support for 4 and 5 digit brokers 65 combinations to set order Set Take Profit, Stop Loss and entry level for Pending Order with lines positioned on the chart Break Even Trailing Stop Loss Multiple Orders at one c

Botトークンや管理者権限の必要なしに、メンバーであるすべてのチャンネルからシグナルをコピーして、MT5に直接送信します。 多くの機能を提供しながら、ユーザーを考慮して設計されています この製品は、使いやすい視覚的に魅力的なグラフィカルインターフェースで提供されています。設定をカスタマイズして、数分で製品を使用開始できます!
ユーザーガイド + デモ | MT4バージョン | Telegramバージョン デモを試してみたい場合は、ユーザーガイドを参照してください。 DiscordからMT5への変換は、ストラテジーテスターで動作しません。
DiscordからMT5への変換の特長 メンバーである任意のチャンネルからコピーします。BotトークンやチャットIDは不要です リスク%または固定ロットを使用して取引 特定のシンボルを除外 すべてのシグナルをコピーするか、コピーするシグナルをカスタマイズします すべてのシグナルを認識するための単語やフレーズを設定します(デフォルトは99%のシグナルプロバイダーに適用されます) コピーするタイミングと日時の設定をカスタマイズします 一度に開くト
MetaTraderマーケットはMetaTraderプラットフォームのためのアプリを購入するための便利で安全な場所を提供します。エキスパートアドバイザーとインディケータをストラテジーテスターの中でテストするためにターミナルから無料のデモバージョンをダウンロードしてください。
パフォーマンスをモニターするためにいろいろなモードでアプリをテストし、MQL5.community支払いシステムを使ってお望みのプロダクトの支払いをしてください。
取引の機会を逃しています。
- 無料取引アプリ
- 8千を超えるシグナルをコピー
- 金融ニュースで金融マーケットを探索
新規登録
ログイン