Symbol Chart Changer Pro
** NOTE: This indicator uses realtime data. Thus DO NOT download Demo version. If you still need demo version, please refer to free version.
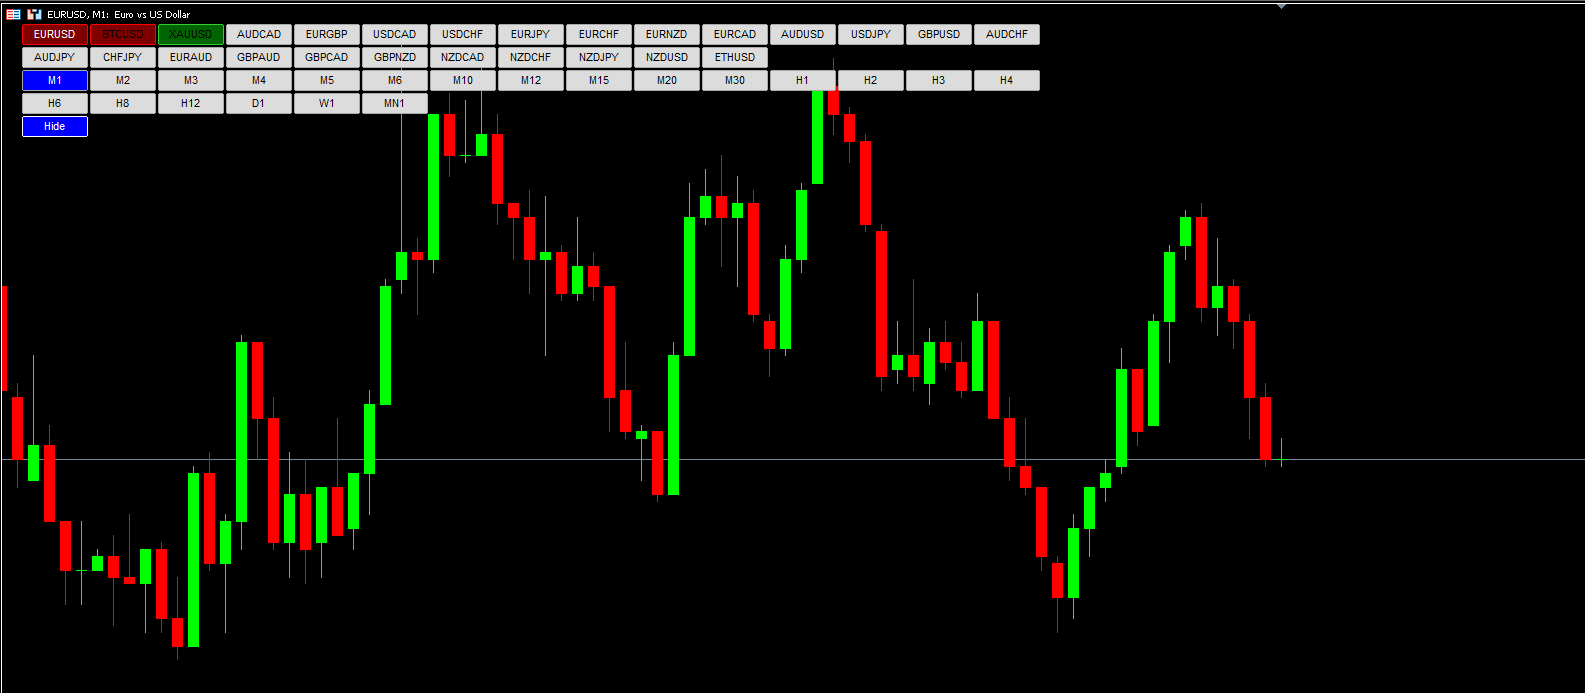
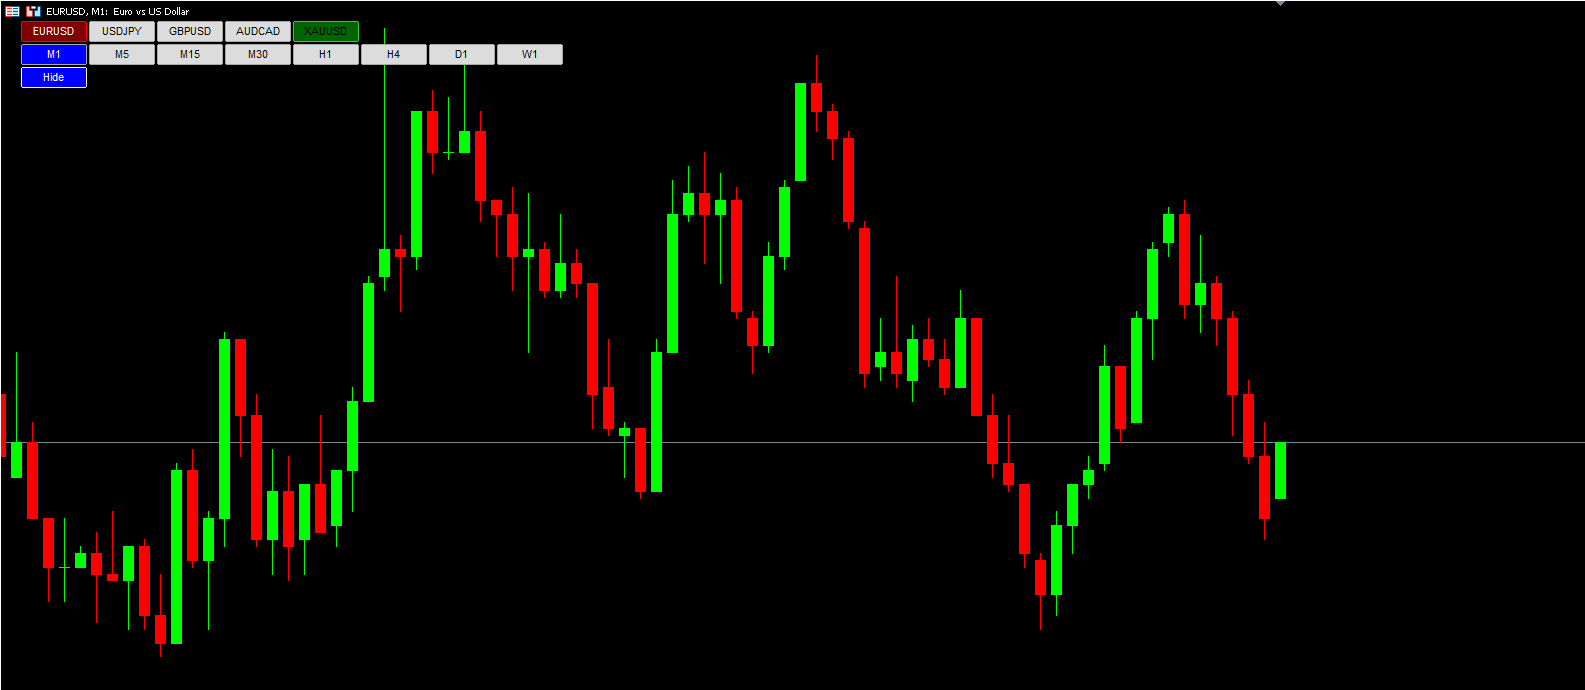
Symbol Chart Changer is an indicator/utility that offers you the option to switch between symbols and timeframes.
You can choose any symbol and timeframe on the same chart with just a few clicks. In addition, this indicator also shows the profit of the symbol through the color of the buttons.
Features:
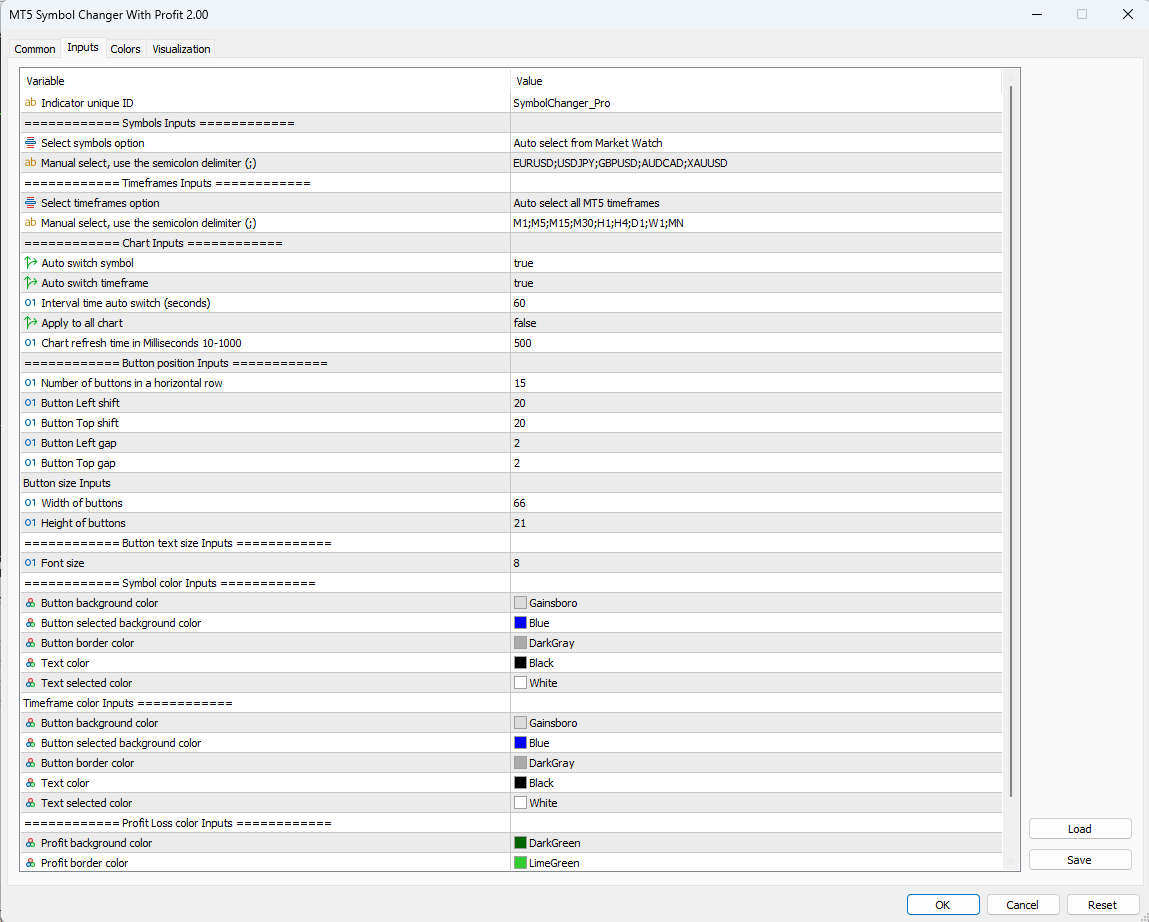
Click buttons on the chart to monitor all your favorite instruments. All symbols can be selected in MarketWatch or input manually. You can select all MT4 timeframe or some of them from Inputs window.
Indicator also provides an option to auto switch among symbols/timeframes.
Show profit of opening orders of symbol through the color of the buttons.
This indicator also allows you modify buttons' size, color, etc...
Works smoothly on any symbol/instrument, account type or broker.
Contact me for support: https://www.mql5.com/en/users/thucpn
Check my other products: https://www.mql5.com/en/users/thucpn/seller
If you have any ideas for this indicator or other products, please leave a comment or contact me.
If you are happy with this indicator, please rate 5 stars and leave positive comment. I would greatly appreciate your positive review.
I would really like to give 5 stars, however for my trading style. It would be more viable to have the option to leave it below the charts, as a default indicator. Having to change assets and click Show and Hide every time is not good.