Tick Value
- インディケータ
- Prince Prah Kofi Botchway
- バージョン: 2.0
- アップデート済み: 7 10月 2024
- アクティベーション: 5
John 14:6 Jesus saith unto him, I am the way, the truth, and the life: no man cometh unto the Father, but by me.
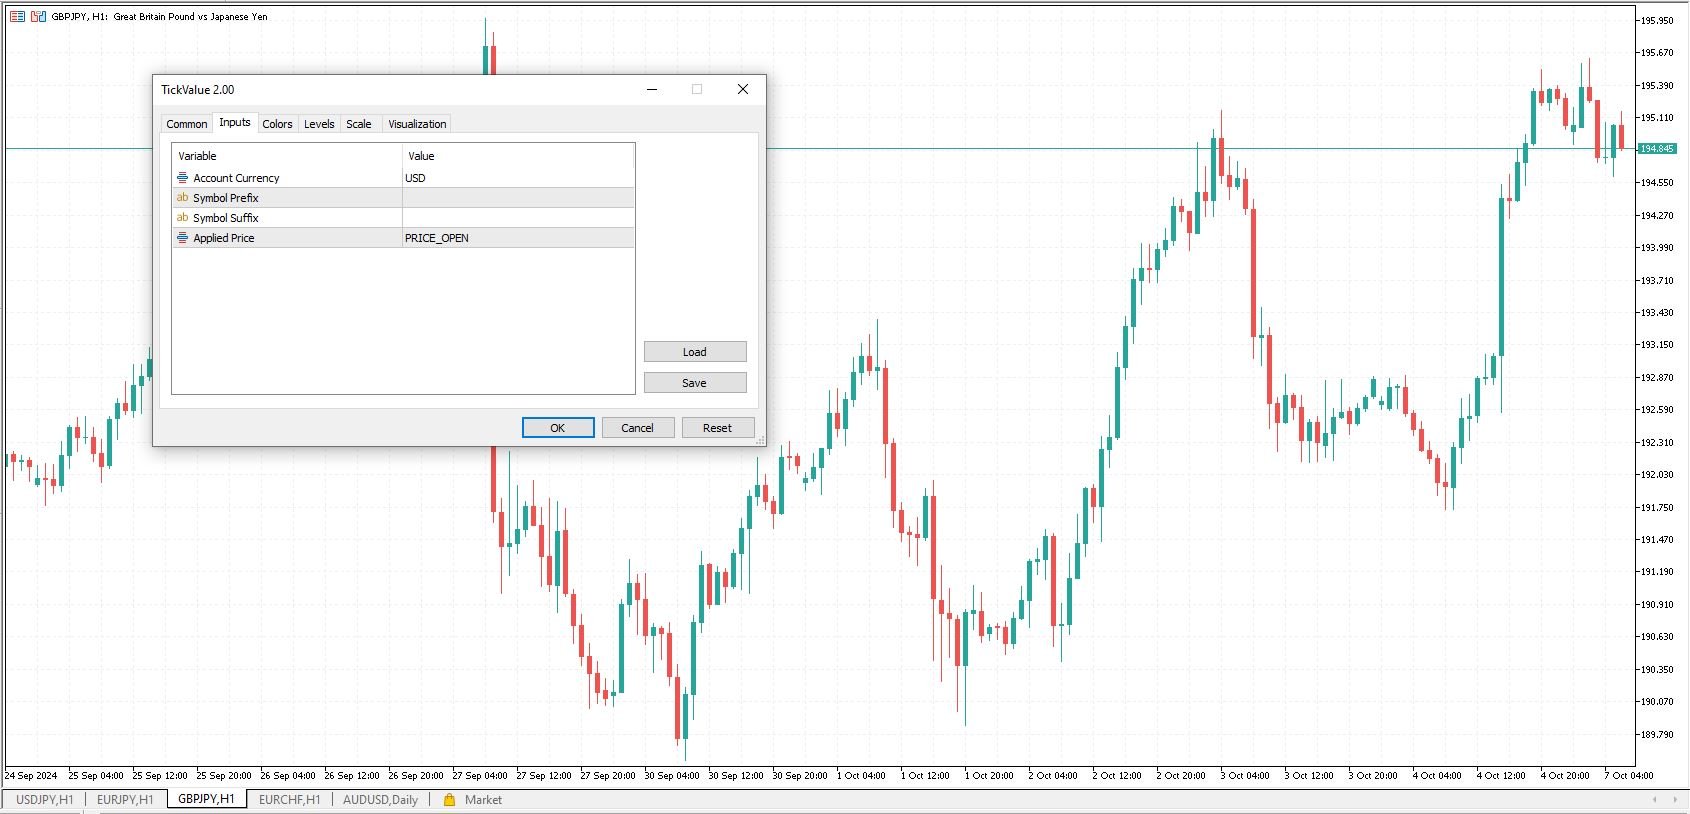
TICK VALUE : Multi-Currency Account Indicator
Description:
The TICK VALUE : Multi-Currency Account Indicator is a powerful and versatile tool designed for traders looking to streamline their portfolio management across multiple currency pairs. With its robust functionality, this indicator not only provides comprehensive historical profit calculations but also allows for a seamless evaluation of trading strategies without the need for a tester. By offering real-time tick value views in all major currencies, the indicator delivers a clear understanding of market performance, enabling traders to make well-informed decisions at a glance.
Key Features:
1. Historical Profit Calculation: Instantly access detailed historical profits across multiple currency pairs, allowing for an in-depth review of past performance.2. Tester-Free Automated Model Evaluation: This feature saves time by automatically assessing strategies without needing a manual tester, offering greater convenience for continuous strategy optimization.3. Historical Tick Value View: Gain insights into historical tick values to understand market dynamics and improve trade execution.
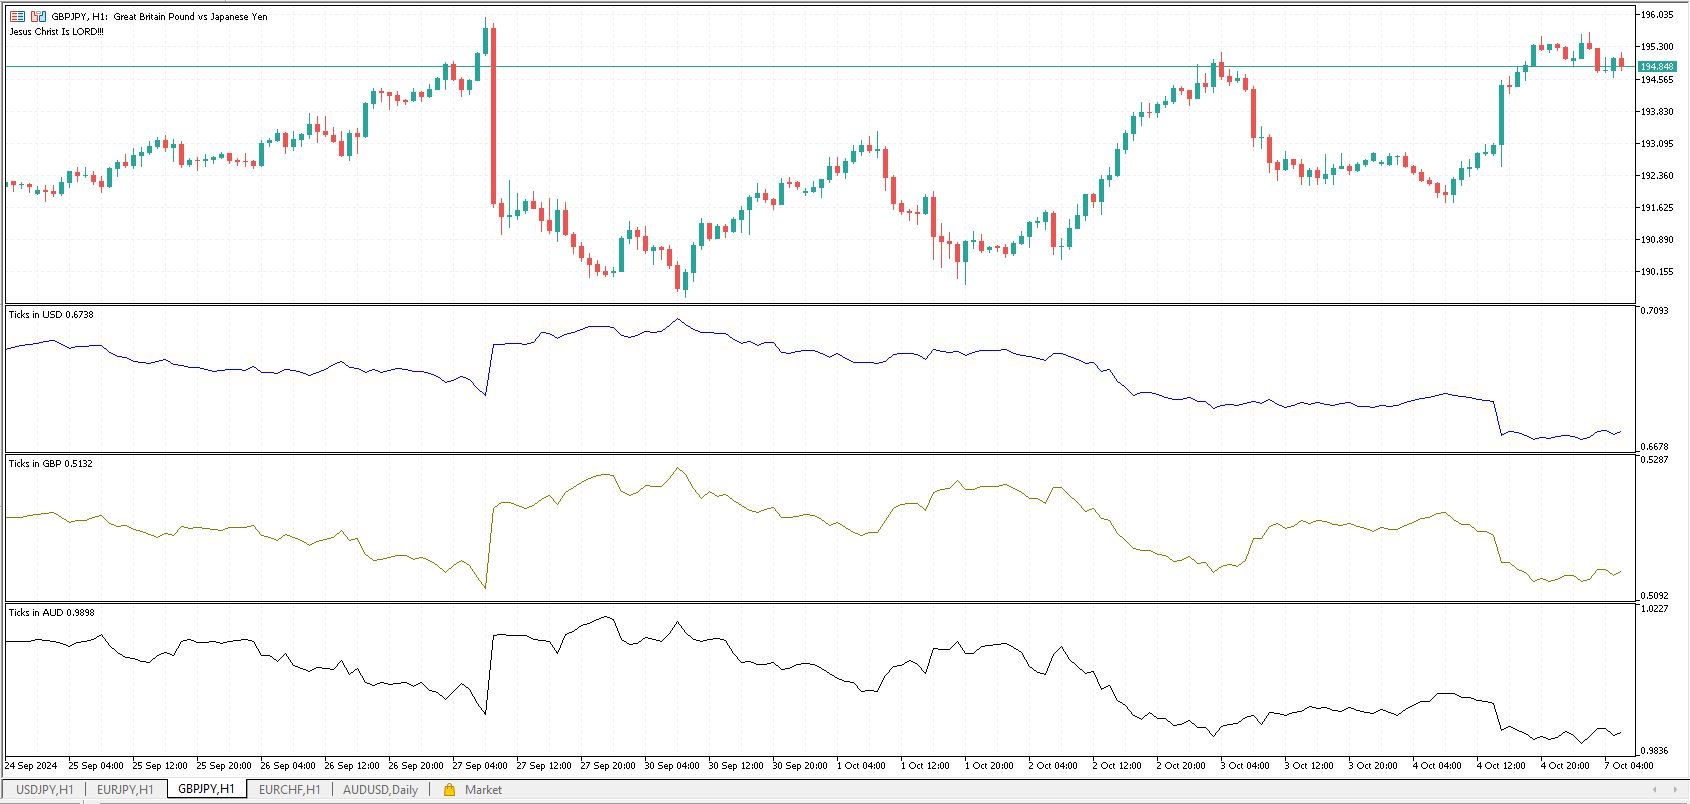
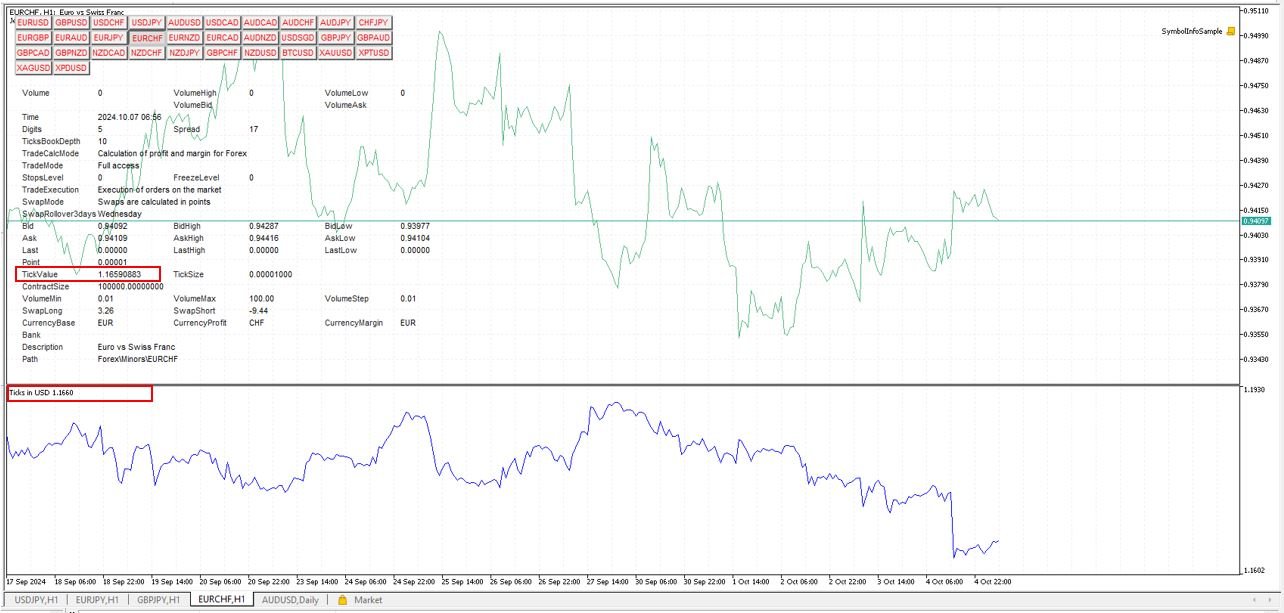
4. Real-Time Tick Value in Major Currencies: Stay updated on the current tick values for all major currencies, helping you monitor and adjust positions with precision.
Why Choose This Indicator?
The Multi-Currency Account Indicator is ideal for traders managing multiple currency pairs, providing a comprehensive, real-time overview of profits, tick values, and trading model evaluations. By removing the need for external testers and offering historical data analysis, this tool is a must-have for anyone aiming to enhance their trading efficiency and decision-making.
Ps.127:1 Except the Lord build the house, they labour in vain that build it: except the Lord keep the city, the watchman waketh but in vain.