CBT Quantum Maverick
- インディケータ
- Arpit Sharma
- バージョン: 1.1
- アップデート済み: 20 9月 2024
- アクティベーション: 5
CBT Quantum Maverick
高効率バイナリ利益獲得システム
CBT Quantum Maverick は、精度、シンプルさ、確実な利益を求めるトレーダー向けに設計された、細かく調整された高性能バイナリ オプション取引システムです。カスタマイズは不要で、このシステムはすぐに最高の結果が出るように最適化されています。
主な機能:
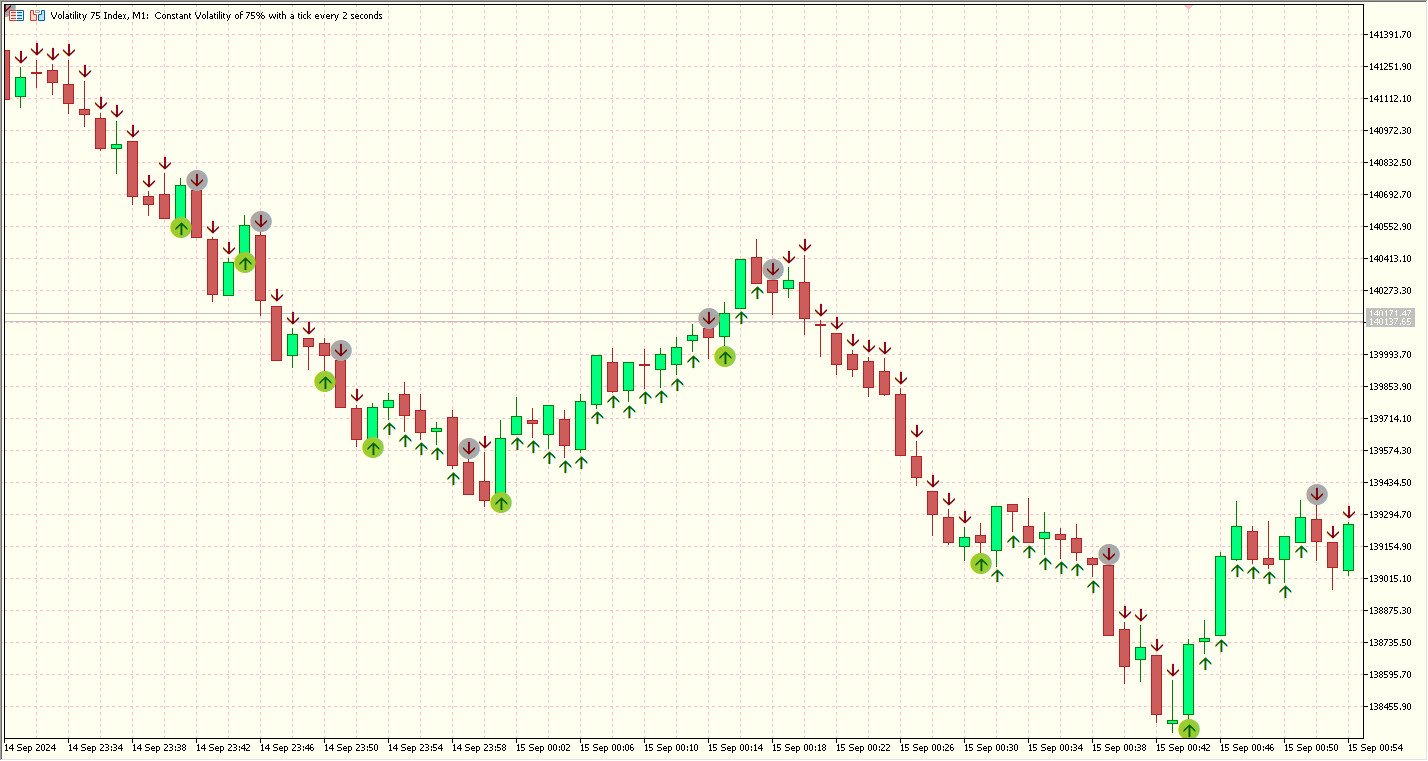
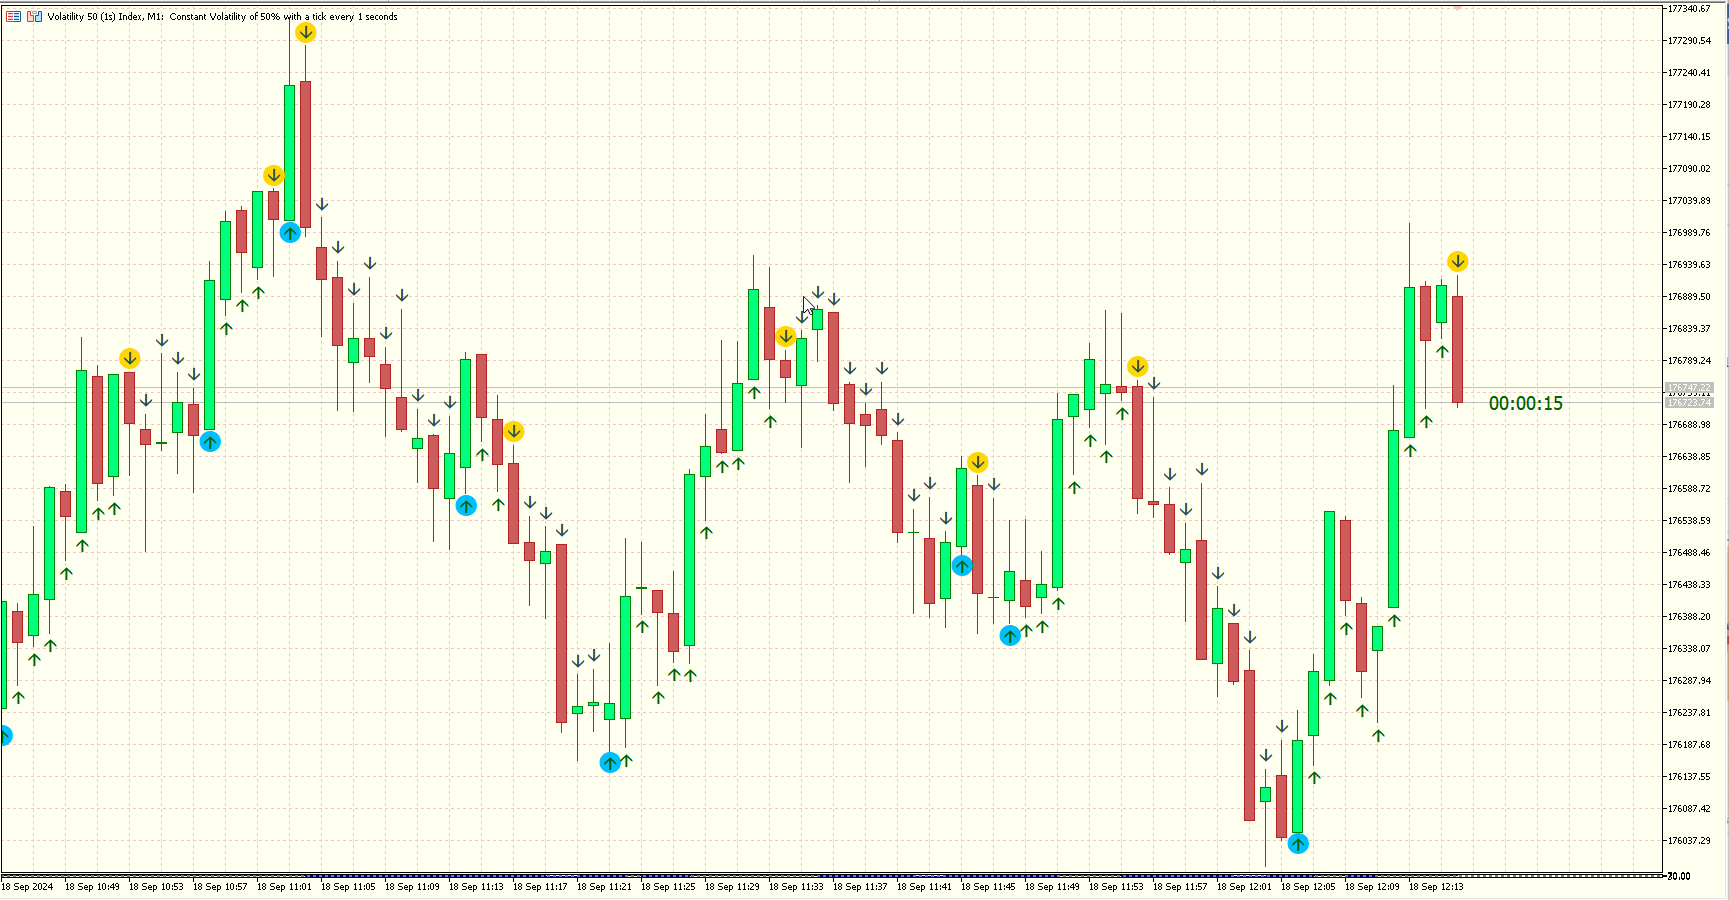
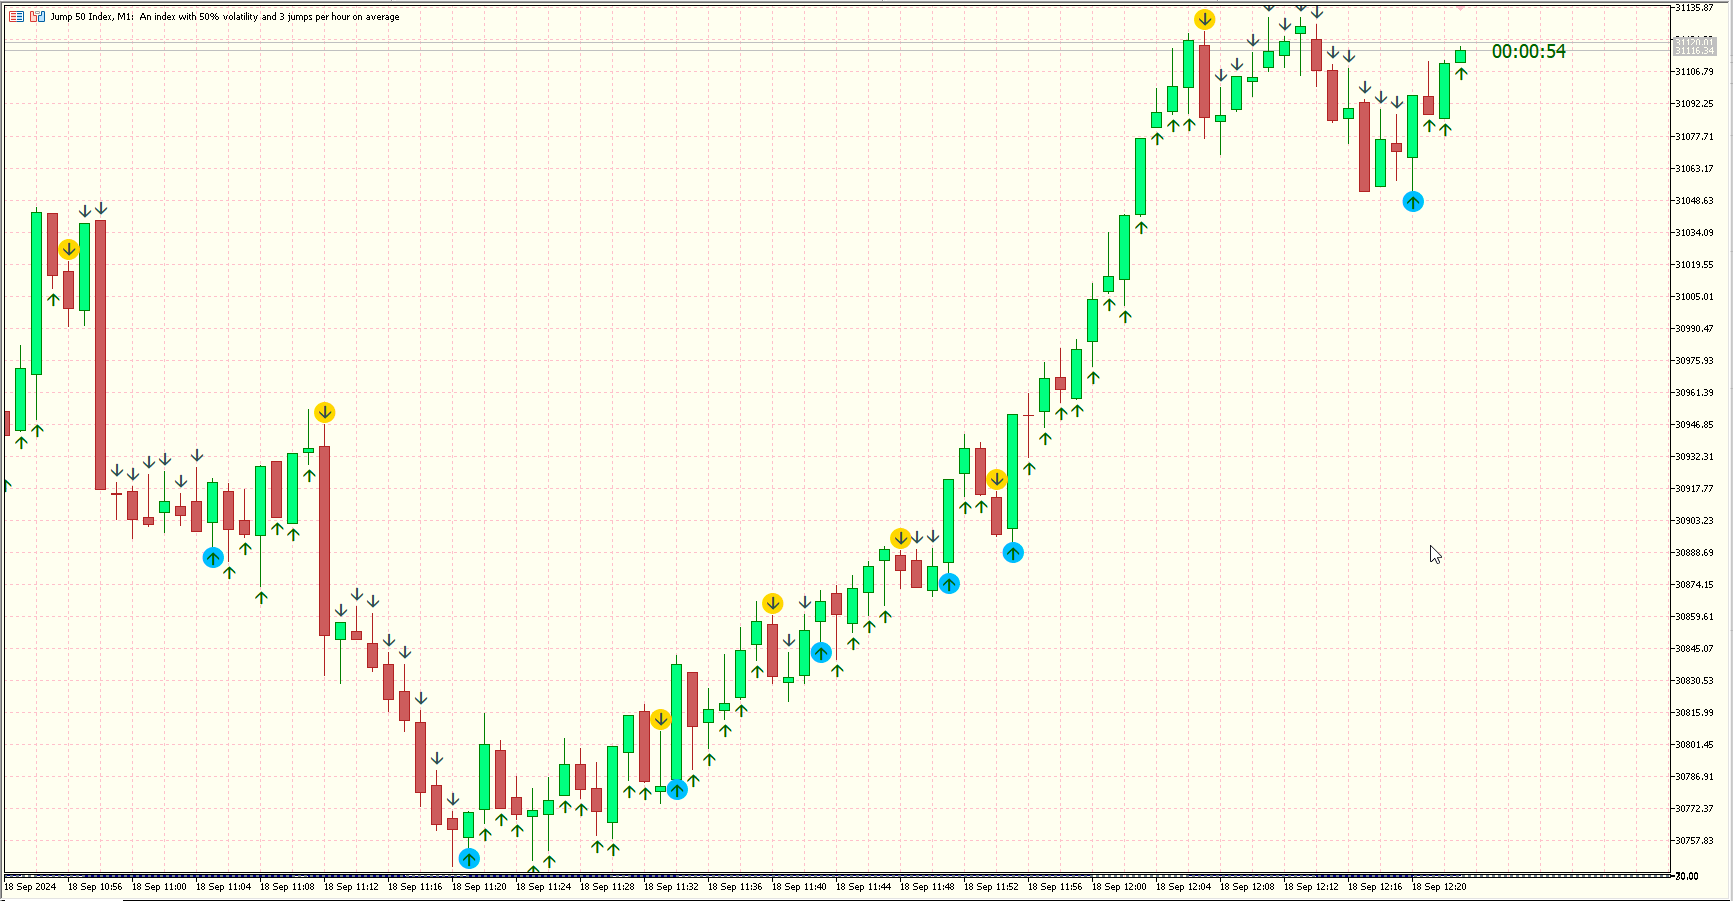
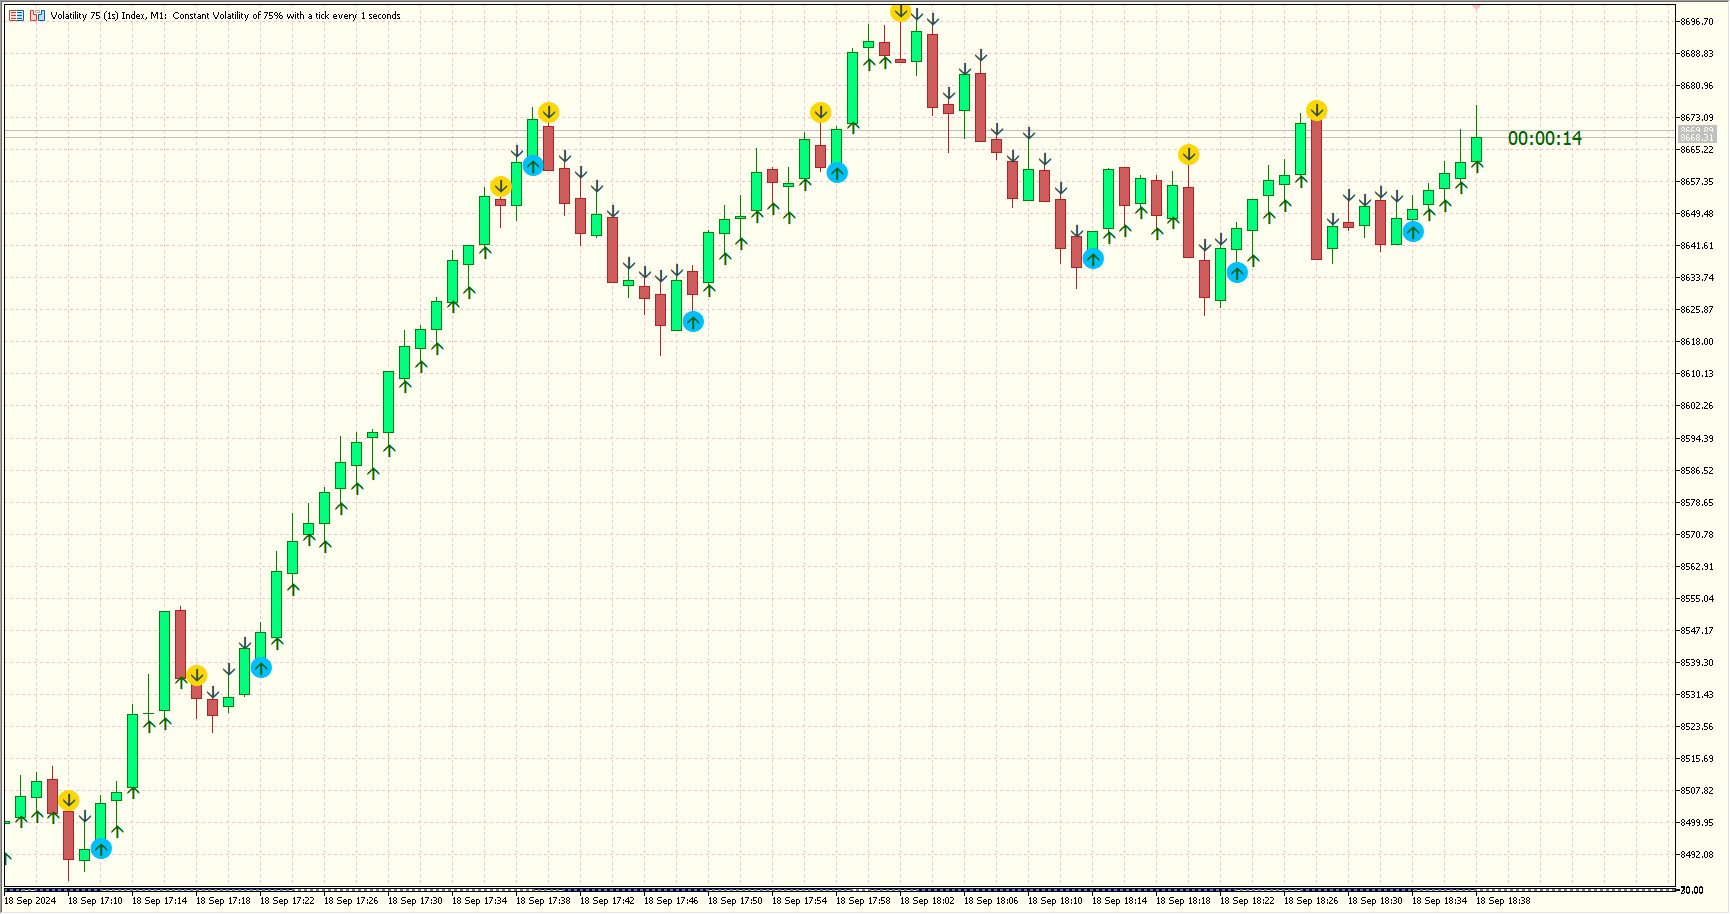
- シグナル精度の 2 つのモード:
- 「再描画を許可」モード: 事前にシグナルを提供し、次のキャンドルに向けて十分な準備と取引の機会を提供します。
- 「厳密に再描画なし」モード: 現在のキャンドルの開始時にリアルタイム シグナルを提供し、再描画がないことと 100% 正確なシグナル タイミングを保証します。
- バイナリ オプションのベスト:
このシステムはバイナリ オプション取引に最適です。シグナルに従い、取引の準備をし、自信を持って実行するだけです。
互換性:
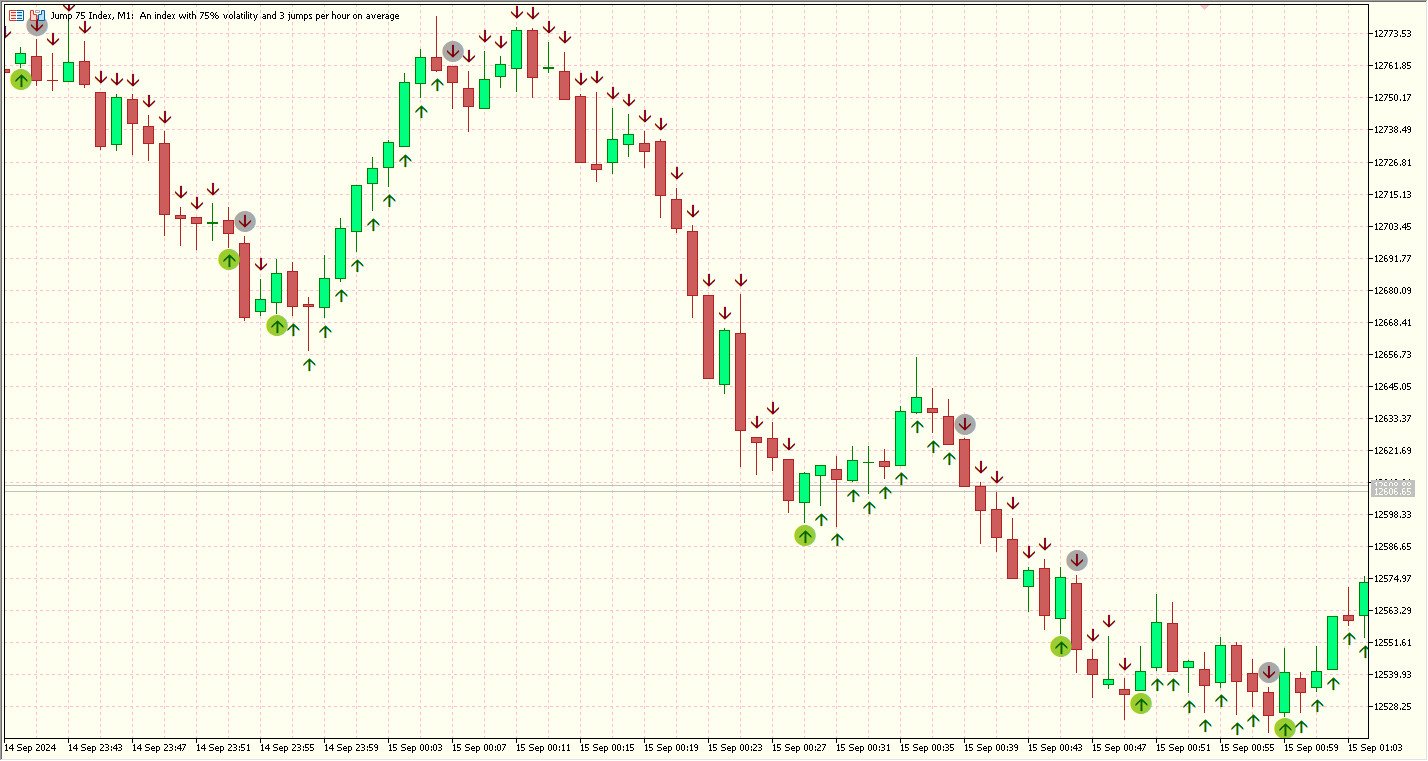
1. あらゆる時間枠で合成チャートを派生します。
2. Quotex、PocketOption、Binomo、Stockity、IQOption、Exnova、OlympTrade、Deriv、Binolla、Homebroker などのブローカーの OTC チャート。MT5 にインポート可能 (1 週間は無料のインポート サポート、その後は有料サービス)。
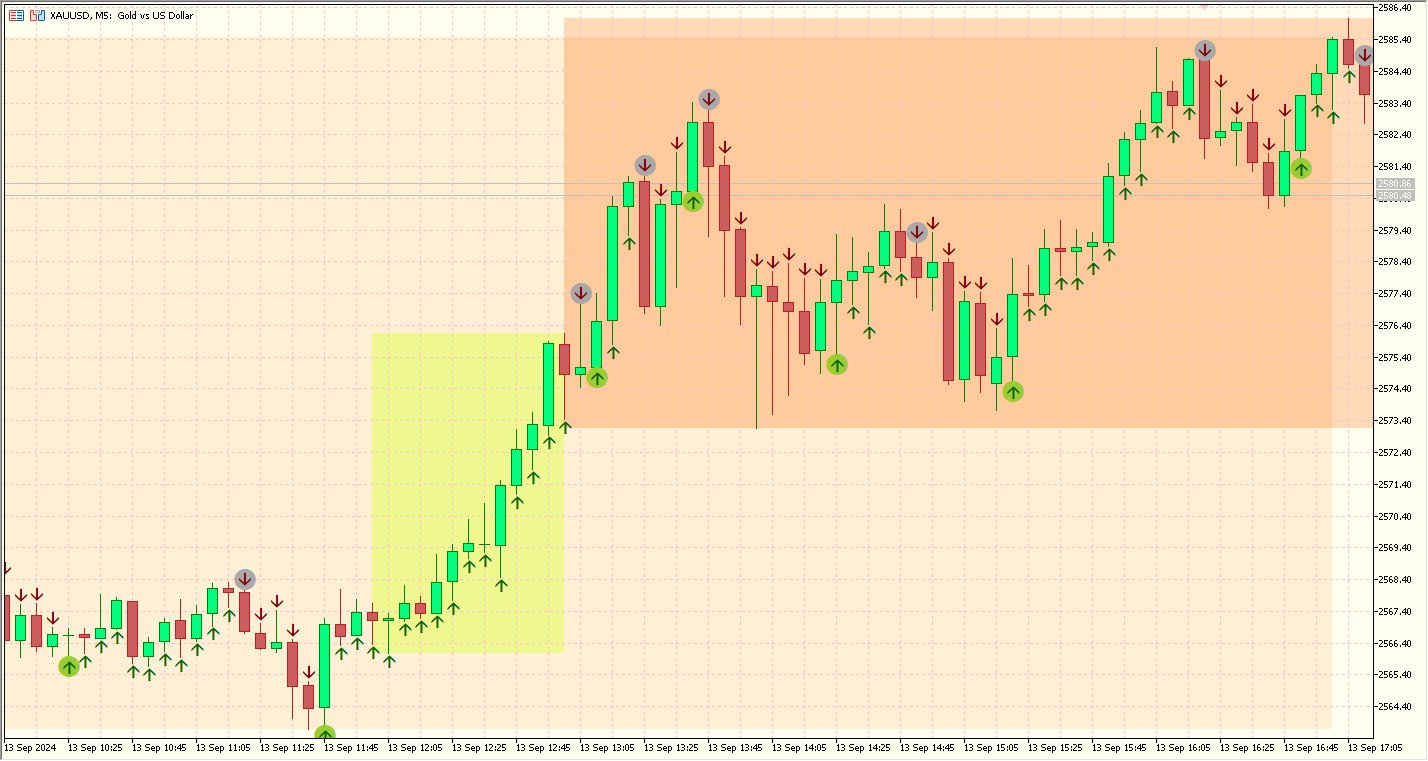
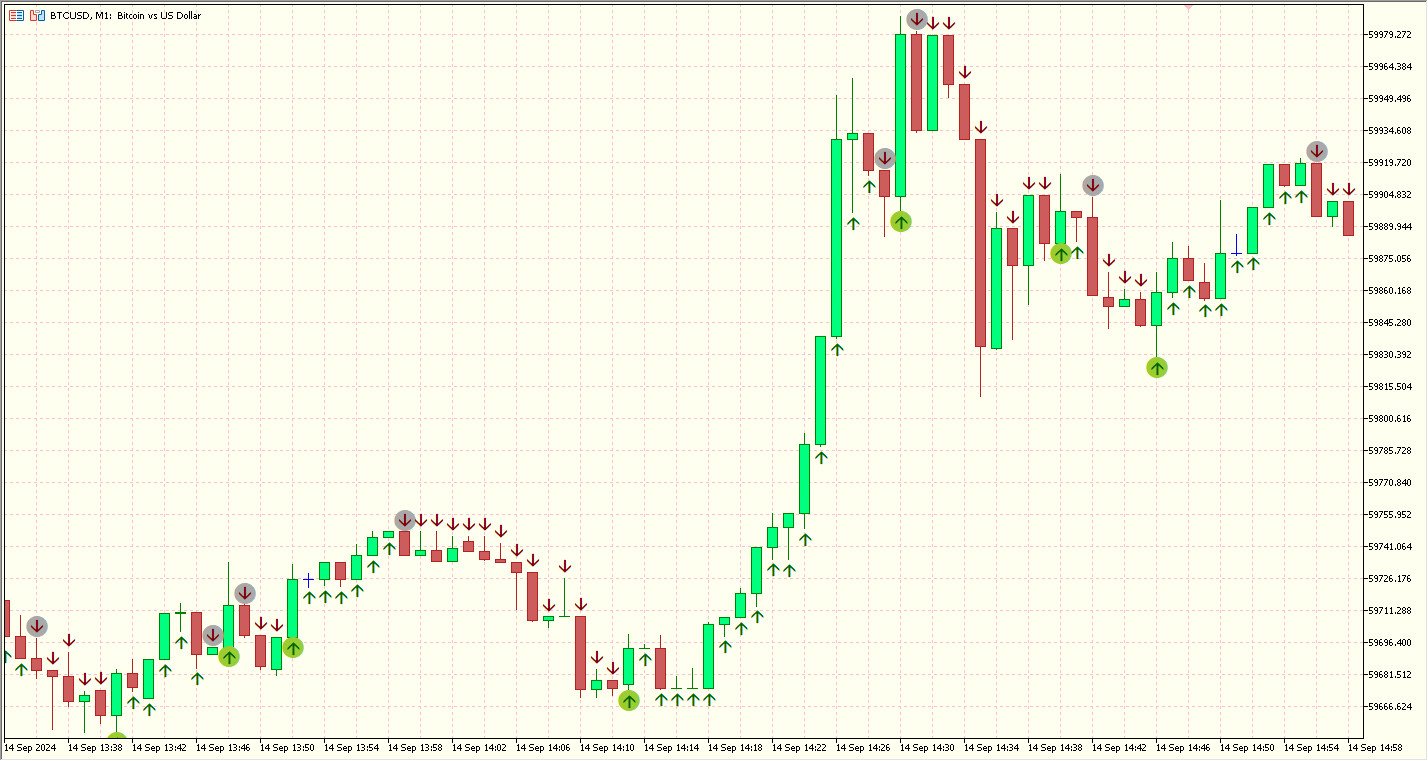
3. 幅広い資産の多様化のための Forex、Crypto、および商品市場。
4. 最適なパフォーマンスを得るには、90% 以上のペイアウト率の高ペイアウト バイナリ資産が推奨されます。
その他の利点:
1. 取引プランを提供: 一貫性と信頼性のある実行を保証するために、ステップバイステップの取引プランが含まれます。
2. 少ない作業で高いリターン: 1 日 1 時間の取引のみで済むため、時間が限られている方でも効率的に取引できます。
3. 明確な取引ルール: 固定取引ルールの完全な説明により、混乱が解消されます。詳細については、YouTube (@pstradeandsuccess) をご覧ください。
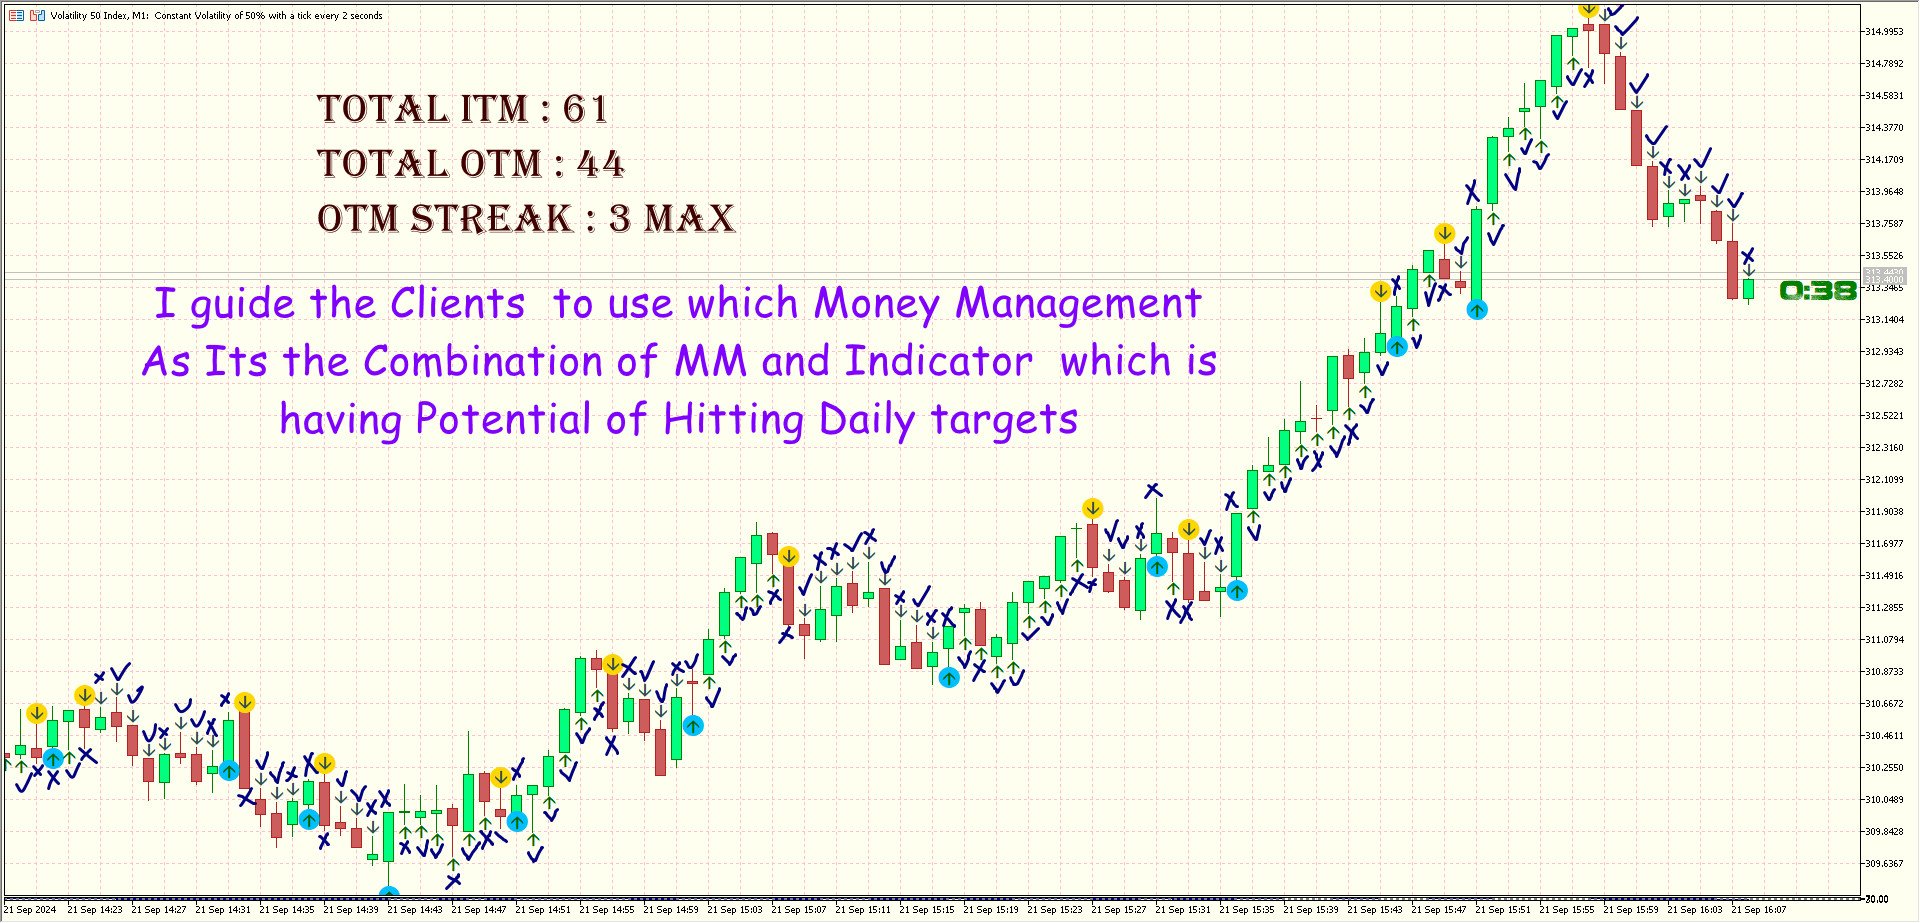
4. 資金管理ガイド: トレーディング プランと併せて収益性を高める高度な資金管理システムの使い方を学びます。
5. ユーザー フレンドリー: このシステムは非常に直感的なので、経験の浅いトレーダーでも、わずか数日の練習で使いこなせるようになります。
独自のセールス プロポジション (USP):
資金管理を適切に使用し、トレーディング プランを厳守すれば、このシステムは 1 日 1 時間の取引で 20 ~ 25% の成長を達成できる可能性があります。バイナリー オプション取引には固有のリスクがありますが、毎日安定した利益を得られる可能性ははるかに高くなります。余裕のある金額のみを使用してください。
---
免責事項:
バイナリー オプション、外国為替、暗号通貨の取引には大きなリスクが伴い、すべての投資家に適しているわけではありません。投資した資本をすべて失う可能性があります。過去のパフォーマンスは将来の結果を保証するものではありません。実際のお金で取引する前に、デモ アカウントで練習してください。この製品の使用中に発生する可能性のある金銭的損失については、当社は一切責任を負いません。常に、失ってもよい資金で取引してください。