RR TradeManager Visualizer
- インディケータ
- Komi Eyram F Kahoho
- バージョン: 2.0
- アップデート済み: 3 10月 2024
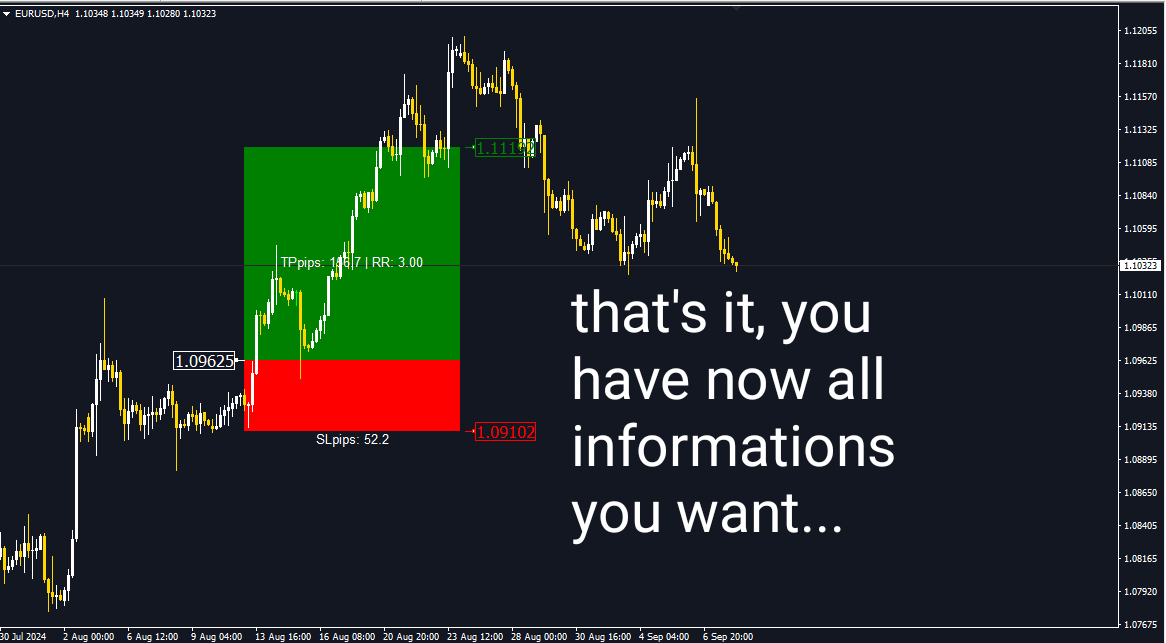
RR_TradeManager Visualizer は、トレーダーがチャート上で利益確定(TP)および損切り(SL)レベルを簡単に視覚化できるように設計されたトレード管理ツールです。この初期バージョンは、SLおよびTPゾーンとエントリープライスを表示するシンプルなグラフィカル表現を提供します。現在のバージョンは、グラフ上でSLおよびTPゾーンを図形として視覚化することにのみ焦点を当てています。
現在のバージョンの特徴:
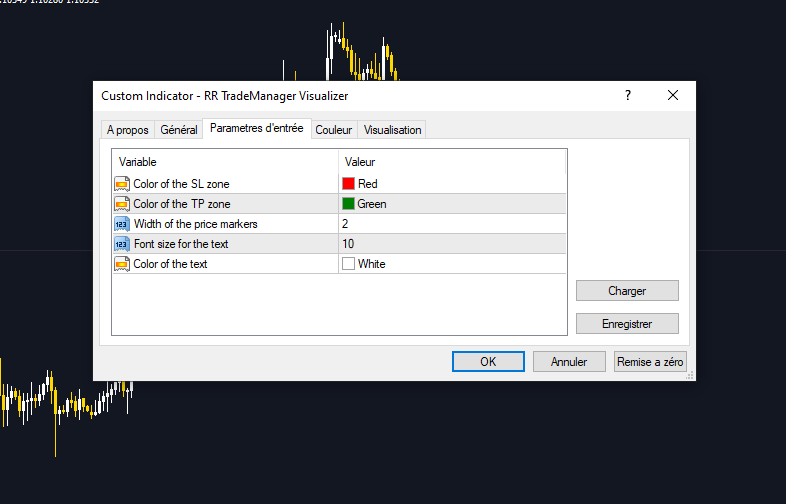
- SLおよびTPゾーンの表示: カスタマイズ可能な色で、ストップロスとテイクプロフィットレベルのクリアな視覚化を提供します。
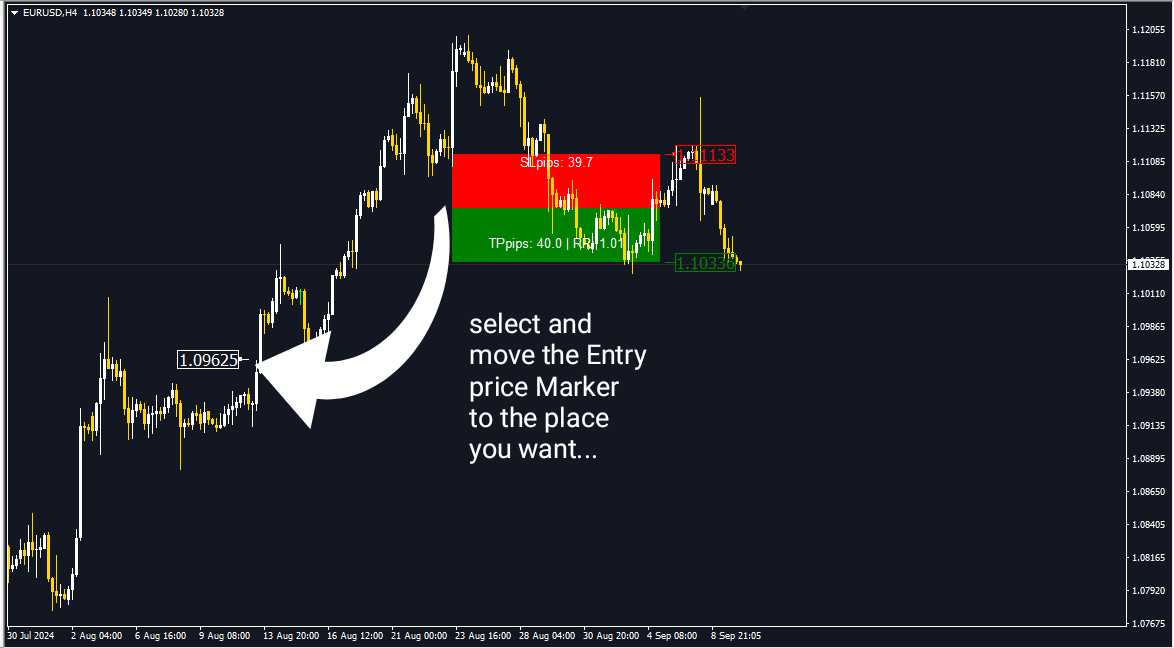
- 移動可能なエントリープライス: チャート上でエントリープライスを移動させることで、SLおよびTPレベルの反応を見ることができます。
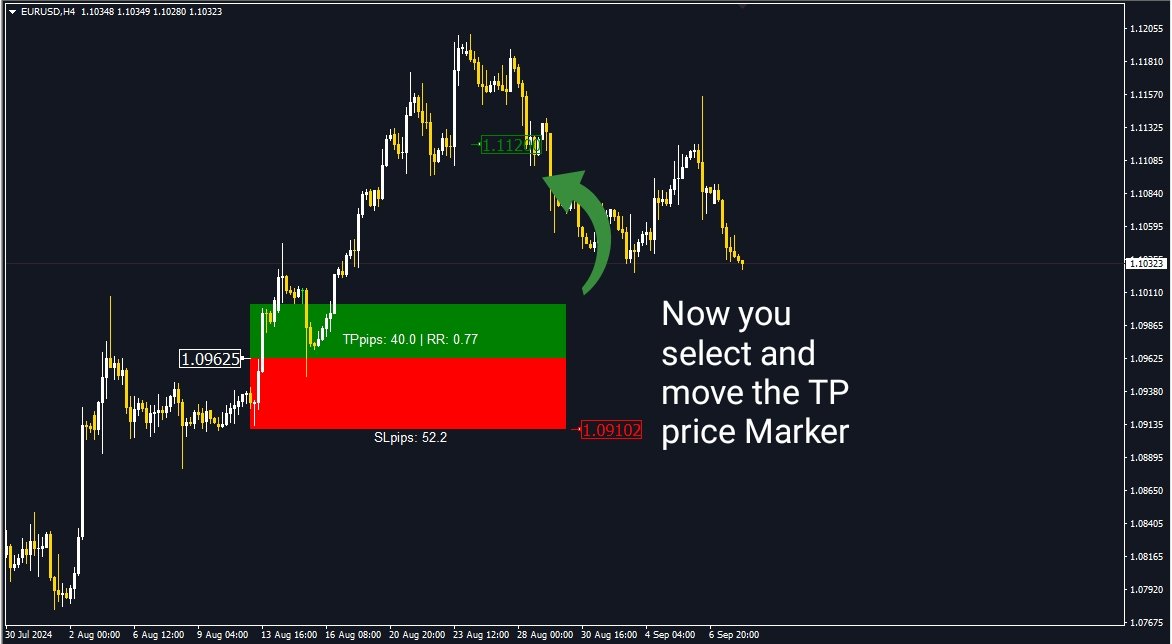
- リスクリワード比の計算: 定義されたレベルに基づいたリスクリワード比の動的表示。
使用方法:
- エントリープライスの設定: チャートをクリックしてエントリープライスを設定します。
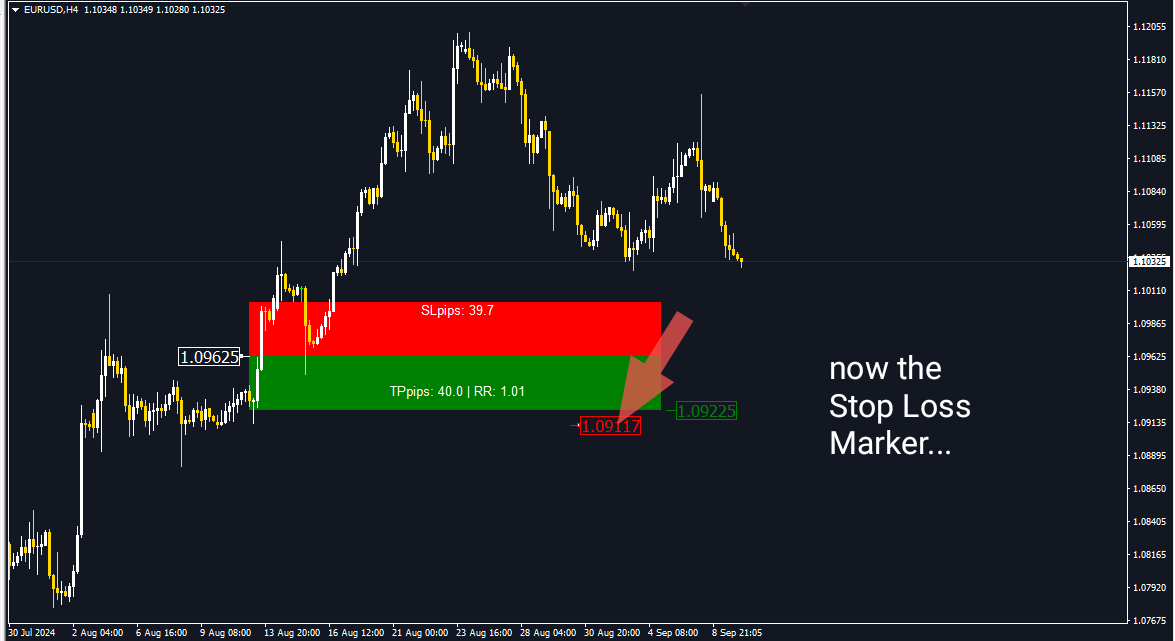
- SLおよびTPレベルの調整: SLおよびTPゾーンを移動させて、リスクとリターンのレベルを調整します。
- ゾーンの視覚化: SLおよびTPゾーンが異なる色で表示され、視覚化が容易になります。
近日公開予定: さらに多くの機能と改善が加えられた更新バージョンが数日以内に登場しますので、お楽しみにしてください。
お願い: RR_TradeManager Visualizer が役立つと感じた場合は、ぜひ製品ページで評価をお願いします。皆様のご意見は非常に重要であり、ツールの改善に役立てさせていただきます。