• 概要
  • レビュー
  • コメント

BenchTrade AnyIndicator

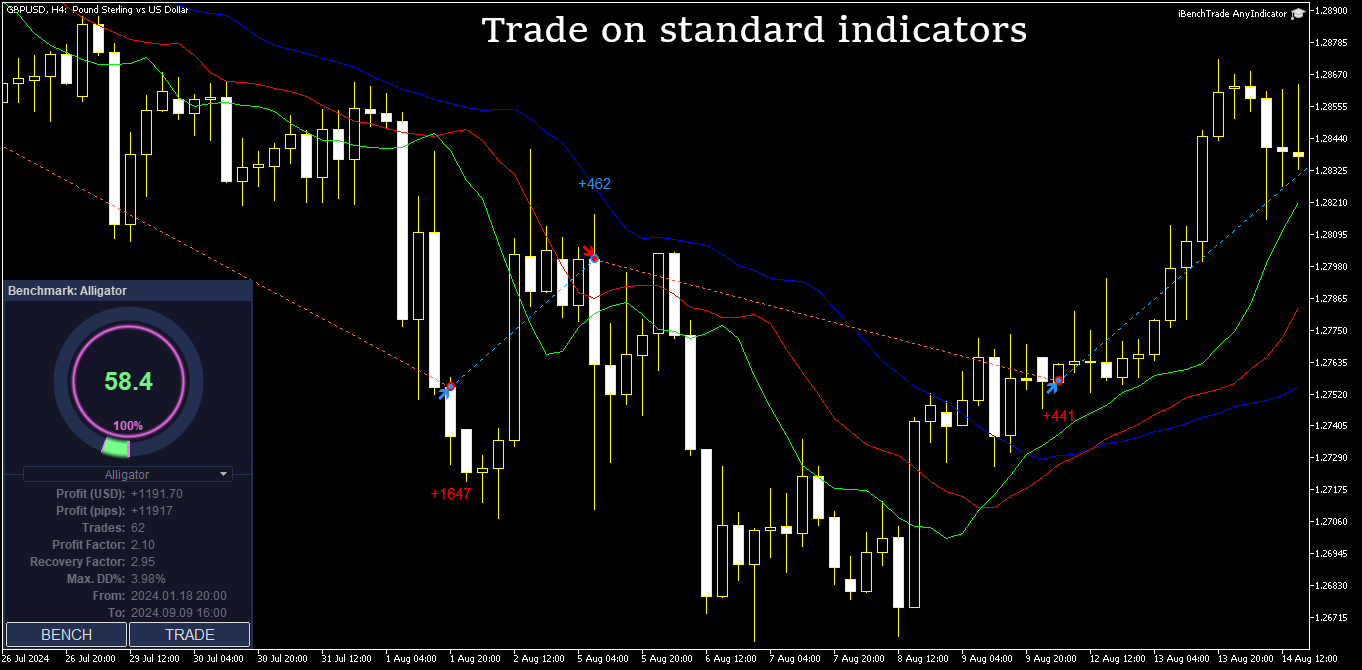
This is a versatile tool that allows you to trade using any indicators on the chart and perform its benchmarking. Full compatibility with the strategy tester enables you to optimize and test your strategies on historical data, minimizing risks. Maximum flexibility and ease of use make it an ideal choice for traders of all levels.


This EA is a powerful tool that takes automated trading to the next level. It is perfectly suited for both beginner traders and experienced professionals looking to optimize their trading strategies.


Key Features:

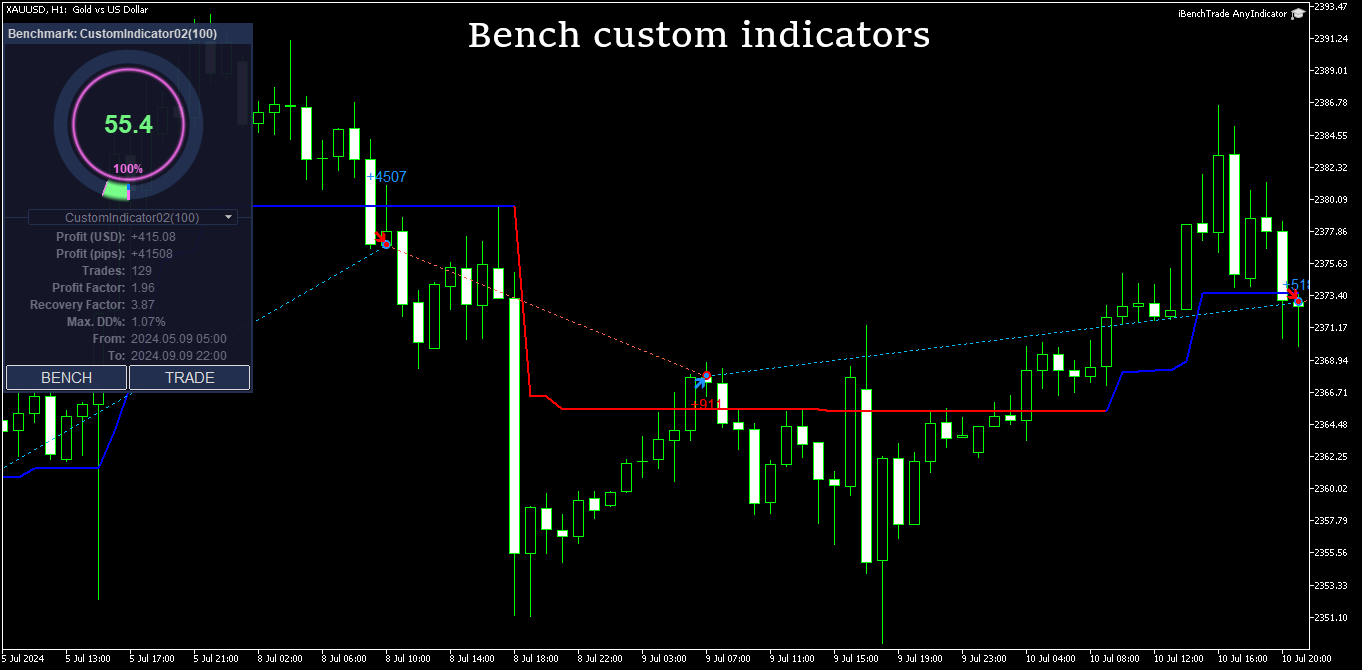
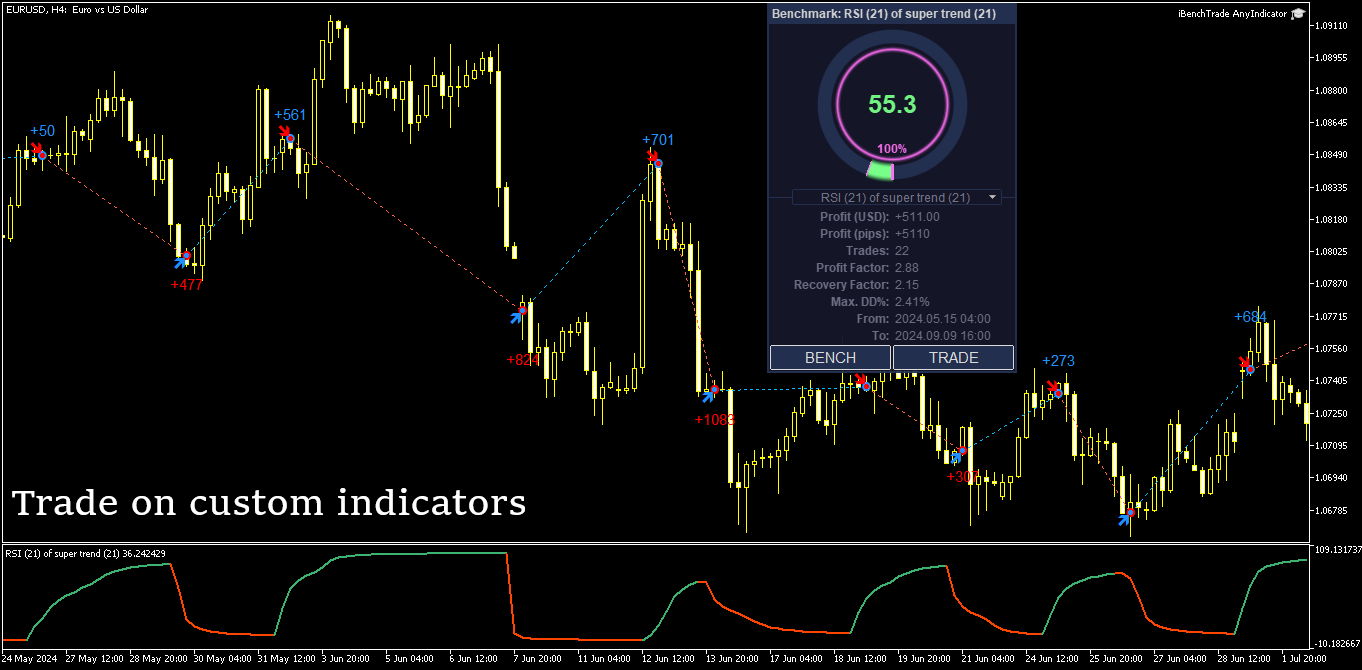
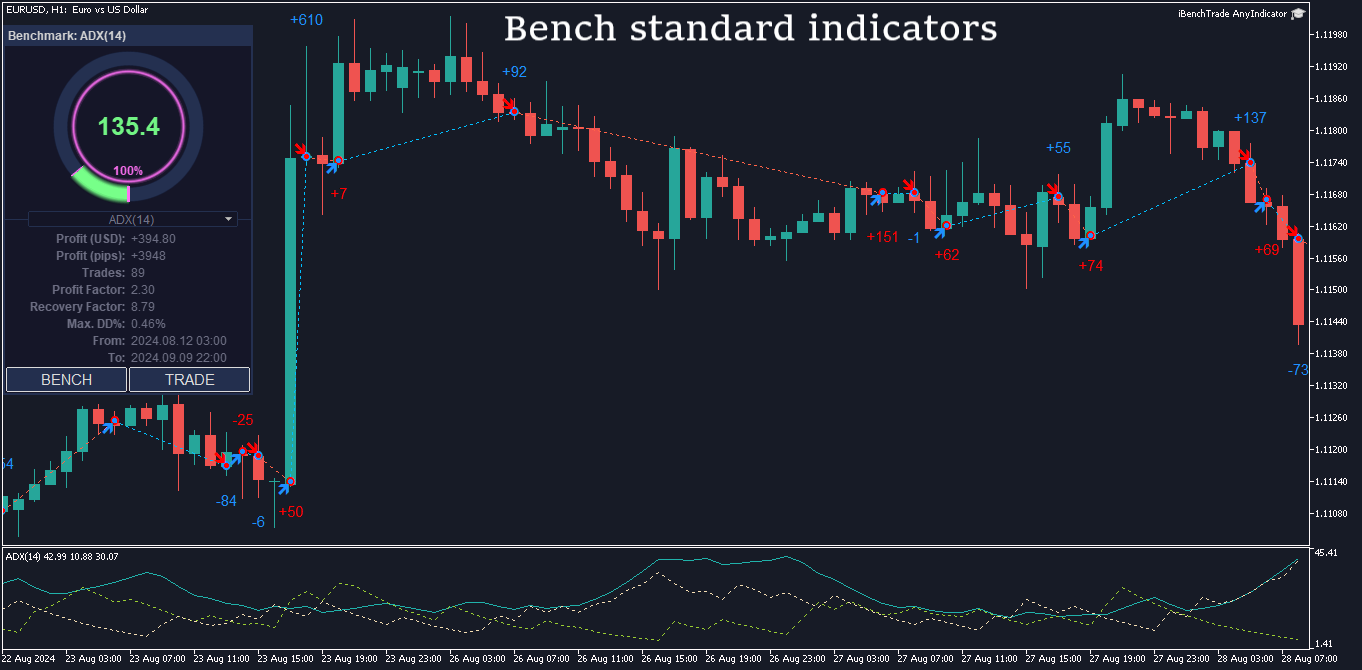
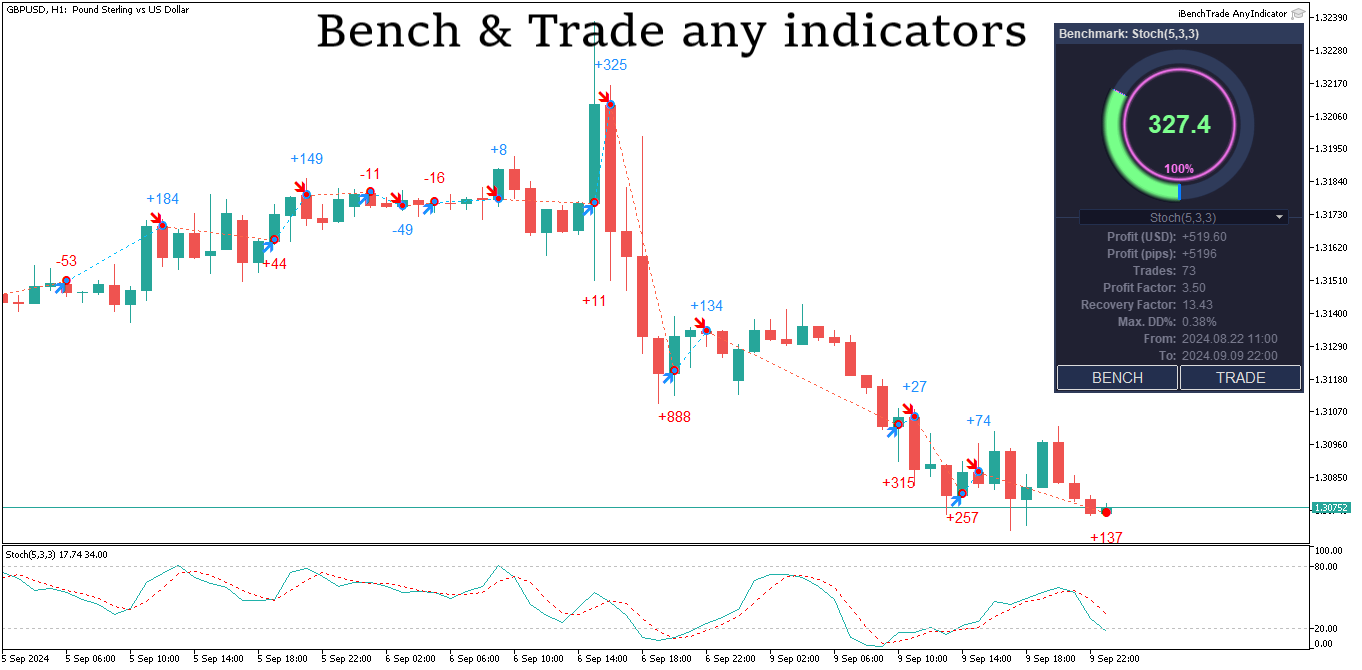
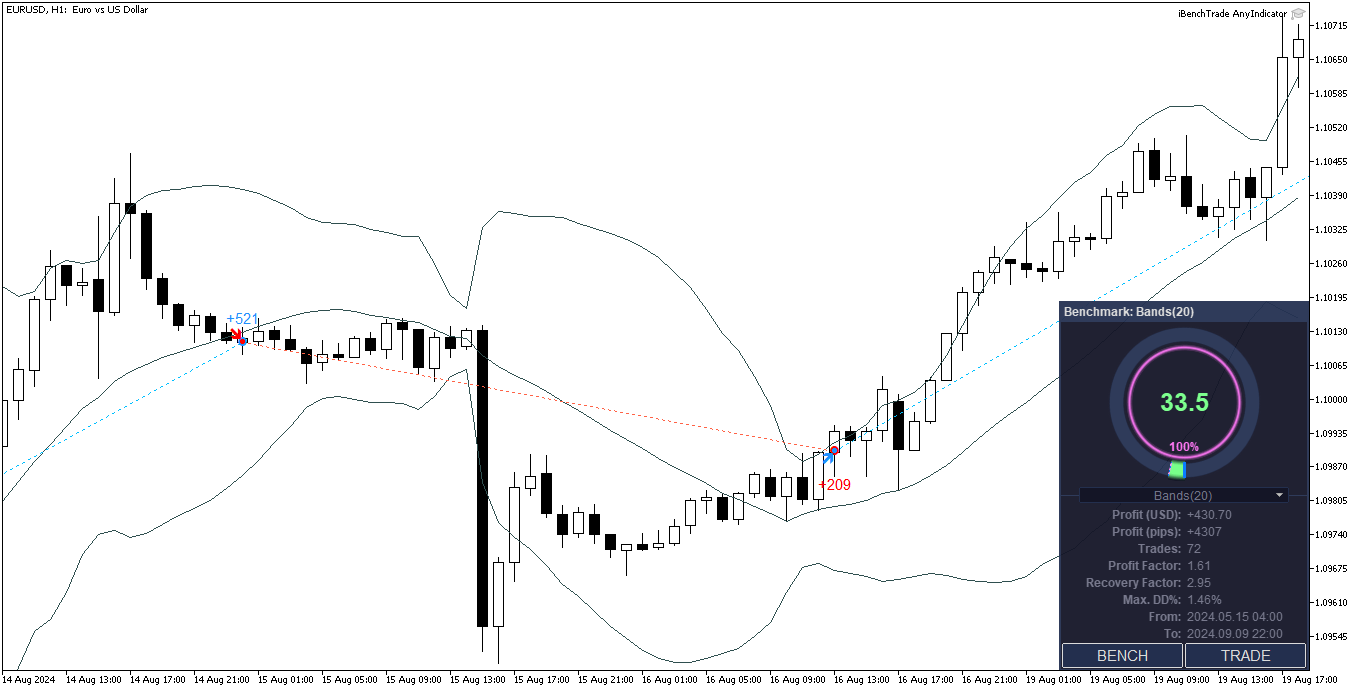
  • Support for Any Indicators: The Expert Advisor can trade using any indicators (both standard and custom) that you apply to the chart. This gives you complete freedom to create unique trading strategies.
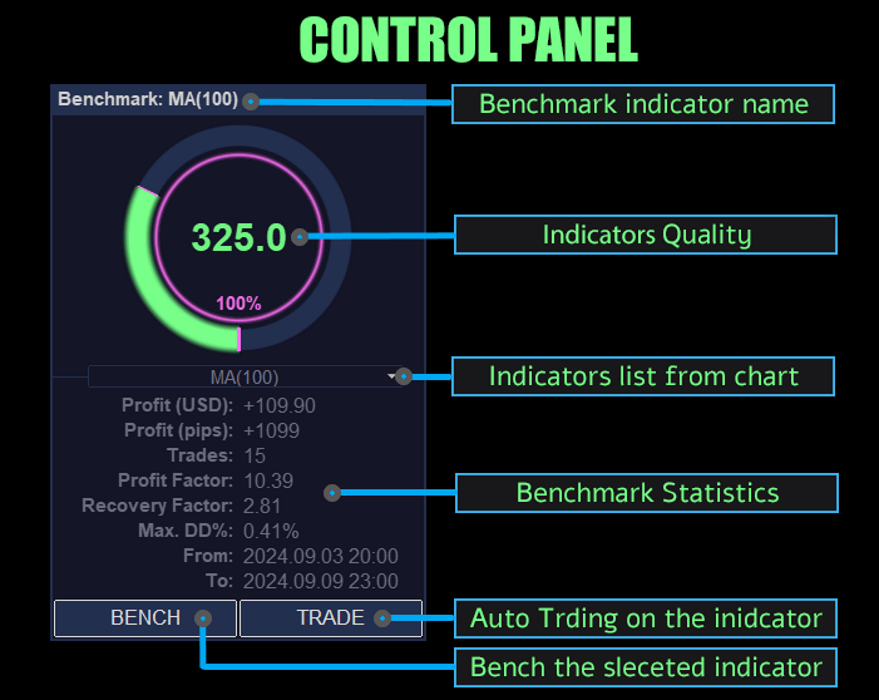
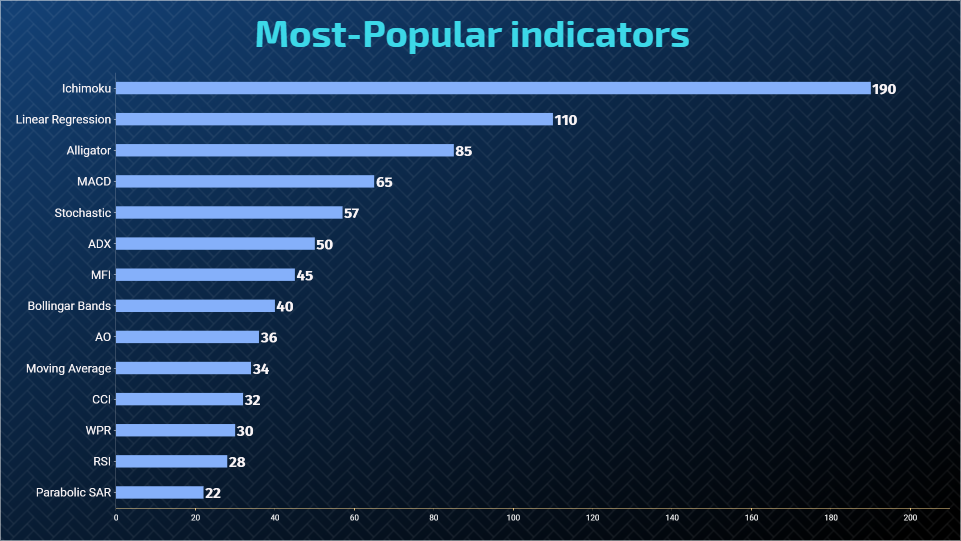
  • Benchmarking: The built-in benchmarking feature allows you to assess the effectiveness of your indicators in real-time. You can easily compare the results of different indicators and choose the most profitable ones.
  • Flexible Settings: Customize trading parameters to suit your needs. The Expert Advisor supports a wide range of settings, including risk management, various stop-loss and take-profit methods.
  • User-Friendly Interface: The intuitive and easy-to-use interface allows you to quickly set up and start trading, even if you have limited knowledge of the platform or algorithmic trading.
  • High Performance: Optimized code ensures fast and stable operation, which is especially important when trading in highly volatile markets.
  • Strategy Tester Compatibility: The Expert Advisor is fully compatible with the strategy tester, allowing you to test and optimize your indicators on historical data. This helps you identify the strengths and weaknesses of your indicators before applying them to a live account, minimizing risks and increasing your chances of success.

Who Is This Product For?

This tool is ideal for traders who want to find the most profitable indicators and automate their trading strategies, improve their accuracy and efficiency, and for those who seek maximum flexibility in choosing indicators and trading parameters.


作者のその他のプロダクト
Indicator-forecaster. Very useful as an assistant, acts as a key point to forecast the future price movement. The forecast is made using the method of searching the most similar part in the history (pattern). The indicator is drawn as a line that shows the result of change of the close price of bars. The depth of history, the number of bars in the forecast, the patter size and the quality of search can be adjusted via the indicator settings. Settings: PATTERN_Accuracy_ - quality of the search.
FREE
Tired of adjusting the indicator settings losing precious time? Tired of the uncertainty regarding their efficiency? Afraid of the uncertainty in their profitability? Then the indicator ACI (automatically calibrateable indicator) is designed exactly for you. Launching it, you can easily solve these three issues just performing the simplest action: clicking a single Calibrate button. To achieve the highest efficiency, you should perform another additional action: move the power slider to the maxi
FREE
Do you want to see the future lines of the ZigZag indicator? This indicator will help you do that because the indicator model is based on two indicators: Historical Memory and ZigZag. So it can forecast the ZigZag lines. Very useful as an assistant, acts as a key point to forecast the future price movement. The forecast is made using the method of searching the most similar part in the history (pattern) to the current one.  The indicator is drawn as a line that shows the result of change of the
The B150 model is a fully revised version of the Historical Memory indicator with an improved search algorithm. It also features a graphical interface what makes working with this tool quick and convenient. Indicator-forecaster. Very useful as an assistant, acts as a key point to forecast the future price movement. The forecast is made using the method of searching the most similar part in the history (patter). The indicator is drawn as a line that shows the result of change of the close price o
Every indicator has its advantages and disadvantages. Trending ones show good signals during a trend, but lag during a flat. Flat ones thrive in the flat, but die off as soon as a trend comes. All this would not be a problem, if it was easy to predict when a flat changes to a trend and when a trend changes to a flat, but in practice it is an extremely serious task. What if you develop such an algorithm, which could eliminate an indicator's flaws and enhance its strengths? What if such an algori
Do you want to see the future lines of the ZigZag indicator? This indicator will help you do that because the indicator model is based on two indicators:   Historical Memory   and ZigZag. So it can forecast the ZigZag lines. Very useful as an assistant, acts as a key point to forecast the future price movement. The forecast is made using the method of searching the most similar part in the history (pattern)   to the current one.  The indicator is drawn as a line that shows the result of change o
The B150 model is a fully revised version of the Historical Memory indicator with a significantly improved algorithm. It also features a graphical interface what makes working with this perfect tool quick and convenient. Indicator-forecaster. Very useful as an assistant, acts as a key point to forecast the future price movement. The forecast is made using the method of searching the most similar part in the history (patter). The indicator is drawn as a line that shows the result of change of the
Every indicator has its advantages and disadvantages. Trending ones show good signals during a trend, but lag during a flat. Flat ones thrive in the flat, but die off as soon as a trend comes. All this would not be a problem, if it was easy to predict when a flat changes to a trend and when a trend changes to a flat, but in practice it is an extremely serious task. What if you develop such an algorithm, which could eliminate an indicator's flaws and enhance its strengths? What if such an algori
Every indicator has its advantages and disadvantages. Trending ones show good signals during a trend, but lag during a flat. Flat ones thrive in the flat, but die off as soon as a trend comes. All this would not be a problem, if it was easy to predict when a flat changes to a trend and when a trend changes to a flat, but in practice it is an extremely serious task. What if you develop such an algorithm, which could eliminate an indicator's flaws and enhance its strengths? What if such an algorit
This indicator identifies the global trend and has a powerful algorithm for filtering out any type of noise that can interfere with trend direction identification. A special filter shows areas of sideways trend, consolidation or flat, which allows you to avoid any uncertainties in the market movement vision and gives a clear understanding of the global trend movement. This indicator has no analogues and gives it unique advantages in the analysis of price movements and determination of the dir
Do you want to know how an economic event will impact price? What will happen to price after the news? How has an economic news affected price in the past? This indicator can help you with that. Do you like technical analysis? Do you enjoy studying the history to predict the future? But what do you think could be more important than technical analysis, what could improve technical analysis? Of course, it's fundamental analysis! After all, economic events directly impact the market, and theref
Do you want to know how an economic event will impact price? What will happen to price after the news? How has an economic news affected price in the past? This indicator can help you with that. Do you like technical analysis? Do you enjoy studying the tick history to predict the future? But what do you think could be more important than technical analysis, what could improve technical analysis? Of course, it's fundamental analysis! After all, economic events directly impact the market, and t
フィルタ:
レビューなし
レビューに返信