• 概要
  • レビュー
  • コメント
  • 最新情報

Orderflow Footprint

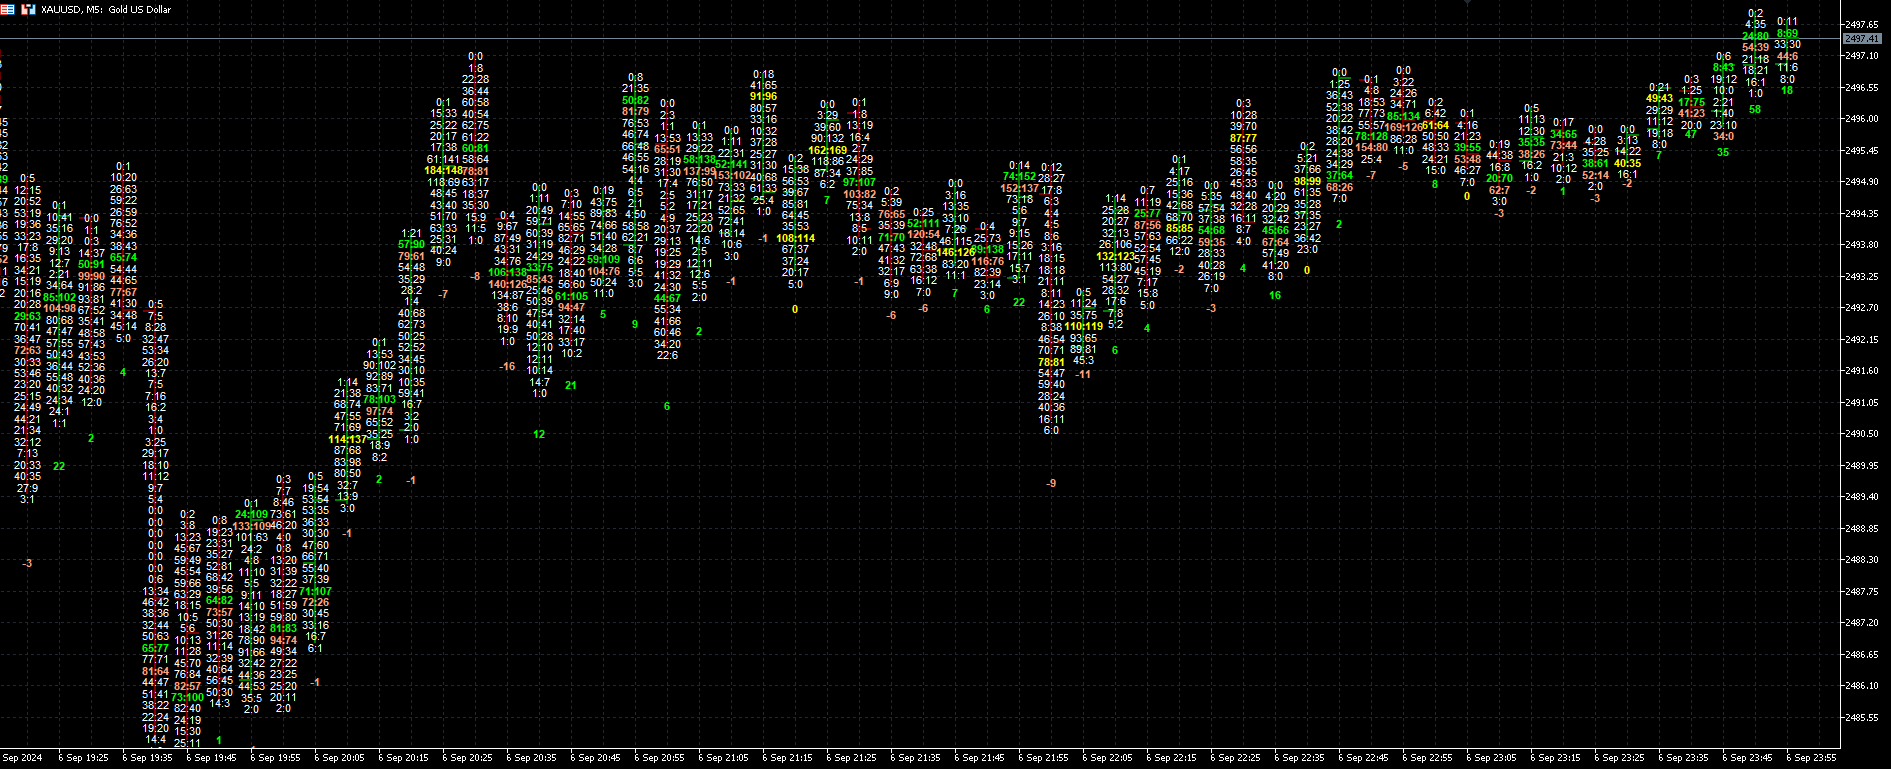
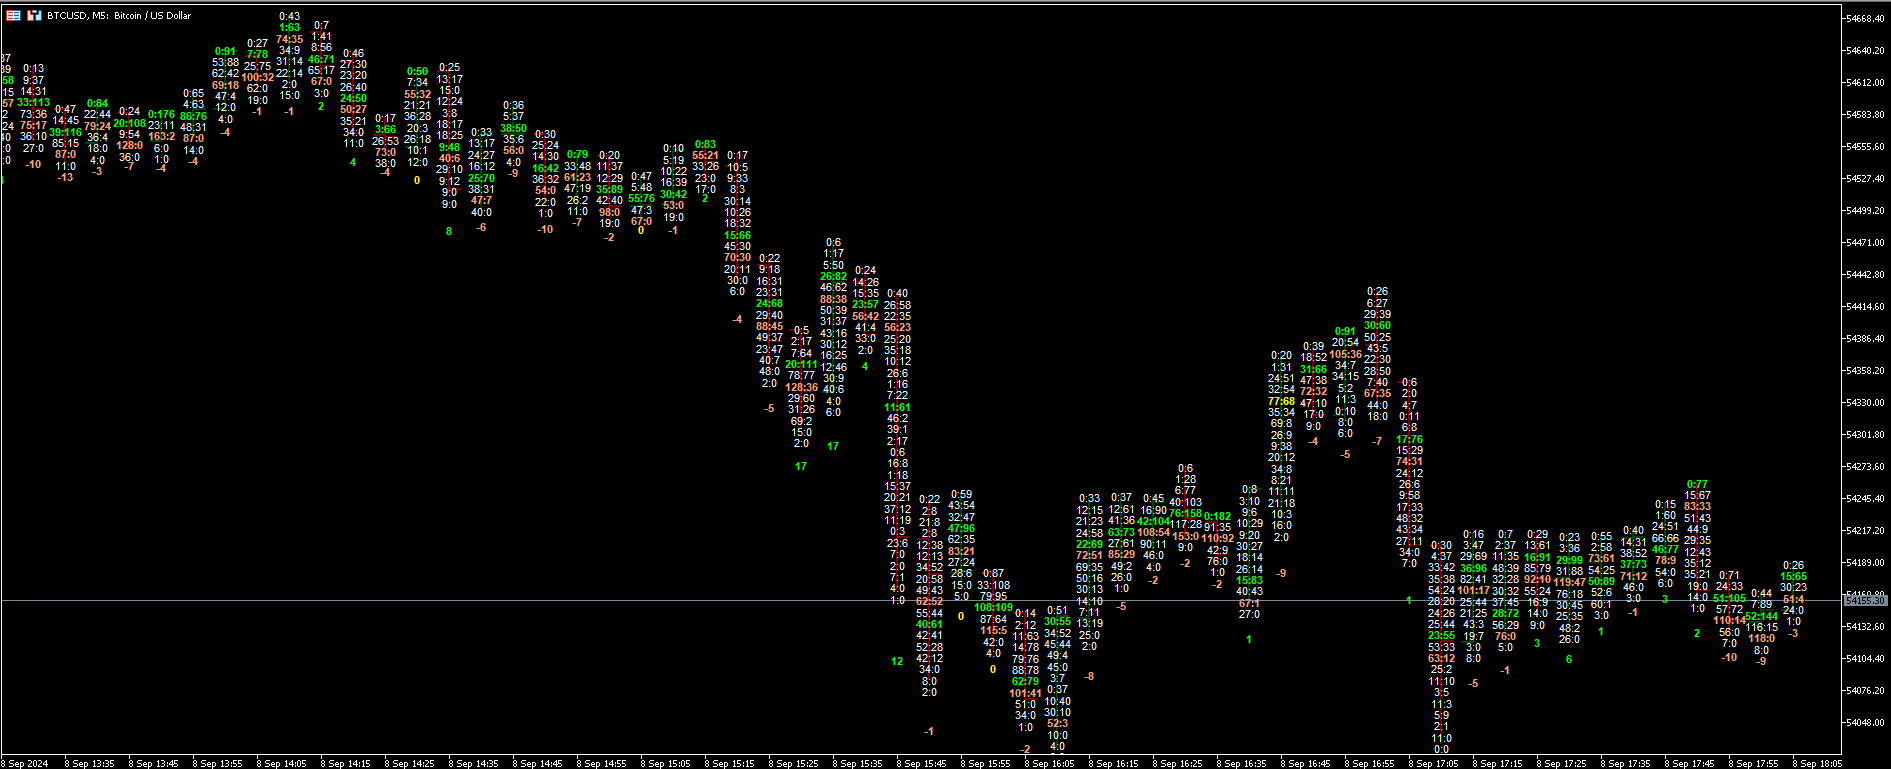
Footprint charts can add a level of depth to your visuals that standard charts cannot achieve.
Footprint charts are a powerful way to visualize the ups and downs of the market, helping you potentially to make better trading decisions. Orderflow Footprint in MT5. show # of market orders at each tick.

Inputs

  •    Point Scale *1 to *10000
  •    Number of candle to show.
  •    Font Size
  •    Max Bid Color (Top Seller)
  •    Max Ask Color (Top Buyer)
  •    Max Bid and Ask Color
  •    Normal color


おすすめのプロダクト
Introduction This indicator detects volume spread patterns for buy and sell opportunity. The patterns include demand and supply patterns. You might use each pattern for trading. However, these patterns are best used to detect the demand zone (=accumulation area) and supply zone (=distribution area). Demand pattern indicates generally potential buying opportunity. Supply pattern indicates generally potential selling opportunity. These are the underlying patterns rather than direct price action. T
Best swing
Winsou Cedric Anicet Kpanou
-- BEST SWING  -- L'indicateur BEST SWING est un indicateur technique personnalisé, un excellent outil pour négocier les cassures en fonction des niveaux de support et de résistance horizontaux. L'indicateur BEST SWING utilise une formule complexe en analysant des données de prix autrement incongrues sur les cours de clôture de chaque période, ainsi que les hauts et les bas du prix, afin de donner un aperçu de la force ou de la faiblesse de la tendance du marché et de sa probabilité
This Indicator draws Fibonacci Extension levels in two different ways. You can select whether to draw Fibonacci Extension levels based on your favourite ZigZag settings or you can let the indicator to draw Fibonacci Extension  level based on given number of Bars or Candles.  You can also set Mobile and Email notification for your favourite Extension  levels individually. With this indicator you will not have to feel lonely as the it can generate Voice alerts, which will keep you focused on your
Market Noise マーケットノイズは、価格チャート上の市場の局面を決定する指標であり、また、蓄積または分配局面が発生したときに、明確で滑らかなトレンドの動きとノイズの多い平坦な動きを区別します。 各フェーズは、独自のタイプの取引に適しています。トレンド追跡システムにはトレンド、積極的なシステムにはフラットです。 市場のノイズが始まったら、取引を終了することを決定できます。 同様に、またその逆も同様で、騒音が止んだらすぐに、積極的な取引システムをオフにする必要があります。 一方からもう一方に切り替えて、両方のタイプの取引戦略を取引することができます。 したがって、この指標は取引決定の分野で優れたアシスタントの役割を果たします。 すべての価格変動は、選択した期間の一般的な価格変動と、この期間内の価格変動の形でのノイズという 2 つの要素に分けることができます。 同時に、異なる期間の異なる市場では、ノイズ成分とトレンド成分の間の幅広い相互関係を示すことができます (図 1)。 価格変動のノイズレベルが高くなるほど、基礎的なトレンドの方向性と強さを識別することが難しくなります。 した
このインジケーターは、実際の取引に最適なウェーブ自動分析インジケーターです。 バンドの標準化された定義は、もはや異なる人々の波ではなく、人為的な干渉の描画が排除されます。これは、アプローチの厳密な分析において重要な役割を果たします。         現在購入割引!   => Increase the choice of international style mode, (red fall green rise style) インデックスの内容: 1.1。     基本波: まず、価格変動過程で基本変動の変曲点を見つけましたが、もちろん、彼の注文はそれほど強くないので、次の計算の基礎になります。 2.2。     二次帯域 :基本波に基づいて、アルゴリズム分析を通じてより明白な二次帯域が得られ、二次帯域は波解析の基礎を提供します 3.3。     波: より明確な傾向とより明確で直感的な方向性があります。波が続くかどうかを分析するには、二次波帯の形状を調べ、二次波の組成を分析して、その後の予測を取得する必要があります。波。 4.4。     チャネル: チャネル計算で
Volume Trade Levels
Mahmoud Sabry Mohamed Youssef
The idea behind this indicator is very simple , First it contains 2 mechanisms to place your trades: 1- Enter the Pips you want to duplicate to price levels. 2- Automatically let the indicator specify the largest Buy / Sell Volume Candle and place duplicated levels based on the candle itself. How it works: 1- Enter the Pips you want to duplicate to price levels:    1- once the indicator is loaded you will need first to Specify the number of pips in the indicator Configuration window ,you can
AI Forecast MT5
Leonardo Antonio Camacaro Armas
The "AI Forecast" indicator is the result of a unique experiment in which I asked an AI how to create the best indicator to anticipate the market. The AI suggested measuring the past history of the price and its reactions to different levels, and then calculating the probabilities of the price reaction in the future. With this idea, I designed with the help of another AI the "AI Forecast" indicator, which adapts to any MetaTrader chart and shows you three lines: one for entry and two for poss
バイナリ オプションの可能なコールおよびプット エントリを生成する人工知能に基づくインジケーター。 このインジケーターは 3 つの異なる戦略で機能します。 1) 出来高を読み取ることで、価格が反転する時期にシグナルを送信します。 2) 価格と出来高の乖離を通じて、トレンドが継続するか反転するかを知らせます。 3) 価格と出来高の収束を通じて、トレンドが継続すべき時期にシグナルを送信します。 この指標はすべての時間枠で機能しますが、最良の結果は 3 分または 5 分の期限で得られます (制度的な攻撃は短い時間枠で見られるため)。 最も流動性の高い時間帯、つまりグリニッジ標準時 7 時からグリニッジ標準時 18 時までが最適です。 このインジケーターは正しいシグナルの 70% 以上を生成しますが、価格を操作する機関同士の争いに遭遇したり、相互に拒否したりして、一連の誤ったシグナルが生成される可能性があります。そのため、適切な資金管理を使用することをお勧めします (Masaniello の例) )
This indicator simplifies your entry zones by displaying the areas where you can plan your entry that potentially could give you high risk/reward ratios. Other than picking the most optimal entry points, the Hot Zone indicator can act as your typical support/resistance indicator for pullbacks for all timeframes. You can use this indicator as the only trading indicator or use it with another indicator for reentry purposes.  Besides, when using Hot Zones, the risk/reward ratio should be well abov
Keltner Channels (ou   Canais de Keltner ) é mais um indicador de   volatilidade   utilizado pela   análise técnica. Também chamado de   envelope , esse canal foi criado por Chester Keltner para monitorar os seus investimentos no mercado futuro de café na década de 1960. Porém, com o passar do tempo, passou também a ser utilizado para outros ativos e, atualmente, é uma das ferramentas mais utilizadas pelos traders. Nesta versão customizada foram adicionados novas opções de método de média movel
This indicator is based on the mathematics of the great trader W.D. Ganna. With its help, you can easily find strong levels by analyzing swings to find the optimal entry point. The indicator works on all instruments and all timeframes. The indicator is fully manual and has control buttons. All you need to do is press the NEW button, a segment will appear, which you can place on any movement, swing or even 1 candle that you want to analyze. By placing the segment, press the OK button. A grid (th
Disclaimer : Keep in mind that seasonal patterns are not always reliable. Therefore, thoughtful risk management is crucial to minimize losses.  Seasonal patterns in the financial world are like a well-guarded secret that successful investors use to their advantage. These patterns are recurring price movements that occur during specific periods or around special events. Additionally, there are also intraday patterns that repeat. For example, Uncle Ted from Forex Family suggests examining previou
This indicator closes the positions when Profit. This way you can achieve a goal without determine Take Profit.  Parameters: Profit: the amount of Dolllars you want to close when profit.  Just determine Profit section and open new positions. If Any of your positions reaches above Profit , Indicator will close automatically and you will recieve your Profit. 
To get access to MT4 version click here . This is the exact conversion from "Nadaraya-Watson Envelope" by " LuxAlgo ". (with non-repaint input option) This is not a light-load processing indicator if repaint input is set to true . All input options are available.  Buffers are available for processing in EAs. I changed default input setup to non-repaint mode for better performance required for mql market validation procedure . Here is the source code of a simple Expert Advisor operating based on
Visual Heatmap Book Analyser This indicator monitors the market liquidity and generates colors based on order patterns, quantities, and renewal activities in the book. This allows you to visualize the order flow and identify areas of high and low liquidity and activity. The indicator uses machine learning techniques to analyze the order behavior in the book, enabling it to detect patterns and trends in orders, allowing you to make informed decisions about your trading operations. The color pal
This product is designed for the MT5 platform and offers two key features: VWAP (Volume Weighted Average Price) calculation and Volume Profile analysis. Advantages: VWAP Calculation: The product calculates the VWAP, which is a popular indicator used by traders to determine the average price of a security based on its trading volume. It helps identify potential buying or selling opportunities by comparing the current price to the average price weighted by volume. Volume Profile Analysis: The prod
My PVSR
Ashok Kumar Singha
My PVSR   is based on All Type of Pivot Points. Use this Indicator to get proper Support / Resistance Zone and Trade accordingly.. Recommendation: Use this Indicator along with my another Indicator --->>> Dr. Trend   <<<--- Click Here ; To get the best output result feel free to contact me ; Best of Luck It can be used for: All Pairs: Forex, Cryptocurrencies, Metals, Stocks, Indices etc. All Timeframe All Brokers All type of Trading Style like Scalping, Swing, Intraday, Short-Term, Lon
Elevate Your Trading Experience with the famous UT Bot Alert Indicator! Summary: The UT Bot Alert Indicator by Quant Nomad has a proven track record and is your gateway to a more profitable trading journey. It's a meticulously crafted tool designed to provide precision, real-time insights, and a user-friendly experience.  Key Features: 1. Precision Analysis: Powered by advanced algorithms for accurate trend identification, pinpointing critical support and resistance levels. 2. Real-time Ale
RSImaxmin
Carlos Andrés Moya Erazo
4.5 (10)
The indicator shows when there are overprice and divergences on the RSI. In addition, it has configurable alerts, dynamic overprice levels and a special “RSI cleaner” function. The indicator that automatically calculates the premium rates! RSImaxmin is an indicator based on the Relative Strength Index (RSI) oscillator that effectively identifies changes in price trends as it reflects the relative strength of bullish movements compared to bearish movements. It is widely used by traders to measur
XFlow shows an expanding price channel that helps determine the trend and the moments of its reversal. It is also used when accompanying transactions to set take profit/stop loss and averages. It has practically no parameters and is very easy to use - just specify an important moment in the history for you and the indicator will calculate the price channel. DISPLAYED LINES ROTATE - a thick solid line. The center of the general price rotation. The price makes wide cyclical movements around the
MT4 Version Williams Vix Fix MT5 Need help trying to time the bottoms in the market? Williams Vix Fix MT5 is based on the volatility of the market and grants a huge support for finding out when a correction is comming to its end. TRY IT FOR FREE NOW! Williams Vix Fix MT5 derivates from Larry Williams's VixFix indicator addapted for fitting every asset class . VIX reprensents the fear and greed in the market based on its volatility. A high VIX value shows fear in the market, this is usually a g
** All Symbols x All Time frames scan just by pressing scanner button ** *** Contact me  to send you instruction and add you in "Harmonic Scanner group" for sharing or seeing experiences with other users. Introduction Harmonic Patterns are best used to predict turning point. Harmonic Patterns give you high win rate and high opportunities for trade in during one day. This indicator detects the best and successful patterns based on Harmonic Trading concepts . The   Harmonic Patterns   Scanner   Sc
現在、ホリデーディスカウントで399ドル! 今後値上がりする可能性があります。以下の説明をお読みください。  Ultimate Dynamic Levelsの紹介 - Ultimate Sniper DashboardのBESTエントリーインジケーター! 極めてローリスクなタイムリーエントリーと高RR!!! アルティメットスナイパーダッシュボードはこちら。 初心者はもちろん、プロのトレーダーにとっても最も重要な能力は、いつどこで相場が転換するかを正確に判断し、いかに安全に参入し、利益を得て退場するかを見極めることです。 アルティメット・ダイナミック・レベルズ・インディケーターは、相場が転換する可能性が最も高い場所を簡単に教えてくれるので、極めてローリスクなトレードを自信を持って行うことができ、同時にチャートをクリーンでシンプルに保ちながら、$$$を稼ぐことができるのです! アルティメット・ダイナミック・レベルズ・インディケーターは、複数の時間枠で重要な隠れたレベルを一度に見つけるユニークで強力なアルゴリズムを持っています。また、他の典型的なSRインジケーターのように、レ
このインジケーターは、前日、週、月の最高値と最低価格を示します。 極値のブレイクアウトを特定し、取引へのエントリーの方向を決定するように設計されています。 反転レベルをより正確に判断するには、フィボナッチ レベルを表示できます。 また、高値と安値の間のスペースにプロットして、前の請求期間中の価格の動きをより明確に示すこともできます。 現在のローソク足(バー)が閉じるまでの時間を示します。 バージョン 2.0 では、ジグザグ反転信号の 3 つの新しいレベルが追加され、各レベルのアラームが提供されます。 This indicator shows the highest and lowest prices of the previous day, week and month. It is designed to identify extreme breakouts and determine the direction of entry into a trade. To more accurately determine reversal levels, you can view F
The indicator determines a special pattern of Joe Dinapoli. It gives very high probability buy and sell signals. Indicator does not repaint. Indicator Usage Buy Signal ''B'' Entry : Market buy order at signal bar close Stop : Low of signal bar Take Profit : First swing high Sell Signal ''S'' Entry : Market sell order at signal bar close Stop : High of signal bar Take Profit : First swing low Indicator Parameters Fast EMA : External Parameter (should be kept as default) Slow EMA: External Param
[ MT4 Version ]  [ Kill Zones ]  [ SMT Divergences ] How to trade using Order Blocks:  Click here User Interface Performance:  During testing in the strategy tester, the UI may experience lag. Rest assured, this issue is specific to the testing environment and does not affect the indicator's performance in live trading. Elevate your trading strategy with the  Order Blocks ICT Multi TF  indicator, a cutting-edge tool designed to enhance your trading decisions through advanced order block analysis
Indicador Para Opções Binarias. Indicator for Binary Options Usa dois gales. Instalar em mt5 Esse indicador é para ser usado no tempo de vela de 5 minutos e em M5. Este também funciona em M1, porém é mais eficiente em M5. Só descompactar e copiar os arquivos na pasta de dados do seu MT5. Arquivos indicator na pasta MQL5 - Indicator. Baixe também a Media Movel totalmente gratis: https://www.mql5.com/pt/market/product/50400 Esse Indicador é para a próxima vela. Apareceu a seta, só aguardar a pr
To get access to MT4 version please click here . - This is the exact conversion from TradingView: "Twin Range Filter" by " colinmck ". - This is a light-load processing and non-repaint indicator. - All input options are available.  - Buffers are available for processing in EAs. - You can message in private chat for further changes you need. Thanks for downloading
The indicator is the advanced form of the MetaTrader 4 standard Fibonacci tool. It is unique and very reasonable for serious Fibonacci traders. Key Features Drawing of Fibonacci retracement and expansion levels in a few seconds by using hotkeys. Auto adjusting of retracement levels once the market makes new highs/lows. Ability to edit/remove any retracement & expansion levels on chart. Auto snap to exact high and low of bars while plotting on chart. Getting very clear charts even though many ret
MT5インジケーター「トラフィックシグナル」は、RSI、ストキャスティクス、CCI、トレンドの水準を分析する特別な戦略に基づいて、すべての時間枠で最も正確なエントリーシグナルを得るための特別な戦略に基づいて動作します。トラフィックシグナルは、成功した取引の世界への入り口です!精度と専門知識で設計されたこの革新的なインジケーターは、先進的なテクニカルインジケーターであるRSI、ストキャスティクス、CCI、トレンドを全時間枠で活用し、前例のない自信を持って市場をナビゲートするための最も正確なエントリーシグナルを提供します。 トラフィックシグナルを使用することで、収益性の高い取引機会を検出するために精密に調整された重要なテクニカル指標の包括的な分析にアクセスできます。不確実性を払拭し、情報を基にした意思決定の新たな時代を迎えましょう。RSI、ストキャスティクス、CCI、トレンドの潜在能力を引き出すトラフィックシグナルは、これまでにない市場のダイナミクスを鮮明に描写します。 トラフィックシグナルを使って、市場のトレンドとパターンを容易に把握できます。短期的なエネルギーサージまたは長期的な戦略的
このプロダクトを購入した人は以下も購入しています
最初のパルスレベルを反転 (RFI)     指示する     ロシア     -        utilizar con   el indicador の ESP 推奨事項 -   TPSpro トレンド プロフェッショナル版 -   MT5のバージョン 最も重要なことは、将来においても最も重要なことです。 機能のプリンシパル: ゾーンのほとんどは、ベンダーとコンプラドールによってアクティブ化されます。 状況を直感的に把握できるよう、初期の衝動を修正します。 LOGIC AI: MUESTRA zonas (círculos) parabuscar puntos de entrada cuando se activa una plantilla 視覚的に優れた視覚効果があり、最も重要な機能がすべて揃っていることに注意してください。 優れたニベレス/ゾーンの視覚化 (modo MTF) 世界で最も人気のある場所/ゾーンです。これを使用するのに最適な方法です (   TPSproTREND PRO   )。 アルゴリズム プロフェッショナル セパラド パソ ア パソ パラ オペラ それは
TPSpro TREND PRO は 、市場を自動的に分析し、トレンドとその各変化に関する情報を提供し、再描画せずに取引にエントリーするためのシグナルを提供するトレンド指標です。 インジケーターは各ローソク足を使用し、個別に分析します。上向きまたは下向きのさまざまな衝撃を指します。通貨、仮想通貨、金属、株、指数の取引への正確なエントリーポイント! バージョンMT5                   インジケーターの完全な説明     RFI LEVELS インジケーター と併用することをお勧めします。 主な機能: レンダリングなしで正確な入力信号! シグナルが表示されると、それは関連性を維持します。これは、シグナルを提供してからそれを変更し、その結果、入金された資金が失われる可能性があるリドローインジケーターとの重要な違いです。より高い確率と精度で市場に参入できるようになりました。矢印が表示された後、ターゲットに到達する (利益確定) か反転シグナルが表示されるまで、ローソク足に色を付ける機能もあります。 STOP-LOSS/TAKE-PROFITゾーンの表示 エントリーポイン
まず第一に、この取引インジケーターは再描画されず、再描画されず、遅延しないことを強調する価値があります。これにより、手動取引とロボット取引の両方に理想的なものになります。 ユーザーマニュアル:設定、入力、戦略。 アトミックアナリストは、価格の強さとモメンタムを利用して市場でより良いエッジを見つけるためのPA価格アクションインジケーターです。ノイズや誤ったシグナルを除去し、取引ポテンシャルを高めるための高度なフィルターを備えています。複雑なインジケーターの複数のレイヤーを使用して、アトミックアナリストはチャートをスキャンし、複雑な数学的計算をシンプルなシグナルと色に変換します。これにより、どのような初心者トレーダーでも理解して使用し、一貫した取引の決定を行うことができます。 「アトミックアナリスト」は、新規および経験豊富なトレーダー向けにカスタマイズされた包括的な取引ソリューションです。プレミアムインジケーターとトップノッチの機能を1つの取引戦略に組み合わせ、すべてのタイプのトレーダーにとって汎用性のある選択肢にします。 デイリートレーディングとスキャルピング戦略:高速で正確な
Atbot
Zaha Feiz
4.97 (30)
AtBot: どのように機能し、どのように使用するか ### どのように機能するか MT5プラットフォーム用の「AtBot」インジケーターは、テクニカル分析ツールの組み合わせを使用して売買シグナルを生成します。単純移動平均(SMA)、指数移動平均(EMA)、および平均真実範囲(ATR)インデックスを統合して取引機会を特定します。さらに、Heikin Ashiキャンドルを使用してシグナルの精度を向上させることもできます。 購入後にレビューを残すと、特別なボーナスギフトを受け取ります。 ### 主な機能: - 再描画なし: シグナルはプロット後に変更されません。 - 再描画なし: シグナルは一貫しており、変更されません。 - 遅延なし: 遅延なくタイムリーなシグナルを提供します。 - 多様な時間枠: あらゆる時間枠で使用可能で、取引戦略に合わせることができます。 ### 操作手順: #### 入力と設定: - firstkey (TrendValue): トレンド検出の感度を調整します。 - Secondkey (SignalValue): 売買シグナル生成の感度を定義します。 - ma
まず第一に、このトレーディングシステムがノンリペイント、ノンリドロー、ノンラグのインジケーターであることを強調する価値がある。これにより、手動取引とロボット取引の両方に理想的なものになっています。 オンラインコース、マニュアル、プリセットのダウンロード。 「スマートトレンドトレーディングシステム MT5」は、新規および経験豊富なトレーダー向けにカスタマイズされた包括的なトレーディングソリューションです。10以上のプレミアムインジケーターを組み合わせ、7つ以上の堅実なトレーディング戦略を備えており、多様な市場状況に対応する多目的な選択肢となっています。 トレンドフォロー戦略:トレンドを効果的に乗り越えるための正確なエントリーとストップロス管理を提供します。 リバーサル戦略:潜在的なトレンドの反転を特定し、トレーダーがレンジ相場を活用できるようにします。 スキャルピング戦略:高速で正確なデイトレードおよび短期取引のために設計されています。 安定性:すべてのインジケーターはノンリペイント、ノンリドロー、ノンラグであり、信頼性の高いシグナルを保証します。 カスタマイズ:個々の取引の嗜好に合わせ
Gold Stuff mt5
Vasiliy Strukov
4.92 (161)
Gold Stuff mt5 は、金専用に設計されたトレンド指標であり、あらゆる金融商品にも使用できます。 インジケーターは再描画せず、遅れません。 推奨時間枠 H1. 設定と個人的なボーナスを得るために、購入後すぐに私に連絡してください!  トレンド スキャナーの強力なサポートを利用して、無料のインジケーターを入手し、プライバシーを守ります。あーみー!   設定 矢印を描く - オンオフ。 チャートに矢印を描く。 アラート - 可聴アラートのオンオフ。 メール通知 - オンオフ。 電子メール通知。 プチ通知 - オンオフ。 プッシュ通知。 次に、色域を調整します。 Gold Stuff mt5 は、金専用に設計されたトレンド指標であり、あらゆる金融商品にも使用できます。 インジケーターは再描画せず、遅れません。 推奨時間枠 H1. 設定と個人的なボーナスを得るために、購入後すぐに私に連絡してください!   設定 矢印を描く - オンオフ。 チャートに矢印を描く。 アラート - 可聴アラートのオンオフ。 メール通知 - オンオフ。 電子メール通知。 プチ通
トレンド スクリーナー インジケーターでトレンド取引の力を解き放ちます。ファジー ロジックと複数通貨システムを活用した究極のトレンド取引ソリューションです。 ファジー ロジックを活用した革新的なトレンド インジケーターである Trend Screener を使用して、トレンド取引を向上させます。 これは、13 を超えるプレミアム ツールと機能、および 3 つの取引戦略を組み合わせた強力なトレンド追跡インジケーターであり、Metatrader をトレンド アナライザーにする多用途の選択肢となります。 期間限定オファー : トレンド スクリーナー インジケーターは、わずか 100 ドルで生涯ご利用いただけます。 (元の価格 50$ ) (オファー延長) Trend Screener の 100% 非再描画精度の揺るぎない精度を体験して、取引の決定が過去の価格変動の影響を受けないようにしてください。 マルチタイムフレームおよびマルチ通貨機能の多用途性を解放し、比類のない自信を持って外国為替、商品、暗号通貨、インデックスの世界を取引できるようにします。 Trend Screener の包括的な
Quantum Trend Sniper
Bogdan Ion Puscasu
4.79 (48)
ご紹介   クォンタム トレンド スナイパー インジケーターは 、トレンド反転を特定して取引する方法を変革する画期的な MQL5 インジケーターです。 13年以上の取引経験を持つ経験豊富なトレーダーのチームによって開発されました。     クォンタムトレンドスナイパーインジケーター   は、非常に高い精度でトレンドの反転を識別する革新的な方法で、あなたのトレーディングの旅を新たな高みに押し上げるように設計されています。 ***Quantum Trend Sniper Indicatorを購入すると、Quantum Breakout Indicatorを無料で入手できます!*** クォンタム ブレイクアウト インジケーターは、トレンドの反転を特定するとアラートを発し、矢印を示し、3 つのテイクプロフィットレベルを提案します。 初心者トレーダーにもプロのトレーダーにも適しています。 量子EAチャネル:       ここをクリック MT4のバージョン:       ここをクリック 推奨事項: 期間:すべての時間枠。最良の結果を得るには、M
これはMT5のインジケーターで、再描画なしで取引に参入するための正確なシグナルを提供します。 外国為替、暗号通貨、金属、株式、インデックスなど、あらゆる金融資産に適用できます。かなり正確な見積もりを提供し、取引を開始して終了するのに最適な時期を教えてくれます。1つのシグナルを処理しただけでインジケーターの元が取れた例の 動画 (6:22)をご覧ください。Entry PointsPro インジケーターの助けを借りたほとんどのトレーダーの最初の1週間の結果が改善しています。 Telegramグループ に登録してください。Entry Points Proインジケーターのメリットは次の通りです。 再描画のないエントリーシグナル 再描画されるインジケーターでは一度表示されたシグナルが削除されて大きな金銭的損失につながることがありますが、これと異なり、表示されて確認されたシグナルは消えることがありません。 エラーなしの取引開始 インジケーターアルゴリズムによって取引を開始する(資産を売買する)理想的な瞬間を見つけることができます。それを使用するすべてのトレーダーの成功率が向上します。
mql5と Telegramの モーニング・ブリーフィングで、詳細とスクリーンショットを含む毎日のマーケット・アップデートをご覧 ください! FX Power MT5 NGは 、長年の人気を誇る通貨強度計FX Powerの次世代モデルです。 この次世代ストレングスメーターは何を提供するのでしょうか?初代FXパワーの魅力すべて プラス GOLD/XAUの強さ分析 より正確な計算結果 個別に設定可能な分析期間 カスタマイズ可能な計算上限値により、さらに優れたパフォーマンスを実現 もっと見たい人のための特別なマルチインスタンス設定 すべてのチャートでお好みの色を無限に設定可能 数え切れないほどの通知オプションにより、重要なことを見逃すことはありません。 Windows 11とmacOSのスタイルで角を丸くした新しいデザイン 魔法のように動くインジケーターパネル FXパワーの主な機能 すべての主要通貨の強さの完全な履歴 すべての時間枠における通貨の強さの履歴 すべてのブローカーとチャートで同一の計算結果 100%信頼できるリアルタイム計算 -> リペイントなし ドロップダウン・リストから
まず第一に、この取引ツールはノンリペイント、ノンリドロー、ノンラグの指標であり、プロの取引に理想的ですことを強調する価値があります。 オンラインコース、ユーザーマニュアル、デモ。 スマートプライスアクションコンセプトインジケーターは、新米から経験豊富なトレーダーまで、非常 に強力なツールです。Inner Circle Trader AnalysisやSmart Money Concepts Trading Strategiesなど、20以上の有用な指標を1つに組み合わせています。このインジケーターはスマートマネーコンセプトに焦点を当て、大手機関の取引方法を提供し、彼らの動きを予測するのに役立ちます。 特に、流動性分析に優れており、機関がどのように取引しているかを理解しやすくしています。市場のトレンドを予測し、価格の動きを慎重に分析するのに優れています。機関の戦略とトレードを合わせることで、市場の動向についてより正確な予測ができます。このインジケーターは多目的であり、市場構造を分析し、重要な注文ブロックを特定し、さまざまなパターンを認識するのに優れています。 このインジ
現在33%オフ 初心者にもエキスパートトレーダーにも最適なソリューション このインジケーターは独自の機能と新しい公式を多数内蔵しており、ユニークで高品質かつ手頃な取引ツールです。このアップデートでは、2つの時間枠ゾーンを表示できるようになります。より長いTFだけでなく、チャートTFとより長いTF(ネストゾーンを表示)の両方を表示できます。すべてのSupply Demandトレーダーの皆さんのお気に召すはずです。:) 重要情報の公開 Advanced Supply Demandの可能性を最大化するには、 https://www.mql5.com/ja/blogs/post/720245 にアクセスしてください。   エントリーまたはターゲットの正確なトリガーポイントを正確に特定できれば取引がどのように改善されるか想像してみてください。新しい基盤となるアルゴリズムに基づいて構築されているため、買い手と売り手の間の潜在的な不均衡をさらに簡単に特定できます。これは、最も強い需要と供給のゾーンと、過去のパフォーマンス(古いゾーンを表示)がグラフィカルに表現されるためです。これらの機能は、最適
IX Powerは 、FX Powerの無敵の精度をついにFX以外のシンボルにも提供します。 お気に入りの指数、株式、コモディティ、ETF、さらには暗号通貨の短期、中期、長期のトレンドの強さを正確に判断します。 お使いの端末が提供する すべてを分析する ことができます。ぜひお試しいただき、取引 タイミングが大幅に改善 されることをご体験ください。 IXパワーの主な特徴 100%正確で再描画されない計算結果 - ターミナルで利用可能なすべての取引シンボルに対して 予め設定され、さらに個別に設定可能な強度分析期間のドロップダウン選択 Eメール、メッセージ、モバイル通知による無数の通知オプション EAリクエストのためのアクセス可能なバッファ カスタマイズ可能な計算制限により、さらに優れたパフォーマンスを実現 もっと見たい人のための特別なマルチインスタンス設定 すべてのチャートでお好みの色を無限に設定可能 Windows 11とmacOSのスタイルで角を丸くした新しいパネルデザイン サブ・ウィンドウとメイン・チャートの間をシームレスに移動する、魔法のように動くイン
Was: $249  Now: $99   Market Profile defines a number of day types that can help the trader to determine market behaviour. A key feature is the Value Area, representing the range of price action where 70% of trading took place. Understanding the Value Area can give traders valuable insight into market direction and establish the higher odds trade. It is an excellent addition to any system you may be using. Inspired by Jim Dalton’s book “Mind Over Markets”, this indicator is designed to suit the
MetaForecast M5
Vahidreza Heidar Gholami
5 (2)
MetaForecastは、価格データのハーモニクスに基づいて、どんな市場の未来を予測し視覚化します。市場が常に予測可能ではありませんが、価格にパターンがある場合、MetaForecastは可能な限り正確な未来を予測できます。他の類似製品と比較して、MetaForecastは市場のトレンドを分析することでより正確な結果を生成することができます。 入力パラメータ Past size (過去のサイズ) MetaForecastが将来の予測を生成するために使用するバーの数を指定します。モデルは選択したバー上に描かれた黄色の線で表されます。 Future size (将来のサイズ) 予測すべき将来のバーの数を指定します。予測された将来は、ピンクの線で表示され、その上に青い回帰線が描かれます。 Degree (程度) この入力は、MetaForecastが市場で行う分析のレベルを決定します。 Degree 説明  0 Degree 0の場合、価格の全てのピークや谷、そして詳細をカバーするために、「Past size」の入力に大きな値を使用することが推奨されています。  1 (推奨) Degr
Auto Order Block with break of structure based on ICT and Smart Money Concepts (SMC) Futures Break of Structure ( BoS )             Order block ( OB )            Higher time frame Order block / Point of Interest ( POI )    shown on current chart           Fair value Gap ( FVG ) / Imbalance   -  MTF      ( Multi Time Frame )    HH/LL/HL/LH  -  MTF      ( Multi Time Frame )  Choch  MTF      ( Multi Time Frame )  Volume Imbalance     ,  MTF          vIMB Gap’s Power of 3 Equal High
発見が困難で頻度が少ないため、分岐は最も信頼できる取引シナリオの1つです。このインジケーターは、お気に入りのオシレーターを使用して、通常の隠れた分岐点を自動的に見つけてスキャンします。 [ インストールガイド | 更新ガイド | トラブルシューティング | よくある質問 | すべての製品 ] 取引が簡単 通常の隠れた発散を見つけます 多くのよく知られている発振器をサポート ブレイクアウトに基づいて取引シグナルを実装します 適切なストップロスおよび利益レベルを表示します 設定可能なオシレーターパラメーター カスタマイズ可能な色とサイズ バー単位でサイズ別に分岐をフィルタリング パフォーマンス統計を実装します 電子メール/音声/視覚アラートを実装します 幅広い市場の見通しを提供するために、異なるオシレーターを使用して、干渉なしで同じチャートにインジケーターを何度もロードできます。このインジケーターは、次のオシレーターをサポートしています。 RSI CCI MACD オスマ 確率的 勢い 素晴らしい発振器 加速器発振器 ウィリアムズパーセントレンジ 相対活力指数 特に外国為替市
** All Symbols x All Timeframes scan just by pressing scanner button ** *** Contact me  to send you instruction and add you in "123 scanner group" for sharing or seeing experiences with other users. After 17 years of experience in the markets and programming, Winner indicator is ready. I would like to share with you! Introduction The 123 Pattern Scanner indicator with a special enhanced algorithm is a very repetitive common pattern finder with a high success rate . Interestingly, this Winner in
FX Volume MT5
Daniel Stein
4.93 (14)
mql5と Telegramの モーニング・ブリーフィングで、詳細とスクリーンショットを含む毎日のマーケット・アップデートをご覧 ください! FX Volumeは、ブローカーの視点から市場のセンチメントをリアルに洞察する、最初で唯一の出来高インジケーターです。 ブローカーのような機関投資家が外国為替市場でどのようなポジションをとっているか、COTレポートよりもはるかに速く、素晴らしい洞察を提供します。 この情報をチャート上で直接見ることは、あなたの取引にとって真のゲームチェンジャーであり、画期的なソリューションです。 以下のようなユニークなマーケットデータ洞察から利益を得てください。 比率は 、通貨のロングポジションとショートポジションの比率をパーセントで表示します。 比率の変化は 、選択した期間内のロング比率とその変化率を表示します。 Volumes Totalは 、通貨の取引量(ロングとショート)の合計をロット単位で表示します。 Volumes Long :全通貨のロングポジションの取引量を表示します。 Volumes(ショート )は、全通貨のショートポジションの取引量を表示
Easy By Sell is a market indicator for opening and closing positions. It becomes easy to track market entries with alerts. It indicates trend reversal points when a price reaches extreme values ​​and the most favorable time to enter the market. it is as effective as a Fibonacci to find a level but it uses different tools such as an algorithm based on ATR indicators and Stochastic Oscillator. You can modify these two parameters as you wish to adapt the settings to the desired period. My othe
ブレーカートレーダーになり、価格が反転すると市場構造からの利益が変化します。 注文ブロックブレーカーインジケーターは、トレンドまたは価格の動きが枯渇に近づいており、逆転の準備ができていることを識別します。通常、反転または大規模なプルバックが発生しようとしているときに発生する市場構造の変化について警告します。 この指標は、ブレイクアウトと価格の勢いを識別する独自の計算を使用します。使い果たされる可能性のあるポイントの近くで新しい高値が形成されるたびに、インディケーターはその高値の作成を担当する最後の注文ブロックを描きます。次に、移動する価格とともに注文ブロックを追跡します。その後、価格が反対方向にシフトし、その注文ブロックを突破すると、新しい市場構造を作成し、トレンドまたは大きな後退の可能性のある反転の開始を警告します。 注文ブロックは、高値/安値が作成される前の最後の反対色のろうそくであり、価格がこれらの重要な領域を下抜けすると、トレンドの短期的ま​​たは長期的な反転の兆候です。 特徴 重要な枯渇点での市場構造の変化を警告します 価格が使い果たされるレベルに近づくと、
How to use Pair Trading Station Pair Trading Station is recommended for H1 time frame and you can use it for any currency pairs. To generate buy and sell signal, follow few steps below to apply Pair Trading Station to your MetaTrader terminal. When you load Pair Trading Station on your chart, Pair Trading station will assess available historical data in your MetaTrader platforms for each currency pair. On your chart, the amount of historical data available will be displayed for each currency pai
ICT, SMC, SMART MONEY CONCEPTS, SMART MONEY, Smart Money Concept, Support and Resistance, Trend Analysis, Price Action, Market Structure, Order Blocks, BOS/CHoCH,   Breaker Blocks ,  Momentum Shift,   Supply&Demand Zone/Order Blocks , Strong Imbalance,   HH/LL/HL/LH,    Fair Value Gap, FVG,  Premium  &   Discount   Zones, Fibonacci Retracement, OTE, Buy Side Liquidity, Sell Side Liquidity, BSL/SSL Taken, Equal Highs & Lows, MTF Dashboard, Multiple Time Frame, BigBar, HTF OB, HTF Market Structure
Trend Hunter は、外国為替、仮想通貨、CFD 市場におけるトレンド指標です。 このインジケーターの特別な特徴は、価格がトレンドラインをわずかに突き抜けたときにシグナルを変更することなく、自信を持ってトレンドに従うことです。 インジケーターは再描画されず、バーが閉じた後に市場に参入するシグナルが表示されます。 トレンドに沿って移動すると、インジケーターにはトレンドの方向に追加のエントリーポイントが表示されます。 これらのシグナルに基づいて、小さなストップロスで取引できます。 トレンドハンターは正直な指標です。 インジケーター信号の上にマウスを置くと、信号の潜在的な利益と可能なストップが表示されます。 新しい信号が表示されると、次の通知を受け取ることができます。 アラート プッシュ通知 メールによる通知 電報での通知 チャートのスクリーンショットも Telegram に送信されるため、取引を決定するために端末を開く必要はありません。 インジケーターシグナルは、電報チャネル https://www.mql5.com/ja/market/product/11085
このダッシュボードは、選択されたシンボルの最新の利用可能なハーモニックパターンを表示するので、時間を節約し、より効率的に /   MT4バージョン 。 無料インジケーター:   Basic Harmonic Pattern インジケーター列 Symbol : 選択したシンボルが表示されます。 Trend :   強気または弱気 Pattern : パターンの種類(ガートレー、バタフライ、バット、カニ、サメ、サイファー、ABCD) Entry : エントリー価格 SL: ストップロス価格 TP1: 1回目の利食い価格 TP2: 2回目の利食い価格 TP3:   3回目の利食い価格 Current price :   現在値 Age (in bars):    最後に描画されたパターンの年齢 主な入力項目 Symbols:   "28 Major Currency Pairs "または "Selected Symbols "から選択。 Selected Symbols:   カンマで区切られた監視したいシンボル("EURUSD,GBPUSD,XAUUSD")。ブローカーが
このインディケータは、価格アクション分析とドンチャンチャネルのみを使用して、ジグザグ方式で価格の反転を検出します。再描画やバックペインティングを一切行わずに、短期取引向けに特別に設計されています。それは彼らの操作のタイミングを増やすことを目指している賢明なトレーダーにとって素晴らしいツールです。 [ インストールガイド | 更新ガイド | トラブルシューティング | よくある質問 | すべての製品 ] 驚くほど簡単に取引できます すべての時間枠で価値を提供します 自己分析統計を実装します 電子メール/音声/視覚アラートを実装します 可変長のブレイクアウトと混雑ゾーンに基づいて、インディケータは価格アクションのみを使用して取引を選択し、市場が非常に高速に行っていることに反応します。 過去のシグナルの潜在的な利益が表示されます この指標は、独自の品質とパフォーマンスを分析します 負けブレイクアウトは強調表示され、説明されます インジケータは、非バックペインティングおよび非再ペイントです この指標は、日中のトレーダーが単一の価格反転を見逃さないようにするのに役立ちます。ただし、す
Gold TMAF MTF - これは最高の株式テクニカル指標です。指標のアルゴリズムは、資産の値動きを分析し、ボラティリティと潜在的なエントリーゾーンを反映しています。 最高の指標シグナル: - 売りの場合 = TMA2の赤い上限がTMA1の赤い上限の上にある場合 + 上記の赤いフラクタル指標 + 同じ方向に黄色のSRシグナル矢印。 - 買いの場合 = TMA2の青い下限線がTMA1の青い下限線より下にある場合 + 下からの青いフラクタル指標 + 同じ方向の水色のSRシグナル矢印。 このインディケータの利点 1. このインディケータは、高精度のシグナルを生成します。 2. 確定した矢印シグナルは再描画されませんが、フラクタルシグナルは半周期再描画されます。 3. どのブローカーのMetaTrader 5取引プラットフォームでも取引できます。 4. あらゆる資産(通貨、金属、暗号通貨、株式、指数など)を取引できます。 5. M30-H1タイムフレーム(中期取引)で取引するのがよい。 6. 各トレーダーがインディケータを自分用に簡単にカスタマイズできるよ
今、147ドル(いくつかの更新後に499ドルに増加します) - 無制限のアカウント(PCSまたはMac) RelicusRoad ユーザー マニュアル + トレーニング ビデオ + プライベート Discord グループへのアクセス + VIP ステータス 市場の新しい見方 RelicusRoad は、外国為替、先物、暗号通貨、株式、および指数の世界で最も強力な取引インジケーターであり、トレーダーに収益を維持するために必要なすべての情報とツールを提供します。初心者から上級者まで、すべてのトレーダーが成功するためのテクニカル分析と取引計画を提供します。これは、将来の市場を予測するのに十分な情報を提供する重要な取引指標です。意味をなさないチャート上のいくつかの異なる指標ではなく、完全な解決策を信じています.これは、信号、矢印 + 価格アクション情報を表示するオールインワンのインジケーターで、他に類を見ない非常に正確です。 強力な AI に基づいて、RelicusRoad は不足している情報とツールを提供して、あなたを教育し、トレーディングのプロ、成功したトレーダーにします。
ゴールド ATR MTF - これは優良株のテクニカル指標です。 インジケーター ATR (Average True Range) のアルゴリズムは、資産価格の動きを分析し、指定された時間枠 (D1) の始値の指定されたパーセンテージ (%) で対応するレベルを描画することでボラティリティを反映します。 シンボルの価格変動方向のインジケーター (赤および/または青 D1 H4) および矢印シグナルは、快適で収益性の高い日中取引および/またはスキャルピングのための追加的かつ不可欠な補助です。 1 日あたりの利益は、外国為替シンボルの場合は 20 ピップスから、ゴールド シンボルの場合は 50 ピップスからです。 インジケーターの機能: これは、マジック、トレンド方向検出器、および快適で収益性の高い取引のための 2 つのトレンド矢印のブロックを備えたスーパー インジケーターです。 チャート上にブロックを切り替えるための赤いボタンが表示されます。 マジックはインジケーター設定で設定されているため、異なるブロックを表示する 2 つのチャートにインジケーターをインストールできます。
Golden Spikes Detector Acknowledgement and Dedications:  The name of this indicator was Inspired by an Original; Mr Grant Koopman; a Knowledgeable and experienced Synthetics trader. I dedicate this indicator to Mr Grant.  Overview: The Golden Spikes Premium is a groundbreaking trading indicator meticulously crafted for the Boom and Crash indices on the Deriv market. Tailored to meet the needs of discerning traders, this powerful tool operates exclusively on the one-minute timeframe, providin
作者のその他のプロダクト
Close All and Change Take Profit and Stop Loss All Orders. Main Features     Ability to Close All Orders the Symbol you put this EA.     Ability to Change Take Profit to All Order.     Ability to Change Stop Loss to All Order.     Show Order count.     Show Average price with info and Horizontal Line.     Show lot open.     Show Price diff from average to price now     Show broken price with info and Horizontal Line.     Easy to use . How to use Close All (Symbol) PC : you can click on Clos
Asa Manual Grid Buy Sell with UI is made for Grid trading when orders are placed above and below a set price, creating a grid of orders at incrementally increasing and decreasing prices. Main Features Ability to set buy grid with 3 maximum orders. (200 in full version) Ability to set sell grid with 3 maximum orders. (200 in full version) Easy to use with simple interface. Have 2 mode of Take Profit and 1 for Stop Loss. Real time information for the current open positions and calculate a
FREE
Asa Manual Grid Buy Sell with UI is made for Grid trading when orders are placed above and below a set price, creating a grid of orders at incrementally increasing and decreasing prices. Main Features Ability to set buy grid with 200 maximum orders. Ability to set sell grid with 200 maximum orders. Easy to use with simple interface. Have 2 mode of Take Profit and 1 for Stop Loss. Real time information for the current open positions and calculate average sum of order price. How to use S
The reason why many traders new to using the Fibonacci retracement tool find it hard to effectively use it is because they are having trouble identifying swing points that are significant enough to be considered. Main Features Show Fibonacci number with LL to HH in multitimeframe Show 23.6,38.2,50,61.8,78.6,88.6,100,112.8,127.2,141.4,161.8,200,224,261.8,314,361.8 and 423 of Fibonacci number Easy to use with simple interface. Real time information for the Fibonacci number . Settings Global
Asa Line Alert is support horizontal line and trend line when the price touch some horizontal or trend line in the graph they will alert you with Line Notify Application. Main Features Ability to check and alert horizontal line Ability to check and alert trend line. Easy to use . How to use STEP 1 : Make Group for Alert Create group LINE in your LINE Application STEP 2 : Create Token for Line Notify Go to https://notify-bot.line.me/ login and create a token STEP 3 : Invite Line No
Close All and Change Take Profit and Stop Loss All Orders. Main Features     Ability to Close All Orders the Symbol you put this EA.     Ability to Close All Orders in your account.     2 Mode for Close all (1-Close one by one, 2-Hedge then Close with Close by)     Ability to Change Take Profit to All Order.     Ability to Change Stop Loss to All Order.     Show Order count.     Show Average price with info and Horizontal Line.     Show lot open and maximum lots to open.     Show Price diff f
1 of 10 for 69$ . Next Price is 89$ SMC Unmitigated Finding is a indicator for find unmitigated supply and demand in previous legs of price Settings Zigzag Settings ZZDepth - by Default is 12. ZZDeviation - by Default is 5. ZZBackStep - by Default is 3. Rectangle Settings SupportColor-  color for Support line.  ResistanceColor  -  color for Resistance line. Settings Num of Show -  Number of Support & Resistance Show.
Asa Line Alert will alert your orders to Line Notify Application. Main Features Alert every orders in real time. Alert deposit and withdrawal. Easy to use . How to use STEP 1 : Make Group for Alert Create group LINE in your LINE Application STEP 2 : Create Token for Line Notify Go to https://notify-bot.line.me/ login and create a token STEP 3 : Invite Line Notify into your Group chat Add Line Notify as your friend and invite him in your group chat you want to alert STEP 4 : Put
SMC Unmitigated Finding is a indicator for find unmitigated supply and demand in previous legs of price Settings Zigzag Settings ZZDepth - by Default is 12. ZZDeviation - by Default is 5. ZZBackStep - by Default is 3. Horizontal Line Settings SupportColor-  color for Support line.  ResistanceColor  -  color for Resistance line. Settings Num of Show -  Number of Support & Resistance Show.
フィルタ:
レビューなし
レビューに返信
バージョン 1.4 2024.09.09
1.4
- Add more scale.
バージョン 1.3 2024.09.09
1.3
- Add Panel : Change scale in real-time.
バージョン 1.2 2024.09.09
1.2
- Add Scale
バージョン 1.1 2024.09.08
1.1
- Fixed Bugs.