Serial Signal Indicator MT5
- インディケータ
- Vitalyi Belyh
- バージョン: 1.0
- アクティベーション: 7
Indicator for manual trading and technical analysis for Forex.
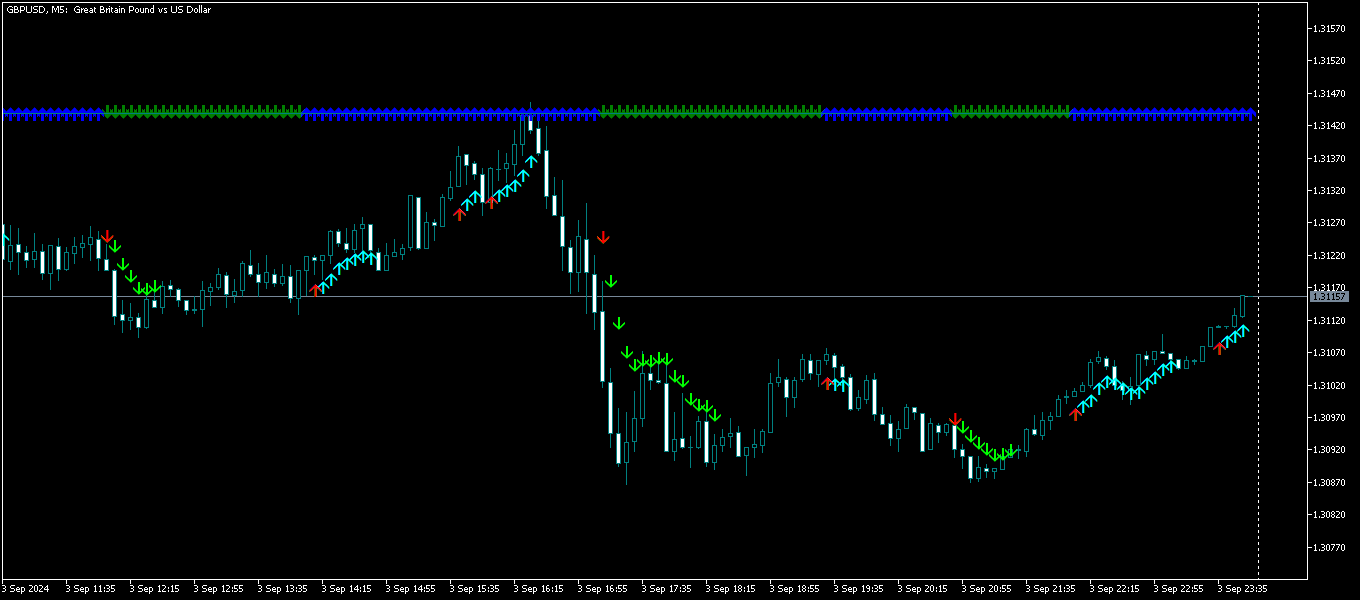
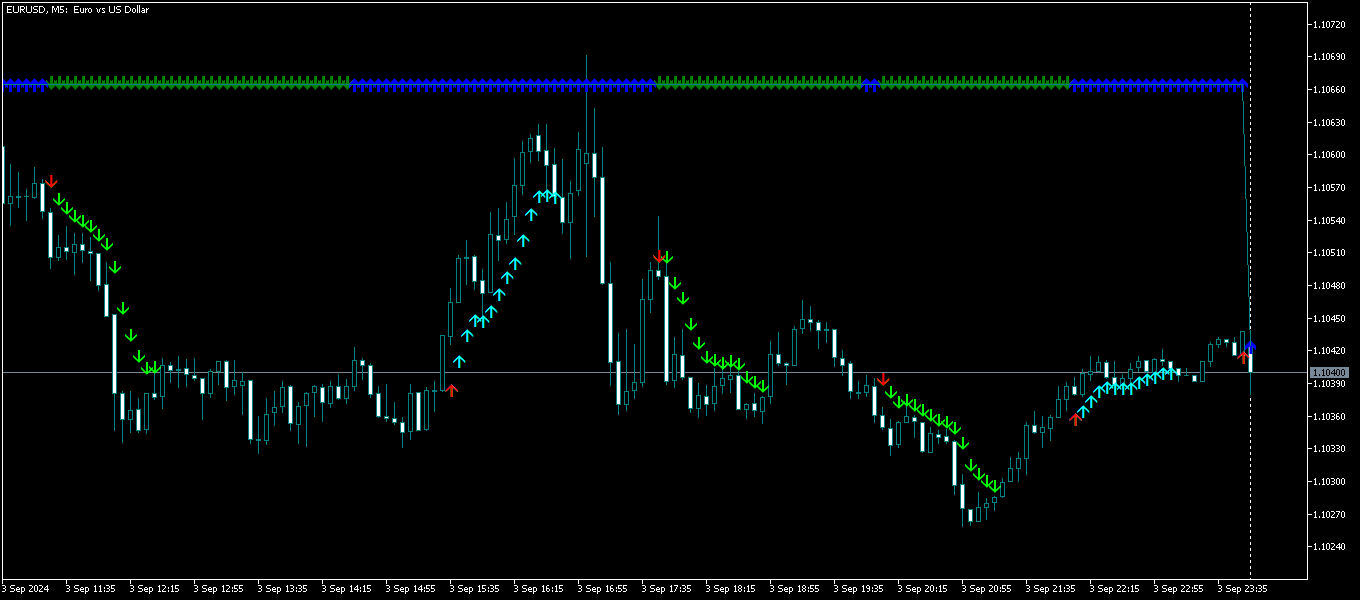
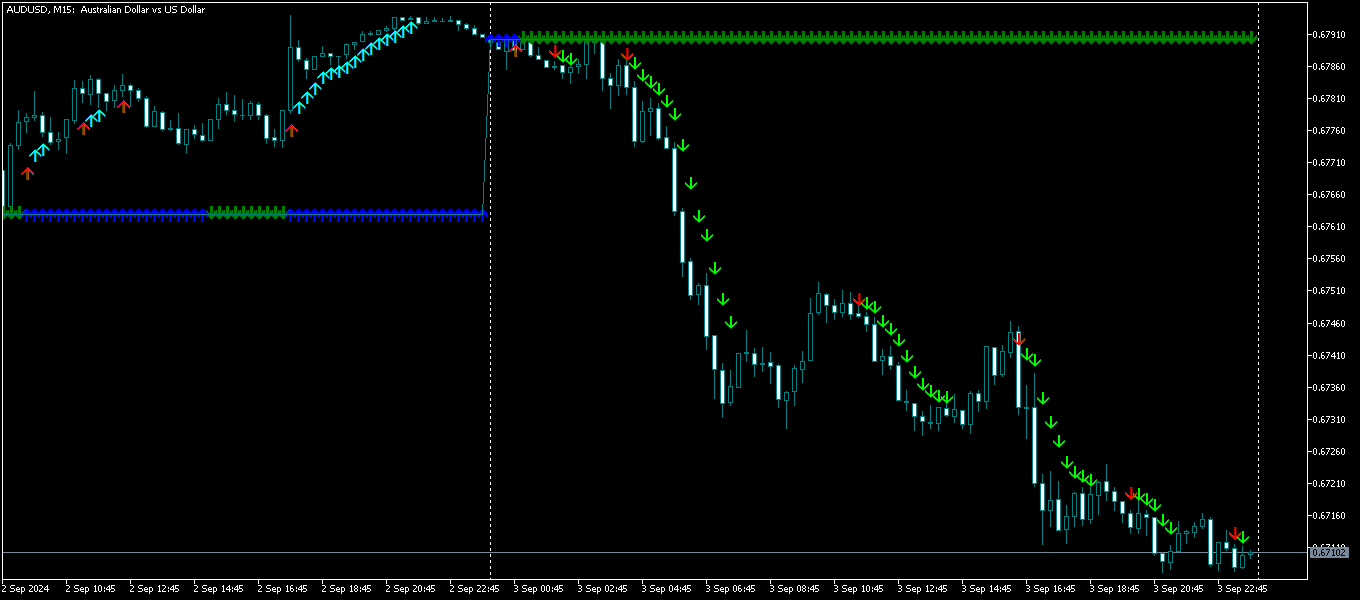
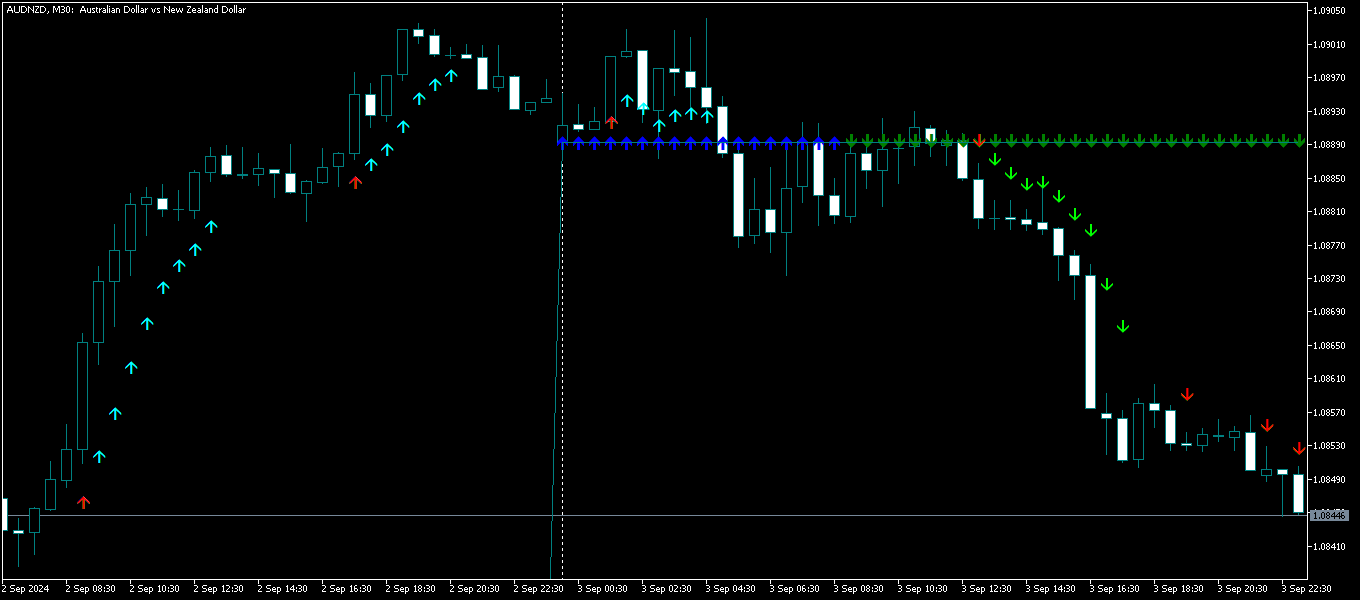
It consists of a trend indicator with the opening level of the trading day and a arrow indicator for determining entry points.
The indicator does not recolor; it works when the candle closes.
Contains several types of alerts for signal arrows.
Can be configured to work on any chart, trading instrument or time frame.
The work strategy is based on searching for price movements along the trend.
- To make "Buy" transactions: The trend line must have blue arrows. If the price is above the line, then the signal will be more confident. The first signal arrow is red, the subsequent ones are blue.
- To make “Sell” transactions: The trend line must have green arrows. If the price is below the line, then the potential signal will be more confident. The first signal arrow is red, the subsequent ones are light green.
Keep trades open for several candles.
The indicator allows you to catch rapid movements along the trend in a short period of time.
Main input parameters
Trend smoothing parameter - to adjust the trend length
Signal arrow sensitivity parameter - to adjust the speed and duration of the arrows