• 概要
  • レビュー
  • コメント

FX CyberBot MT5 Inc 8Pairs 8TF 8Shadows Indicators

Currently, the product's selling price is over $480; however, we are offering a monthly rental system for only $30. This allows many people to enjoy and experience our products during this launch stage, which will likely lead to positive reviews from users, making it more enjoyable | We hope that if there are more than 10 positive reviews, the GOOD NEWS is that the next use will last for 3 months at a fixed price of only $30 | Take advantage of our promo opportunity, before it goes back to selling price only. Cheers!

The first unique product on the MQL5 market > One file Indicator contains Dozens of Indicators + 5 Oscillators including advanced mastermind capabilities simultaneously for 8 Pairs + 8 Timeframes + 8 Shadows

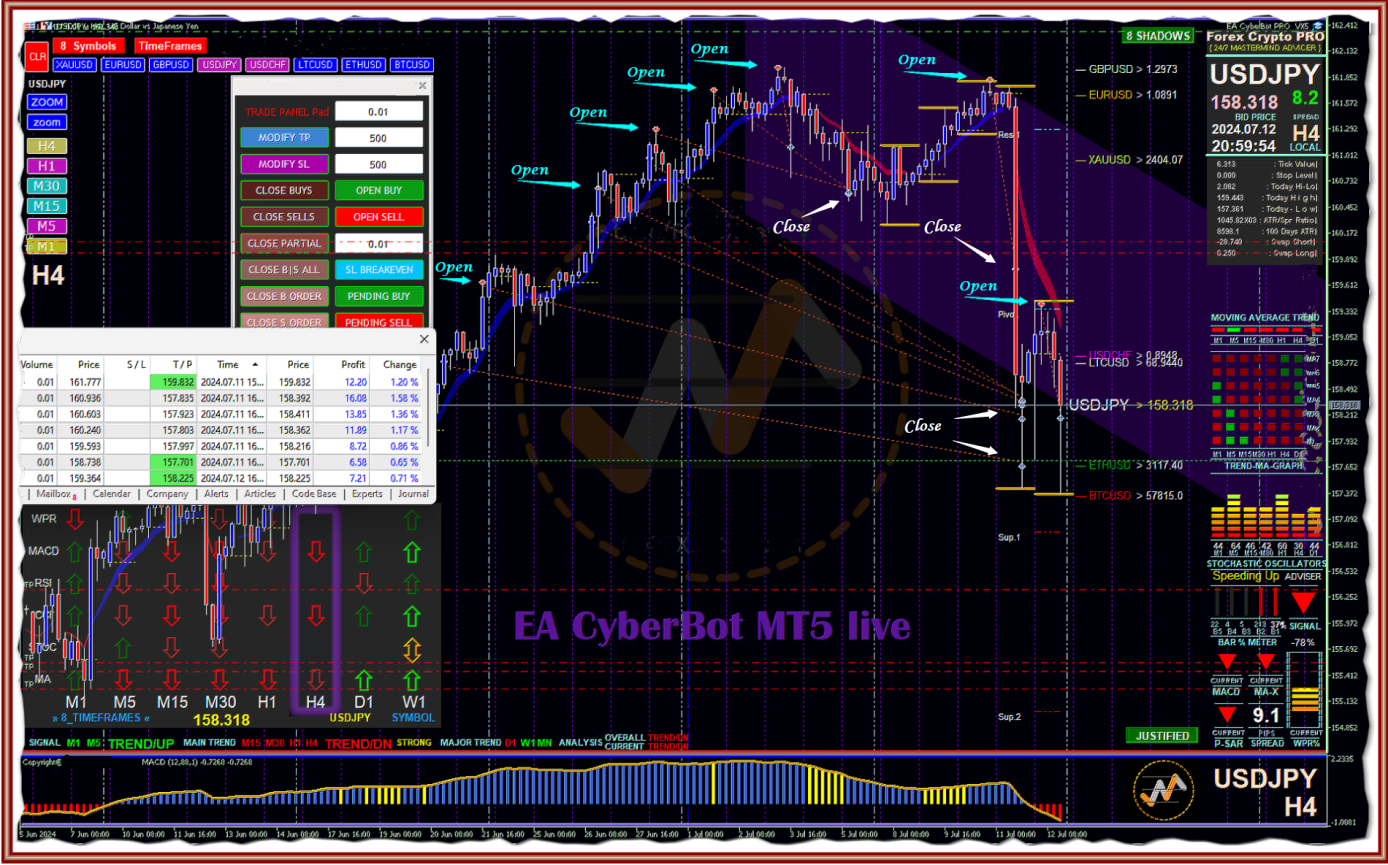
FX CyberBot MT5 inc 8 Pairs + 8 TimeFrames + 8 Shadows [Multi Indicators + 5 Ossilators | All In One File|Chart] Part of the "CYBERBOT PROJECT" platform.


☄️ The "CYBERBOT PROJECT" platform has been established for traders who operate with exceptional professionalism and expertise, characterized by the following attributes:

    • - Can detect the right momentum at the right time and place massively + effectively.
    • - Every action in their trading activities is supported by strong data and responsible analysis.
    • - Become an expert with personal skills that are continuously honed and competent in their field.
    • - Understand the general analysis of EA-robots, including the algorithms of their creators.
    • - Become an expert analyst and expert executor & can create EA-robot 2MA cross RSI.

☄️ The "CYBERBOT PROJECT" platform functions as a 100% expert mastermind in real time, 24 hours a day. Without theory, everything can be mastered visually from Beginners to Seniors in the world of derivatives business.

☄️ The advantageous aspect is that all benefits available to traders can be observed here. For those who have previously experienced disappointment or financial loss with passive EAs, we recommend considering this platform.

C
Y
B
E
R
B
O
T

P
R
O
J
E
C
T

Don't trade like a gambler, Winner's Secret is here [CyberBot Project] The platform shown is transparent and sophisticated. Even beginners can become more expert instantly in a week | Valuable and unforgettable successful experience | Professionally structured products to prepare you to become a great analyst and expert trader to achieve financial freedom success | The best choice is here ‼ 

Introducing : EA CyberBot PRO [MT4| MT5] Forex Crypto Trading with 8 Pairs, 8 Timeframes, and 8 Shadows in one chart. This is a sophisticatedly designed Expert Advisor [EA] program with “out of the box” capacity. It has created a complete platform containing Robot EA, Trade Panel Pad, and Multi-Indicators seamlessly integrated into one file. Combining these functions in one platform makes it a powerful tool for the savvy trader, serving serious trading endeavors while also acting as an educational tool to establish higher-quality trading practices. It is designed as a valuable asset that is essential for experienced traders, Introducing Brokers (IB), and futures companies as a promotional tool by embedding the brand in the product while increasing turnover and empowering clients to become more confident and actively involved in transactions independently.

Our program has proven effective in significantly enhancing skills, backed by years of research and development in consulting and education. Through intensive MQL4 and MQL5 programming, we address the fundamental needs of capital market traders. Our approach focuses on 100% practical training, eliminating tedious theory, and training the subconscious mind for reflexive proficiency. This transforms previously ambiguous perceptions into a clear, analyzable, and secure reality in business activities.

Adviser : Improve your trading efficiency and efficacy with visual guidance and live functional analysis, “What You See Is What You Get” (wysiwyg), enabling real-time trade execution with unwavering confidence and trust in every decision made. The easy-to-use nature of this tool has facilitated a quick transition to becoming a skilled analyst, empowering individual traders to operate with the finesse of a seasoned professional trader. From the analysis stage, dozens of active signals have been available for 8 pairs, 8 timeframes, and 8 shadows simultaneously, including Pivot-Resistance-Support lines that are actively involved in the chart for each pair automatically every day. The execution stage continues with the ease of quickly moving order values, stop loss, and take profit on 8 pairs at once by simply moving the line on the chart, allowing you to focus more on placing it in the desired location. For EA makers, variable setting testing and backtest functions have been provided for cross MA & RSI.

This product offers powerful functionality that meets the requirements of both junior traders and those advancing to a more expert level. Users have achieved significant skill improvements quickly; in just a week, individuals can enhance their abilities considerably. How is this possible? Rest assured, this has been proven and tested through the positive results of its users. It is very easy to operate and relies 100% on the subconscious mind's ability to process it into a reflex action at every jackpot opportunity. It can be used as a scalping strategy when reversal momentum occurs, as well as a long-term strategy when trend conditions are present. In the chapters below this description, we also present accurate scenarios and strategies to achieve the best momentum for safer and more certain trading activities. The good news is that you have found this unique complete product; we guarantee that there is no other product as powerful as this, even though the price is much higher.

C
Y
B
E
R
B
O
T

P
R
O
J
E
C
T

🐦‍🔥 Product specifications are available for both MT4 and MT5 platforms by placing them in the directories: //Indicators/FX CyberBot PRO and :://Experts/EA CyberBot PRO [Explanation is in the Video] 

    Suggestion:  The product is designed for practicality, devoid of theoretical complexities, relying solely on the subconscious mind as an observational reflex. Consequently, the brain will autonomously discern information in an intricate manner. Even beginners can yield results within a week, a fact that can be substantiated through a prototype trial demonstration. We urge you to reach out to us promptly.  Don't miss out on this super cool product that's top-notch and unique. You won't find anything like it anywhere else, even at a high price that's mostly about theory.  
    [FX Indicator PRO] Features:

    [EA CyberBot PRO] Features:

    • 8 pairs of symbols together on one screen.
    • 8 Timeframes analysis of popular indicators.
    • 8 Symbols analysis in main chart time ranges.
    • Automatic horizontal line time period background.
    • Pivot, Resistance and Support updated daily.
    • Shawl-shaped trend signals accompany the charts.
    • "Mastermind Advicer" expert in the right corner.
    • Choice of 5 Oscillators according to trader needs.   
        • Trading Panel Pad Assistant for manual trading.
        • EA Robot Trading Algorithm EMA vis-à-vis RSI
      • The EA CyberBot PRO product also includes the FX Indicator PRO [All in One File]

    • [ Oscillators ] Stochastic, CCI, RSI, MACD & Momentum. At the bottom of the screen. [MT5 only, MT4 :with “TIMING.ex4”]
    • [ Reversal Code ] Available as support for the "scalping trigger" signal section [not available on MT5 platform. MT4 only]
    • [ EA Trade Panel ] Embedded in the product simplifies operational functions for traders, it practical even for beginners
    • [ EA Robot Trading ] .. modify variables such as EMA and RSI and conduct frequent backtests to understand their impact
    • [ Telegram Alert ] Complementary "Reversal Code" to Telegram in the form of screenshots+data. [EA CyberBot MT4 only]

    Starting from the background of the main screen, it displays daily, weekly, and monthly time information via vertical lines, along with automatic calculations of Pivot, Resistance, and Support functions via horizontal lines at any time.


    On the main symbol pair chart, there is a blue/red scarf to support the trend code. Additionally, there is a function to display 8 pairs of symbols simultaneously in the time range according to the main graphic, serving for harmonized analysis of global markets.


    At the top left of the screen, there is a function for replacing with another pair than the previously registered 8 pairs of symbols. There is also a function for switching between timeframes M1, M5, M15, M30, H1, H4. These two functions can loop automatically every 18 seconds.


    At the bottom left of the screen, there is a comparison of the main symbol pairs in each timeframe against the WPR, MACD, CCI, STOCH, MA indicators to form an analysis in the form of prediction arrows and several recommendations.


    On the right of the screen, it contains a lot of information that can be used if needed to support the final results of the overall analysis to become the best recommendation.

    Highly recommended if you are experienced enough.


    🔰 Customize your needs and visit the links in the content that match the following products according to the table, as well as the choice of Metatrader4 and Metatrader5 platforms. If you are still confused about the difference between FX CyberBot PRO and EA CyberBot PRO, as well as the advantages and disadvantages of the MT4 and MT5 versions, please send a message in the comments column.

    FX CyberBot PRO [Multi-Indicators + 5Ossilators:MT5|ReversalCode:MT4]

      Platform   

    EA CyberBot PRO [Multi-Indicators + Panel Pad + Robot EA] All in One

    https://www.mql5.com/en/market/product/122576


          MT4
       

      https://www.mql5.com/en/market/product/122575

        https://www.mql5.com/en/market/product/122574


              MT5
           

          https://www.mql5.com/en/market/product/122573

          Recently, “CyberBot Project,” designed for professional traders in Indonesia, has expanded to serve the global trading community through MQL5.com.

          At the launch, we are pleased to offer a competitive discount that matches the student price. Additionally, you may download FX_TIMING.ex4 as a complimentary program for the associated products EA_CyberBot_MT4 and FX_CyberBot_MT4. Furthermore, there will be several other complimentary items available for trial training products MT4 (MetaTrader 4) and MT5 (MetaTrader 5). More detailed information regarding both paid and free development products can be found at [www.mql5.com/en/users/BATIK].

          =============================================================================================================================================================================

          🪸 HOW TO USE >>> [ Description of advanced Scalping/Swing/Trend strategy that is profitable and fits the CyberBot Project system ] >>>  ADVANCED#1  [ Important supporting signals ] >>> TRIGGER
            =============================================================================================================================================================================

              ||Watch visualizations with moving images and explanatory descriptions. ||This material is intended for a comprehensive understanding of "patterns". It also provides the best solution in cases of very strong current pressure. 

              S C
              A
              L
              P
              I
              N
              G

              The explanation is in the picture with stable and sideways up and down waves.  [on the attached image "SCALPING | SWING"]
              You have gone through the BASIC session material, hopefully by following the existing stages with great discipline. You have the opportunity to create a positive portfolio with a 95% "blue" probability. In addition to compliance in following the signal "pattern" in the BASIC session, accuracy is also required in executing IN and discipline in OUT with measurable targets at every opportunity [200 pips/TP=200]. If this is ignored, there is a risk that not only will the target not be achieved, but the amount of equity will also be eroded due to unexpected "swings" in the market.

              The SCALPING strategy in BASIC that we have created focuses on waiting for the "correction" process to occur. This is the safest position to execute trading because it is at the farthest point from the chart movement, which always has a wavy shape. The safest positions are arranged to form a "corridor" formation at the upper and lower boundaries of the wave.

              Some of you might be wondering why we don't aim for a profit of over 500 pips, especially since it seems more profitable than our target of 200 pips. From the picture above, it does look like there’s potential for greater gains. However, CYBERBOT's mission is to ensure that your trading experience is safe and healthy for your peace of mind. We don’t force ourselves to predict market direction because the market is dynamic. Instead, we assume that after a "correction," the market will often try to exceed the initial range by pushing into a broader corridor.

              To illustrate, think of the "sea" as being made up of small, medium, and large waves. Small waves can feel stable while larger waves are on the way. When the time comes, the activity of the small waves will shift to follow the direction set by the larger waves. So, there’s no need to worry. We’ve conducted measurable mapping to provide a more controlled analysis of your predictions. Here’s how it works.

              S
              W
               I
              N
              G
              M
               I D
              T
              E
              R
              M
              The explanation is in the picture with waves that rise several corridors and fall into a trend.  [on the attached image "CORRIDORS | TREND"]
              When the "pattern" [H1] of BASIC is formed, its peak boundary becomes corridor #1. In a "sideways" market condition, movement will remain within this corridor. However, caution is necessary, as the market will eventually shift towards the next corridors under strong pressure. When the next "pattern" [H1] appears, there will be opportunities for "reversal" executions with a profit target of at least 200 pips. The furthest corridor typically reaches level 4, with each level taking one week to one month to complete. [Factor "pattern" of MIDTERM & LONGTERM].


              If you reach the furthest stage, an excellent position will emerge, characterized by strong resilience that leads to a "reversal" direction followed by an extreme "trend" targeting ±1000 pips. In conclusion, the further the corridor, the stronger the resilience [X<Y<Z]. Seek this opportunity for a significant gains. [recommendation]
              L
              O N
              G
              T
              E

              R
              M
              S
              u
              p
              p
              o
              r
              t

              Note : It is important to note that certain comments may suggest that the wave image, which serves to illustrate the market, is overly idealistic and does not accurately reflect the complexities of reality. This observation holds true, particularly if one is still in the Basic (BASIC) stage. In fact, CYBERBOT, in its guidance, advises each client to refrain from being unduly influenced by the graphical representation as it appears. Nevertheless, it is essential to succeed in visualizing it as a neat and orderly wave. By doing so, you will become adept at determining the center line (balance) as the analytical reference line.

              Support : Currently, we are live streaming 24/7 search "DASHBOARD 8 Pairs/Symbols Collaborate for Real-Time Forex & Crypto Trading Signals" on  YouTube () | Twitch () | KICK () 

              Welcome : Youtube+Twitch+KICK channel members > [Suggestion: Complete the triggers we broadcast with this CyberBot Project program, to trade in a safer & more stable, tested way] 
              S
              u
              p
              p
              o
              r
              t

              💯 money back guarantee 返金保証

              all our stuff is tested and matches the video. no fake videos here! we promise u get a product like the one shown, plus there are more cool features to check out. if what u get isn’t like the video, u can get a refund!!!

              We also extend an invitation for you to become a Wise Reviewer, contributing to the enhancement of creativity on this platform. As a token of our gratitude, we will provide guidance on effectively utilizing signals from the CyberBot Project, along with exclusive tips for each customer to gain additional benefits by establishing a Telegram Bot group for your team or community.
              Rest assured, we guarantee customer satisfaction with a money-back guarantee, which is as straightforward as applying to the MQL5.com vendor as a mediator. Please submit any additional information required in each Comment column provided by MQL5 in the content of each product.We will answer as soon as possible, any questions you may have about our products that support your business.

              `````````````````````````````````````````````````````````````````````````````````````````````````````````````````````````````````````````````````````````````````````````````````````````````````

              How to use the download and settings can be understood directly through the video | Use this opportunity to be more confident and responsible in every trading decision you make rather than trusting other people's ideas that are not necessarily as good as you.

              おすすめのプロダクト
              Based on the trading model/strategy/system of gold double-position hedging and arbitrage launched by Goodtrade Brokers, problems encountered in daily operations: 1. Account B immediately places an order immediately following account A. 2: After account A places an order, account B will automatically copy the stop loss and take profit. 3: Account A closes the position of Account B and closes the position at the same time. 4: When account B closes the position, account A also closes the position.
              TPO Profile MT5
              Kyra Nickaline Watson-gordon
              Definition : TPO is a Time Price Opportunity. Instead of using bars or candles with an Open, High, Low, and Close price, each "bar" in a Market Profile is represented by horizontal bars against the price It is called Market Profile terminology. In other words time-price-opportunity (TPO) profiles are histograms of how much time was spent at each price within the span of the profile. By using a TPO chart, you are able to analyze the amount of trading activity, based on time, for each price leve
              Gioteen Volatility Index (GVI) - your ultimate solution to overcoming market unpredictability and maximizing trading opportunities. This revolutionary indicator helps you in lowering your losing trades due to choppy market movements. The GVI is designed to measure market volatility, providing you with valuable insights to identify the most favorable trading prospects. Its intuitive interface consists of a dynamic red line representing the volatility index, accompanied by blue line that indicate
              Introduction to Chart Pattern MT Chart Pattern MT is a chart pattern scanner to detect the triangle pattern, falling wedge pattern, rising wedge pattern, channel pattern and so on. Chart Pattern MT uses highly sophisticated chart pattern detection algorithm. However, we have designed it in the easy to use with intuitive user interface. Chart Pattern MT will show all the patterns in your chart in the most efficient format for your trading. You do not have to do tedious manual pattern detection an
              Ignition
              Dansie Software Limited
              Strategy Overview The Ignition EA tries to take advantage of sudden momentum when the Ignition pattern is detected. The final bar in the ignition pattern has a small opening wick, a very little or no closing wick, is large in comparison to recent bars and must start from the lower end of the current range (for a bullish ignition) Quick Testing Use Symbol EURUSD, Timeframe M2, and remove the GBPUSD symbol from the "Symbols" input (stratergy 1 and stratergy 2) Settings The below settings
              革新的な MT5 インジケーター、DARWIN Assistant   をご紹介します。これは、トレーディングを成功させる世界への究極のゲートウェイです。精度と専門知識に基づいて設計された DARWIN Assistant   は、RSI、ストキャスティクス、CCI、トレンドなどの高度なテクニカル指標をすべての時間枠にわたって活用する特別な戦略に基づいて動作します。この最先端のインジケーターはエントリーのための最も正確なシグナルを提供し、比類のない自信を持って市場をナビゲートできるようにするため、並外れた取引体験に備えてください。 DARWIN Assistant   を使用すると、最も収益性の高い取引機会を検出するために細心の注意を払って調整された、重要な指標の包括的な分析にアクセスできるようになります。不確実性に別れを告げ、情報に基づいた意思決定の新時代を迎えましょう。 RSI、ストキャスティクス、CCI、トレンドを DARWIN Assistant   内でシームレスに統合することでその力を解き放ち、これまでにないほど市場のダイナミクスを鮮明に描きます。 DARWIN
              Our BOOM SELL ALERT indicator is specifically engineered to   take candles on BOOM 1000 , BOOM 500 is tool is optimized for M1 (1-minute) timeframe, ensuring you receive timely and actionable insights.   The indicator is a combination of   many indicators. -        AO Oscillator -        Stochastic   HOW TO USE THIS INDICATOR To use well this indicator , it   need to use SCHAFF TREND RSX ( 5 MIN OR M5) IF SCHAFF trend RSX is GREEN and you have a signal then SELL when you have ENTRY and out with
              Market Profile Introducing the Market Profile MetaTrader Indicator—your gateway to mastering market dynamics with precision and insight. This powerful tool delivers a classic Market Profile analysis, revealing price density over time and highlighting crucial levels, including the value area and control value for any trading session.  Compatible with timeframes from M1 to D1, it adapts to daily, weekly, monthly, or even intraday sessions, offering you unmatched flexibility. Lower timeframes pro
              M & W Pattern Pro is an advanced scanner for M and W patters , it uses extra filters to ensure scanned patterns are profitable. The indicator can be used with all symbols and time frames. The indicator is a non repaint indicator with accurate statistics calculations. To use , simply scan the most profitable pair using the statistics dashboard accuracy , then enter trades on signal arrow and exit at the TP and SL levels. STATISTICS : Accuracy 1 : This is the percentage of the times price hit
              Before installing the HeatMap indicator make sure you are using a broker that gives you access to the Depth of market (DOM) !! This indicator creates a heatmap on your chart allowing you to see the buy or sell limit orders easily and in real time. You have the possibility to change the setting and the colors of the HeatMap in order to adapt to all markets and all charts. Here is an example of a setting you can use with the NASDAQ100 on the AMPGlobal broker :  https://www.youtube.com/watch?v=x0
              High Probability Reversal Arrow Indicator The indicator looks for trend exhaustion areas, and plots Buy/Sell arrow after on confirmation of trend exhaustion. Signals can also   be shown as popup alerts, or be sent as e-mail or mobile phone notification. Trades can be taken on breakout of the signal candle. Inputs Signal Type: Aggressive/Normal History Bars : Can be set to 0 (zero) to show all historical signals, or can be set to a limited number of bars for faster execution. Show Alert : True/F
              The market is unfair if only because 10% of participants manage 90% of funds. An ordinary trader has slim changes to stand against these "vultures". This problem can be solved. You just need to be among these 10%, learn to predict their intentions and move with them. Volume is the only preemptive factor that faultlessly works on any timeframe and symbol. First, the volume appears and is accumulated, and only then the price moves. The price moves from one volume to another. Areas of volume accumu
              Session Control session indicator. Depending on from which continent the trading activity takes place in a certain period, the entire daily routine is divided into several trading sessions. Due to the fact that at each separate time interval exchange and banking platforms from different parts of the world are connected to the trading process, and the Forex market operates around the clock. There are 4 main trading sessions: Pacific. European. American. Asian. This indicator allows you t
              Elliott Wave Trend was designed for the scientific wave counting. This tool focuses to get rid of the vagueness of the classic Elliott Wave Counting using the guideline from the template and pattern approach. In doing so, firstly Elliott Wave Trend offers the template for your wave counting. Secondly, it offers Wave Structural Score to assist to identify accurate wave formation. It offers both impulse wave Structural Score and corrective wave Structure Score. Structural Score is the rating to sh
              Direct Hint is an arrow indicator for determining the trend, which can adjust to the price. Direct Hint is one of the most interesting trend indicators. On the highs, you can get several hundred pips in one trade with the trend. The indicator shows the direction of the trend. This is an arrow tool that provides ready-made signals. If an upward trend begins, the indicator draws a blue upward arrow. At the beginning of a downtrend, the instrument shows a red down arrow. Direct Hint takes into a
              Win43 Scalper
              Eadvisors Software Inc.
              O novo s43 Scalper para Mini-Índice (WIN-IND) faz operações de curto prazo no timeframe 1min buscando pequenas variações do mercado, utiliza nova tecnologia de trade, os resultados no intraday são íncríveis, confira:      Após a instalação adicione no gráfico dos instrumentos win para visualizar os resultados no backteste. Recomendamos o timeframe de 1min.
              Was: $249  Now: $99   Market Profile defines a number of day types that can help the trader to determine market behaviour. A key feature is the Value Area, representing the range of price action where 70% of trading took place. Understanding the Value Area can give traders valuable insight into market direction and establish the higher odds trade. It is an excellent addition to any system you may be using. Inspired by Jim Dalton’s book “Mind Over Markets”, this indicator is designed to suit the
              Was: $299  Now: $99   Supply Demand uses previous price action to identify potential imbalances between buyers and sellers. The key is to identify the better odds zones, not just the untouched ones. Blahtech Supply Demand indicator delivers functionality previously unavailable on any trading platform. This 4-in-1 indicator not only highlights the higher probability zones using a multi-criteria strength engine, but also combines it with multi-timeframe trend analysis, previously confirmed swings
              trend view panel; AutoSignals Trend The indicator tracks the trend in 5 different chart times for the same asset, based on 6 signals for each chart time. The main objective of the indicator is to show us the majority trend of the financial asset in which it was placed. The system transmits the information of the trends in different graphic times, in this way the user is able to have a wide view of the movement of the asset, this type of tool makes the user have a higher hit rate by
              Introducing "X Marks the Spot" – Your Ultimate MetaTrader 5 Indicator for Perfect Trades! Are you tired of the guesswork in trading? Ready to take your MetaTrader 5 experience to a whole new level? Look no further – "X Marks the Spot" is here to revolutionize your trading strategy! What is "X Marks the Spot"? "X Marks the Spot" is not just another indicator – it's your personal trading compass that works seamlessly on all timeframes . Whether you're a beginner or an experienced trader,
              Orders SL and TP Values Show これは、メインチャートの線上に利益と損失の値を表示するインジケーターです。さらに、ポイントでの距離も表示されます。 このインジケーターの特徴は次のとおりです。 スワップ値を含めるオプション。これにより、注文のストップロスとテイクプロフィット値をより正確に計算できます。(デフォルトで有効) 価格値の左側にチケット番号を含めるオプション。これは、ターミナルのツールボックスに従ってレベルを識別するのに役立ちます。(デフォルトで無効) 値がストップロスかテイクプロフィットかに関係なく、利益が出ている場合は青で塗りつぶされ、損失が出ている場合は赤で塗りつぶされます。 同じ値の異なるチケットのストップロスまたはテイクプロフィットが2つ以上存在する場合、それぞれを正しく識別できるように、チケット番号とともに情報がランダムに回転されます。 値は、アカウントにある通貨で表示されます。ポイントも表示されます。 色または距離は、入力パラメータを使用して調整できます。 カウンターには、一致したチケットの合計数(ストップロスまたはテイクプロフィッ
              プレミアムレベルは、正しい予測の精度が80%を超える独自の指標です。 この指標は、最高のトレーディングスペシャリストによって2か月以上テストされています。 あなたが他のどこにも見つけられない作者の指標! スクリーンショットから、このツールの正確さを自分で確認できます。 1は、1キャンドルの有効期限を持つバイナリーオプションの取引に最適です。 2はすべての通貨ペア、株式、商品、暗号通貨で機能します 手順: 赤い矢印が表示されたらすぐにダウントレードを開き、青い矢印が表示されたら閉じます。青い矢印の後に開くこともできます。 試してテストしてください!推奨設定はデフォルトです! 日足チャートで最高の精度を示します! インディケータは、2600 Pipsの収益性に対して、約10Pipsという非常に小さなマージンを使用します。
              QuantXMarketScanner is a multi assets indicator for MT5 - Mathematical model based on 7 custom moving averages indicators  - Adaptable on Currencies, Stocks and Crypto - Automatic setup, self optimized About QuantXsystem Products: –         Simple installation & integration into MT5   –         Unlimited License after purchase (for one user) –         Automatic pattern recognition to identify the best timing and price levels. –         Trading indicators are displayed directly and automatica
              Good day! I present to you a trading technical indicator for Deriv broker synthetic indices. This indicator ONLY works with the following indices: Boom 300 Index Boom 500 Index Boom 1000 Index Crash 300 Index Crash 500 Index Crash 1000 Index The indicator was created to give signals to open medium-term trades in the direction of Spikes. But you can open trades in the opposite direction to Spikes, at your own risk. Trade only on M1. Other TFs do not guarantee the correct operation of the indic
              稼ぎと研究のためのツール。 トレーディングシグナルと戦略の中核は、価格予測パターンを形成するための著者のアルゴリズムに基づいています。どんな楽器にも使えます! MA「九尾の狐」に基づく制御システムが追加され、市場、機器、および作業期間に合わせて信号を可能な限り正確に更新および調整します。 対象:すべての市場のすべての商品(例外があります)。 対象者:ヘッジファンド、ファンドおよび資産運用会社、投資運用会社、投機家、投資家および利害関係者。 .................................................................................................................................................................................
              Классификатор силы тренда. Показания на истории не меняет. Изменяется классификация только незакрытого бара. По идее подобен полной системе ASCTrend, сигнальный модуль которой, точнее его аппроксимация в несколько "урезанном" виде, есть в свободном доступе, а также в терминале как сигнальный индикатор SilverTrend . Точной копией системы ASCTrend не является. Работает на всех инструментах и всех временных диапазонах. Индикатор использует несколько некоррелируемых между собой алгоритмов для класси
              PipFinite Exit EDGE MT5
              Karlo Wilson Vendiola
              4.86 (29)
              Did You Have A Profitable Trade But Suddenly Reversed? In a solid strategy, exiting a trade is equally important as entering. Exit EDGE helps maximize your current trade profit and avoid turning winning trades to losers. Never Miss An Exit Signal Again Monitor all pairs and timeframes in just 1 chart www.mql5.com/en/blogs/post/726558 How To Trade You can close your open trades as soon as you receive a signal Close your Buy orders if you receive an Exit Buy Signal. Close your Sell orde
              A huge number of traders use the VolumeProfile/MarketProfile analysis method. And I think there is no need to explain such concepts as POC and VAH/VAL. However, the standard VolumeProfile representation has a drawback - we only see the current picture of the market. We see the "convexity" of the volume distribution within the period. But we don't see the main thing - the "migration" of the POC level during the price movement. Our indicator is unique. It is dynamic. The first feature is that the
              Micro  ******************* Секундные графики MT5 ********************** Более точного инструмента для входа в сделку вы не найдёте. Входные параметры: Timeframe, sek - период построения графика, секунды Displayed bars - отображаемые бары Step of price levels, pp, 0-off - шаг отрисовки ценовых уровней, пункты Scale points per bar, 0-off - масштаб в пунктах на бар Show lines - отображение текущих уровней Show comment - отображение комментария Standard color scheme - стандартная цветовая сх
              Key level wedge MT5
              Presley Annais Tatenda Meck
              The   Key level wedge MT5   indicator automatically draws rising wedge pattern and falling wedge pattern for you on the chart. This pattern is really good when used as a confirmation entry at key support & resistance, supply & demand and reversal zones. Advantages  The   Key level wedge MT5   block DOES NOT RE-PAINT, giving you confidence when a signal appears and also helps when looking back.  The   Key level wedge MT5   includes an on/off button on the chart to easily keep the charts cle
              このプロダクトを購入した人は以下も購入しています
              IVISTscalp5
              Vadym Zhukovskyi
              5 (5)
              iVISTscalp5インジケーターをご紹介します。このインジケーターは、トレーディングにおいて独自でありながら効果的です。時間データに基づくこのインジケーターは、多年にわたる経験と金融市場の深い分析の結果です。iVISTscalp5インジケーターは、手動トレーディングにとって優れたツールです。便利さ、簡単さ、可視化 - すべての複雑さが内部に隠されています。私たちは、iVISTscalp5インジケーターの設定と使用を最大限に簡素化しました。このインジケーターは、MT5ターミナルにあるすべての金融商品に適しています。 稼働時間は、4時から20時(UTC+3)です。 iVISTscalp5インジケーターメニュー(スクリーンショット1を参照): History - 引用を計算する週数 dT_min - 時間間隔の選択(分) TFline - 水平ボリュームの作成(時間枠) BARSline - 水平ボリュームの作成(バー数) TFtrend1 - デイリーチャンネルの作成(時間枠) BARStrend1 - デイリーチャンネルの作成(バー数) TFtrend2 - 週次チャンネルの作成(時
              VTrende Pro
              Andrii Diachenko
              5 (1)
              VTrende Pro - MTF indicator for trend trading with a display panel for MT5 *** Videos can be translated into any language using subtitles (video language - Russian) Although the signals of the VTrende Pro indicator can be used as signals of a full-fledged trading system, it is recommended to use them in conjunction with the Bill Williams TS. VTrende Pro is an extended version of the VTrende indicator. Difference between Pro version and VTrende: - Time zones - Signal V - signal 1-2 waves
              The indicator is designed to close positions on the market in time. For example: to take profits ahead of schedule if the price has not reached TakeProfit, and the market is turning around. The indicator analyzes the momentum, not the trend. He does not give any information about the trend. The indicator is well suited for finding divergence. The Ershov 38 Parrots indicator dynamically adjusts to the market and detects price movement impulses of medium and high amplitude. It almost does not rea
              EQ Cutrim Theory
              Marco Aurelio Santos Costa
              Ronal Cutrim has been a dedicated mathematician for 14 years and has more than 10 years of experience in the financial market. The concept of the theory is simple, find imbalance between buyers and sellers. Which makes a lot of sense, because nothing goes up forever, nothing falls forever.   When you find an asset with a mathematical probability of unbalanced equilibrium, it is a great way to get into trading:  TUTORIAL: Turn on the subtitles, the video is subtitled
              The Smooth Price technical indicator is used for plotting a smoothed line as close to the price of the financial instrument as possible, and serves to eliminate its noise components. The indicator is part of the Monarch trading system, but here it is presented as an independent technical analysis tool. The indicator is based on the cluster digital filter , which, unlike the ClusterSMA , is applied directly to the price time series. Smooth Price does not redraw (except the very last, zero bar) an
              Weis Wave with Alert MT5
              Trade The Volume Waves Single Member P.C.
              4.93 (15)
              Rental/Lifetime Package Options and Privileges  * For optimum results the yearly or lifetime package is suggested due to live training ! Rent Monthly Six Months   Yearly/Lifetime Weis Wave with Speed with Alert+Speed Index x x x Manual  x x x Quick Set up Video x x x Blog x x x Lifetime Updates x x x Setup and Training Material x x Free Rectangle Break Alert Tool      x Discord Access Channel "The SI traders" x 2-hour live methodology training x How to trade with it:    http://ww
              Indicador en base a la pendiente de la linea de precio, dibuja una línea de color cuando sube a base de los precios que previamente has sido procesados o linealizados, y cuando baja la pendiente la linea linealizada toma otro color. En este caso se a considerado 6 lineas de diferentes procesos desde pendientes largas hacia las cortas, observándose que cuando coincidan las pendientes se produce un máximo o mínimo, lo que a simple vista nos permitirá hacer una COMPRA O VENTA.
              A scalping indicator based on mathematical patterns, which on average gives signals with relatively small SL, and also occasionally helps to catch big moves in the markets (more information in the video) This indicator has three main types of notifications: The first type warns of a possible/upcoming signal on the next bar The second type indicates the presence of a ready signal to enter the market/open a position The third type is for SL and TP levels - you will be notified every time price r
              Индикатор Coefficient Of Determination (COD) представляет собой значение коэффициента детерминации или квадрат коэффициента корреляции между зависимой переменной — ценой и объясняющей переменной — тиковым объемом. Что это дает нам на практике? COD отлично распознает кульминацию трендовых движений, что позволяет подбирать оптимальные точки и ловить развороты рынка. Как использовать индикатор: Наиболее популярная торговая стратегия строится совместно с трендовым индикатором Moving Average (MA), пе
              Fibonacci Múltiple 12, utiliza la serie fibonacci plasmado en el indicador fibonacci, aumentadolo 12 veces según su secuencia. El indicador fibonacci normalmente muestra una vez, el presente indicador se mostrara 12 veces empezando el numero que le indique siguiendo la secuencia. Se puede utilizar para ver la tendencia en periodos cortos y largos, de minutos a meses, solo aumentado el numero MULTIPLICA.
              Recommended TimeFrame >= H1. 100% Non Repainted at any moment.  Use it carefully, only with Trend Direction. Trading Usage: 2 Variants: as Range System or as BreakOut System (Both Only With Trend Direction)::: (Always use StopLoss for minimise Risk); [1] as Range System: (Recommended) in UP TREND:  - BUY in Blue Line , then if price goes down by 50 points (on H1) open Second BUY.   Close in any Profit you wish: TrailingStop(45 points) or Close when Price touches upper Gold Line. in DOWN TR
              En base a cálculos matemáticos de determino una linea Horizontal que cruza a todas las señales de trading, mostrando los máximos y mínimos. La linea horizontal parte en dos las subidas y bajadas de las señales de trading, de tan manera que es fácil identificar los máximos y mínimos, y es inteligente por que es sensible a las subidas y bajadas, afín de no quedarse en un solo lado por siempre, trabaja excelentemente con otros indicadores suavizadores ya que les garantiza que en un intervalo de tie
              this indicator is a Spike detector indicator, it is specially designed to trade Boom 1000, Boom 500, Crash 1000 and Crash 500 We recommend using it on Deriv Boom and Crash indices only Its setting is intuitive, familiar, easy to use it has notification functions; audible notifications and push notifications. this tool is simple to use, easy to handle This update is based on different strategies for spikes
              インジケーターは、各チャート時間の6つの信号に基づいて、同じ資産の5つの異なるチャート時間のトレンドを追跡します。 指標の主な目的は、それが置かれた金融資産の大多数の傾向を示すことです。 システムは数回のグラフィカルな時間で傾向の情報を送信します。これにより、ユーザーは資産の動きの広い視野を持つことができます。このタイプのツールは、オペレーターが注文を実行するのを支援することで、ユーザーのヒット率を高めます トレンドを支持して。 Injikētā wa, kaku chāto jikan no muttsu no shingō nimotozuite, onaji shisan no itsutsu no kotonaru chāto jikan no torendo o tsuiseki shimasu. Shihyō no omona mokuteki wa, sore ga oka reta kin'yū shisan no dai tasū no keikō o shimesu kotodesu. Shisutemu wa sū-kai no gurafikaruna
              Limitless MT5 is a universal indicator suitable for every beginner and experienced trader. works on all currency pairs, cryptocurrencies, raw stocks Limitless MT5 - already configured and does not require additional configuration And now the main thing Why Limitless MT5? 1 complete lack of redrawing 2 two years of testing by the best specialists in trading 3 the accuracy of correct signals exceeds 80% 4 performed well in trading during news releases Trading rules 1 buy signa
              Indicador en MQL5, recibe la información del precio SUAVIZADO, lo procesa anulando los picos inteligentemente, y el resultado lo envía al desarrollo de la escalera que iniciara y subirá o bajara según el peldaño o INTERVALO ingresado Ingreso PERIODO = 50 (variar segun uso) Ingreso MULTIPLICA AL PERIODO = 1 (variar segun uso) Segun la configuración la escalera puede pegarse o separarse de los precios,, Se aplica toda la linea de tiempo, y a todas las divisas, etc.  
              Indicador en MQL5, que obtiene el promedio de 10 EMAS, que son alineadas según Fibonacci, obteniendo un promedio, que sera suavizado.  Se puede ingresar un numero desde 2 a N, que multiplica a los EMA-Fibonacci. Funciona en cualquier criptomoneda, etc. etc... pudiendo calcular el futuro segun la tendencia de las EMAS. Funciona excelentemente en tramos largos, determinando exactamente el mejor inicio/salida. El precio inicial por apertura sera por un periodo de tiempo, luego aumentará.
              QuantXSTocks Trading Range Indicator for MT5: INSTRUCTIONS TO USE OUR INDICATOR:- User needs to take trade on Arrow or after an Arrow CandleStick, You can achieve up-to 35-125 pips target by this Indicator. Best Timeframes for Stocks and Indices are M30 and H1: AMAZON M30 (50 pips) TESLA M30 (50 pips) APPLE M30 (50 pips) ADOBE M30 (50 pips) NASDAQ100 H1 (125 pips) The above are the approximate amount of pips you can achieve by this Indicator, Green arrow appears to be buy arrow while the Red a
              Super Suavizador
              Cesar Juan Flores Navarro
              Indicador en MQL5 que obtiene el promedio de 10 EMAS que son alineadas y procesadas según Fibonacci luego el promedio es suavizado"  Se ingresa un número de 2 a N que multiplica los EMA-Fibonacci y por consiguiente aumenta los fibonacci, resultando un promedio.   Se ingresa un número que suaviza los EMA-Fibonacci. Considerando los números 1/1 seria la suavización minima. Considerando los números 3/5 seria la suavización media. Considerando los números 10/30 seria la suavización alta.....etc
              Trend and Signals MT5  indicator scans  30 trading Instruments (Forex, Metals and Indices).     It uses special algorithm on the  current market   based on   Pure Price Action   and display the overall trend and signal on the dashboard. When signals are produced the indicator sends alert and notification. Strategy for Signals This indicator uses the daily timeframe to determine the direction of the trend. The hourly timeframe is used to identify possible entries. Main trend and is determined by
              This indicator is based on a mathematical formula and an ANN combined, designed to make a model(using previous prices) of the most recent market condition (any chart*) in order to use the model as a forecasting tool. *This indicator can operate on any chart/timeframe, but it's suggested you use multiple timeframes for each trade because this method relies solely on the time factor, you can not use this indicator to predict price volatility, but if it's fit correctly it will show you when the nex
              This indicator is based on the crossing of two Moving Average with the RSI It is intended for scalpers Specially designed for Boom and Crash syhtetic indices from Binary.com/Deriv.com It is easy to use and intuitive. We recommend its use on M1 and is equipped with three types of notification Email alert Sound notification Push notification these parameters can be activated and deactivated.
              このインジケーターは、「回帰チャンネルツール」のコンセプトに基づいた堅牢な市場分析手法を提供します。このツールを活用することで、トレーダーはチャートの回帰チャンネルに対して優れたコントロールを行い、より情報を得てトレードの決定を行うことができます。 回帰チャンネルツールは、トレーダーのツールボックスにおける強力な道具です。価格トレンドや潜在的なサポートと抵抗レベルに対する貴重な洞察を提供することを目的としています。このツールは特にトレンド内の修正波動を視覚化するのに効果的であり、価格のダイナミクスの包括的なビューを提供します。 以下は、このインジケーターを使用する際の主な特徴と利点について詳しく説明します: チャンネルレベルとサポート/レジスタンス:   このインジケーターの主な利点の一つは、動的なサポートとレジスタンスゾーンとして機能するチャンネルレベルを生成する能力です。これらのレベルは潜在的なエントリーポイントや出口ポイントを特定するのに重要であり、トレーディング戦略の精度を向上させます。 修正波動レベル:   修正波動レベルを有効にすることで、トレーダーは大きなトレンド内での潜
              Use with JUMP 25. However it can can with the volatility indices as well because it is a modified version. It is advisable to use create a healthy account management. Measure your risk and happy trading. Other experts to be loaded soon. These are modified in order to optimise profits. Ideal candidates are high risk, high returns individuals who hold trades at a maximum of 1 - 2 hours
              This indicator is a scalping indicator intended solely for the Boom and Crash indices of the Deriv Limited market It supports Boom 500, Boom 1000, Crash 500 and Crash 1000 Not repaint and no bug The settings are intuitive and easy to use The product activation number is 20 The Time Frame used depends on the user If you are an aggressive scalper then just use M1 For long trades use M15 If you are conservative use M5 Please contact me for more details of its use
              RadioMedia
              Cesar Juan Flores Navarro
              Indicador de MQL5 basado en 3 EMAs, en función del precio. El precio influye en las EMAs, de tal forma que los Máximos y Mínimos solo la alteran minimamente, este influjo lo llame radio. Considerando la influencia del radio como constante, por lo que no tiene valores de entrada. Ideal para todas las criptomonedas. Funciona en todos los tiempos. Se sugiere operar cuando el precio este abajo y en bajada.... o cuando el precio este encima y en subida.
              El Super Suavizador Inteligente es la culminación de la evolución de los suavizadores en funcion del precio, funciona en todos los pares de divisas, es fácil de usar, y puedes usarlo varias veces en un mismo par, afin de darte una idea de hacia donde va el precio, muy util para ver la tendencia a largo plazo. El SSI trata siempre de formar ondas de subidas y bajadas a fin de poder mostrar el máximo y/o mínimo de la tendencia del precio.
              Tomamos 5 medios móviles las unimos en una la cual suavizamos y volvemos a suavizar, resultando un mega suavizador de medios móviles suavizadas. Indicador de mql5 funciona en cualquier broker y para todos los tiempos, siendo el mas optimo el de 5, 15 a mas. Funciona mejor en grupo consigo misma osea poner uno de 14 y otro de 50 y 400,, así se observa mejor su desempeño.
              AIS MT5 INDICATOR 5 ALL INCLLUSIVE SET GUIDE CHAPTER 1  IMPORTANT INFORMATION <1> THIS INDICATOR IS ONE OF THE SERIES OF NEW AIS INDICATORS AIS MT5 INDICATOR 1 =ADVANCED CLASSIC= AIS MT5 INDICATOR 2 =MULTIFRAMES= AIS MT5 INDICATOR 3 =LINES= AIS MT5 INDICATOR 4 =MARKET PROFILES= AIS MT5 INDICATOR 5 =ALL INCLUSIVE SET CHAPTER 2 GENERAL FEATURES OF THE SERIES <1> AIS MT5 INDICATOR 1 =ADVANCED CLASSIC= < DEVELOPMENT PAUSED >     DISPLAYS MAIN TIME POINTS AND PRICE LEVELS OF THE CHART     
              Quantitative analysis software, this indicator came from another country and thanks to my network today I can share this software with you! Russian Tool plots arrows on your asset, indicating the trend the asset will enter, easy to use and easy to install indicator We have been working with robots and indicators since 2018! We came to MQL5 to be able to bring better benefits at the time of payment by our customers!, our Instagram where we post daily stories of operations: https://www.inst
              作者のその他のプロダクト
              [ Thank reviewers by September 24, 2024 = 36 downloads ] [ V\R_All in One ] we're letting u download it for free to support the launch of the main products!  The cool part is u can use it on your chart without having to run it with the main product. Just a heads up, though—alerts might pop up since this product isn't linked to the main one.  Plus, you can experiment with it by downloading the free trial of the following main products! |   This allows many people to enjoy and experience our pr
              FREE
              Currently, the product's selling price is over $680; however, we are offering a monthly rental system for only $30. This allows many people to enjoy and experience our products during this launch stage, which will likely lead to positive reviews from users, making it more enjoyable | We hope that if there are more than 10 positive reviews, the GOOD NEWS is that the next use will last for 3 months at a fixed price of only $30 | Take advantage of our promo opportunity, before it goes back to sell
              Currently, the product's selling price is over $480; however, we are offering a monthly rental system for only $30. This allows many people to enjoy and experience our products during this launch stage, which will likely lead to positive reviews from users, making it more enjoyable | We hope that if there are more than 10 positive reviews, the GOOD NEWS is that the next use will last for 3 months at a fixed price of only $30 | Take advantage of our promo opportunity, before it goes back to sell
              Currently, the product's selling price is over $680; however, we are offering a monthly rental system for only $30. This allows many people to enjoy and experience our products during this launch stage, which will likely lead to positive reviews from users, making it more enjoyable | We hope that if there are more than 10 positive reviews, the GOOD NEWS is that the next use will last for 3 months at a fixed price of only $30 | Take advantage of our promo opportunity, before it goes back to sell
              [   Disclaimer   ] We're letting u download it for free to support the launch of the main products & training for CyberBot Members !  Hurry up download limited quota. The cool part is u can use it on your chart without having to run it with the main product. Just a heads up, though—alerts might pop up since this product isn't linked to the main one. Plus, you can experiment with it by downloading the free trial of the following main products 8 Symbols 8 TimeFrames 8 Shadows + Pivot Support Resi
              FREE
              The first hybrid product on the MQL5 market > One file [EA] Expert Advisor contains Multi Indicators + Trading Panel + EA Robot including advanced mastermind capabilities simultaneously for 8 Pairs + 8 Timeframes + 8 Shadows. Currently, the product's selling price is over $480; however,   we are offering a three-month rental system for only $30. This allows many people to enjoy and experience our products during this launch stage, which will likely lead to positive reviews from users, making it
              フィルタ:
              レビューなし
              レビューに返信