Trading sessions time
- ユーティリティ
- Martin Muriu Maina
- バージョン: 1.2
- アクティベーション: 5
What is Trading Session Time indicator for MetaTrader?
Trading Session Time indicator for MetaTrader is a tool designed to save your time and efforts. At the same time, it is also helpful to spot possible trading opportunities.
The human brain is very efficient in finding visual patterns. Trading Session Time indicator helps highlight areas on the chart to find these patterns.
Once you specify a time or an interval, the indicator will scan the chart and draw the areas of interest for you.
The indicator is very simple and easy-to-use. Furthermore, it is also flexible enough to satisfy the needs of many traders.
How to use Trading Session Time indicator in MT4 and MT5?
As it has been already mentioned, Trading Session Time indicator is both simple but flexible. With a few options, you can decide to draw lines, areas, rectangles.
There are some generic options and some more specific for the desired function.
shown on the screenshots.
Choice of color
You can choose the color of the indicator's drawings, so that it helps you spot what you are trying to spot.
For example, you can make different colors mean different parts of a session. It is for you to simplify the chart's interpretation.
Selection of days
You can enable or disable drawing for some days of the week. For example, you might want to disable drawing for Wednesdays for some reason. The indicator allows you to do that for individual days of the week.
Drawing in the background
All the graphical objects are created in the background of the chart. This allows the candlestick to remain well visible on top of the trading session markup.
Draw Lines at Specific Times
If you specify a start time but not the end time, then the indicator will create a vertical line for every day at the specified time.
This can be useful when you perform studies of behavior at specific time.
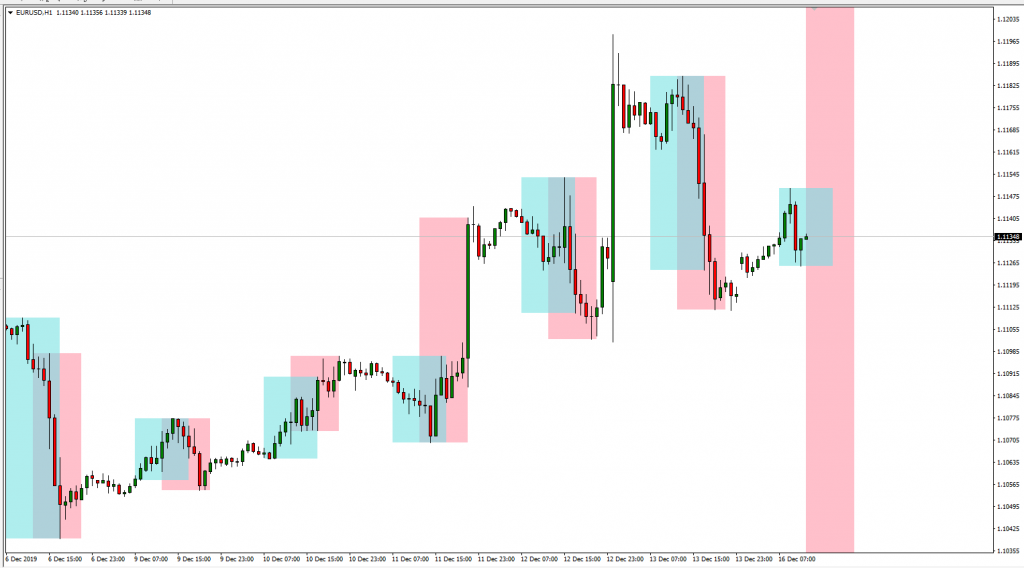
Create areas for trading sessions
If you specify the start time and the end time, then the indicator will create areas in the specified interval.
The area will start at the start time and end at the end time. The area will also automatically contain the highs and lows of the interval.
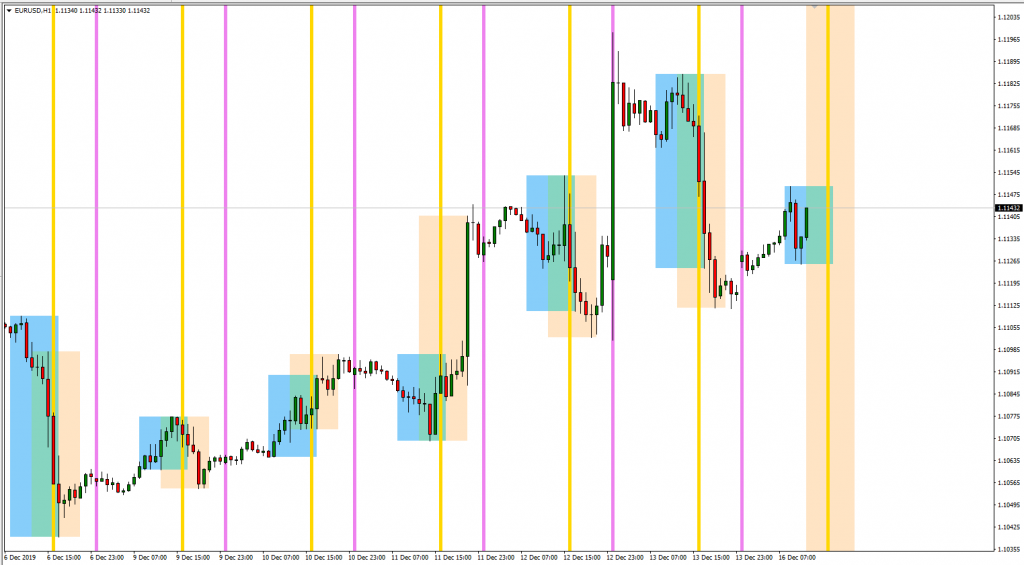
Combine multiple areas or times
One of the most attractive feature of the indicator is its flexibility. If you add multiple instances of the indicator to a chart, you can add different times and different intervals.
To do this:
- Add the indicator multiple times.
- Be careful to assign a different Indicator Name parameter to each instance.
- Select the time or interval.
- Select different colors.
The resulting chart may turn out to be very informative.
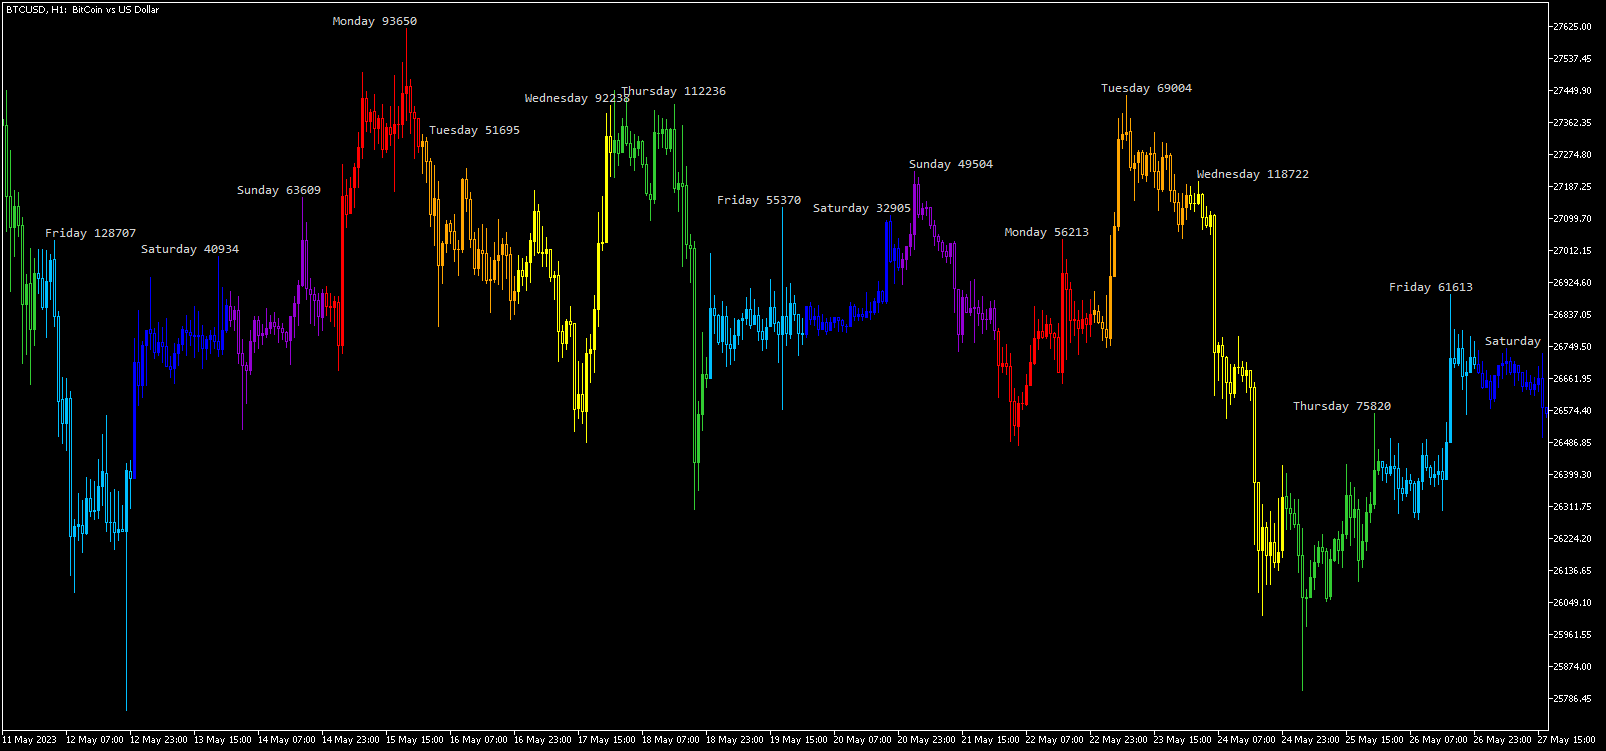
Candlestick sessions
You can also choose to display trading sessions as colored Japanese candlesticks. MT5 version of the indicator is better at this because it can display more realistic candlesticks. You can see an example with each weekday drawn using a different color scheme along with session labels and daily range sizes
MT4 Trading Session Time indicator
As a trader, you might find useful to have a tool that shows you trading session times and other times of day.
When creating an intraday strategy you often need to pick the right time to enter and exit a trade. Your trading rules might be effective at some moment of the day and not at other times. Getting a visual representation of these sessions or times can be very valuable and can save you a lot of time.
With Trading Session Time indicator for MT4, you can:
- Draw an individual line at the time that you specify.
- Draw a rectangle area between two times that you specify.
- Add multiple sessions or lines by adding the indicator multiple times.
- Exclude drawing for some days of the week.
- Highlight with different colors of your preference.
- Spot highs and lows of the sessions.
The indicator will scan the chart and take care of the highlights. This can help in verifying if the entries or exits could be profitable.
It can also help spotting movements that happen at some particular time of day.