• 概要
  • レビュー
  • コメント (2)
  • 最新情報

VolumeSecret

VolumeSecret:あなたの手にあるボリュームの力

困難なプログラミングの世界では、私たちは常に成長と進化を促す障害に直面しています。市場が課す困難や、トレーダーが最高のパフォーマンスを達成するために奮闘する姿を深く理解しています。そのため、市場での意思決定をよりスムーズかつ正確にするための革新的なソリューションの開発に尽力しています。

VolumeSecret はこの献身の結晶です。この高度なインディケーターは、ボリューム分析と洗練された戦略を組み合わせ、市場を支配しようとする人々に決定的なアドバンテージを提供します。

🔍 VolumeSecretとは?

VolumeSecret は、価格変動の背後に隠された秘密を明らかにするために設計された最先端のテクニカルインディケーターです。ボリューム分析をコンパスとして使用し、エントリーとエグジットの機会を高精度で特定します。フラクタル幾何学とボリュームを組み合わせることで、市場の動きを深く詳細に読み解くことができます。

🚀 VolumeSecretのメリット

  • 深いボリューム分析: 機関投資家の動きや隠れた市場フローを特定。
  • 正確なシグナル: 取引を最適化するための明確で客観的なアラートを提供。
  • 強力な戦略: ボリュームと堅牢なメソッドを組み合わせ、利益の可能性を最大化。

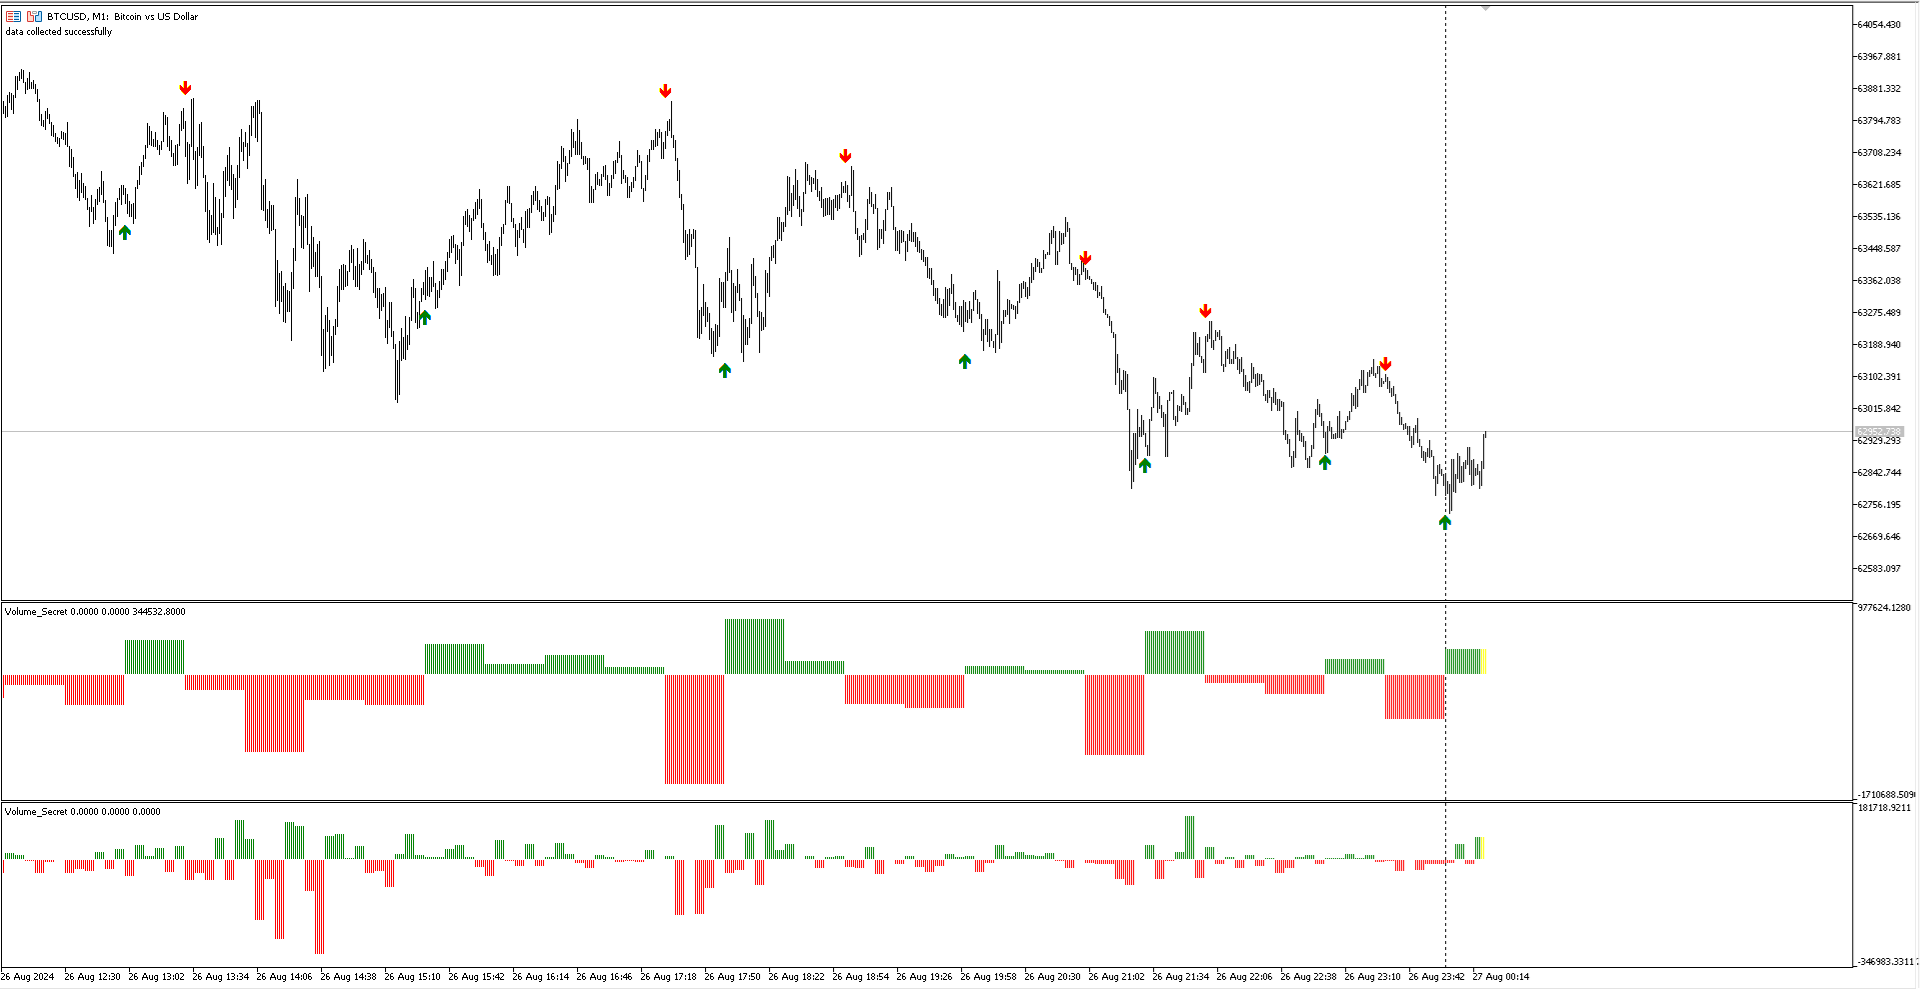
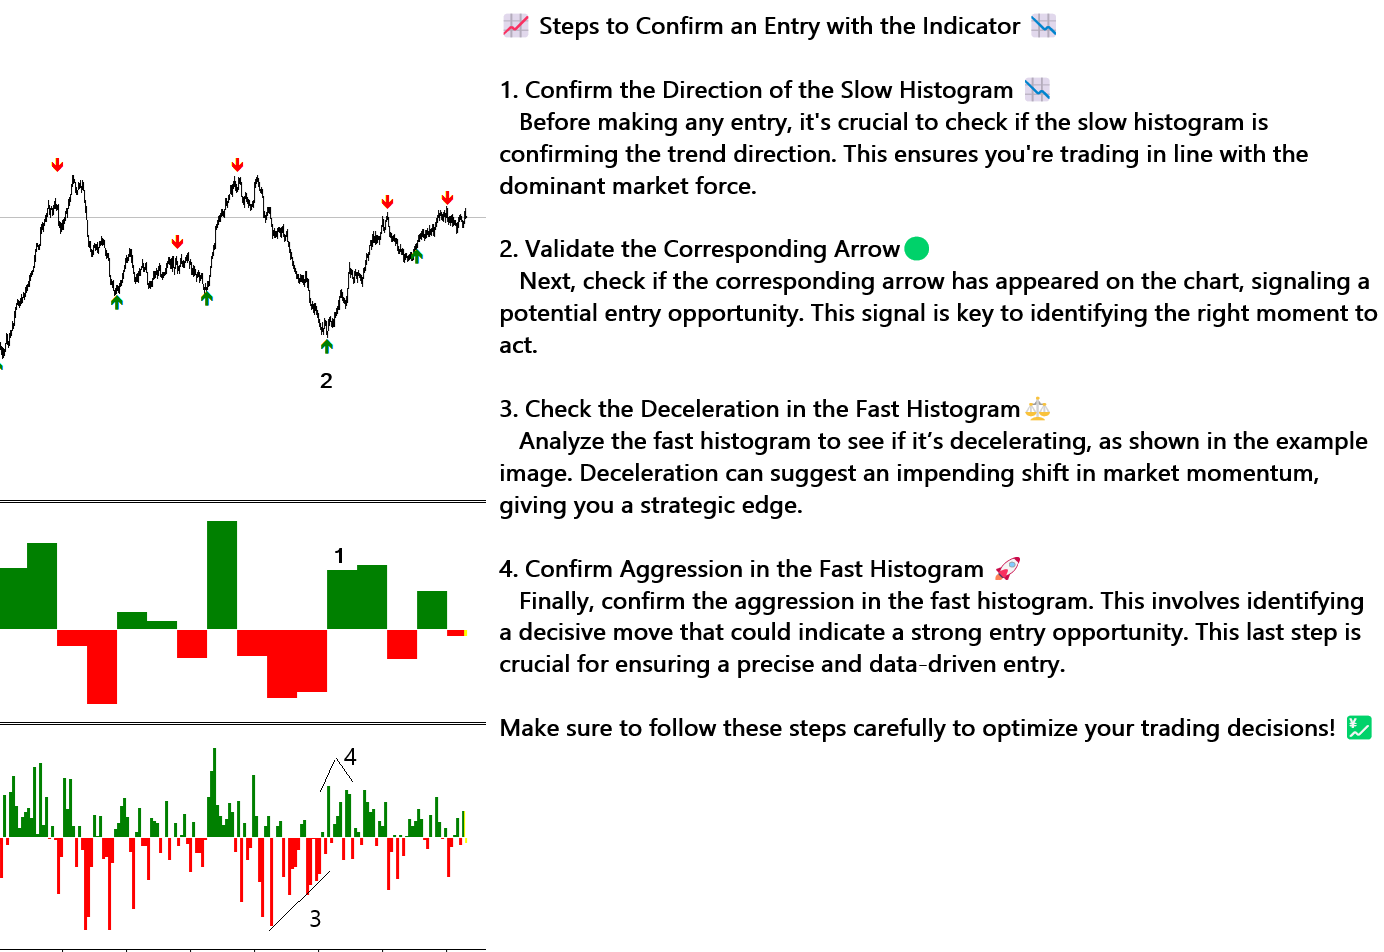
📈 VolumeSecretでエントリーを確認する手順 📉

  1. スローヒストグラムの方向を確認する 📉
    エントリーする前に、スローヒストグラムがトレンドの方向を確認しているかをチェックしてください。これにより、市場の主要な力に沿った取引が保証されます。

  2. 対応する矢印を確認する 🟢
    次に、対応する矢印がチャートに表示されているかを確認し、エントリーのタイミングを見極めます。このシグナルは、適切な行動時期を見定めるために重要です。

  3. ファストヒストグラムの減速をチェックする ⚖️
    ファストヒストグラムを分析し、減速の兆候があるかどうかを確認します。これはより小さいタイムフレームで使用され、フラクタルの原理に従ってマクロでの投影を早期に示します。これにより、戦略的な優位性が得られます。

  4. ファストヒストグラムの攻撃性を確認する 🚀
    最後に、ファストヒストグラムの攻撃性を確認します。これは、強力なエントリーチャンスを示す可能性のある決定的な動きを特定することです。この最後のステップは、正確でデータに基づいたエントリーを確保するために重要です。

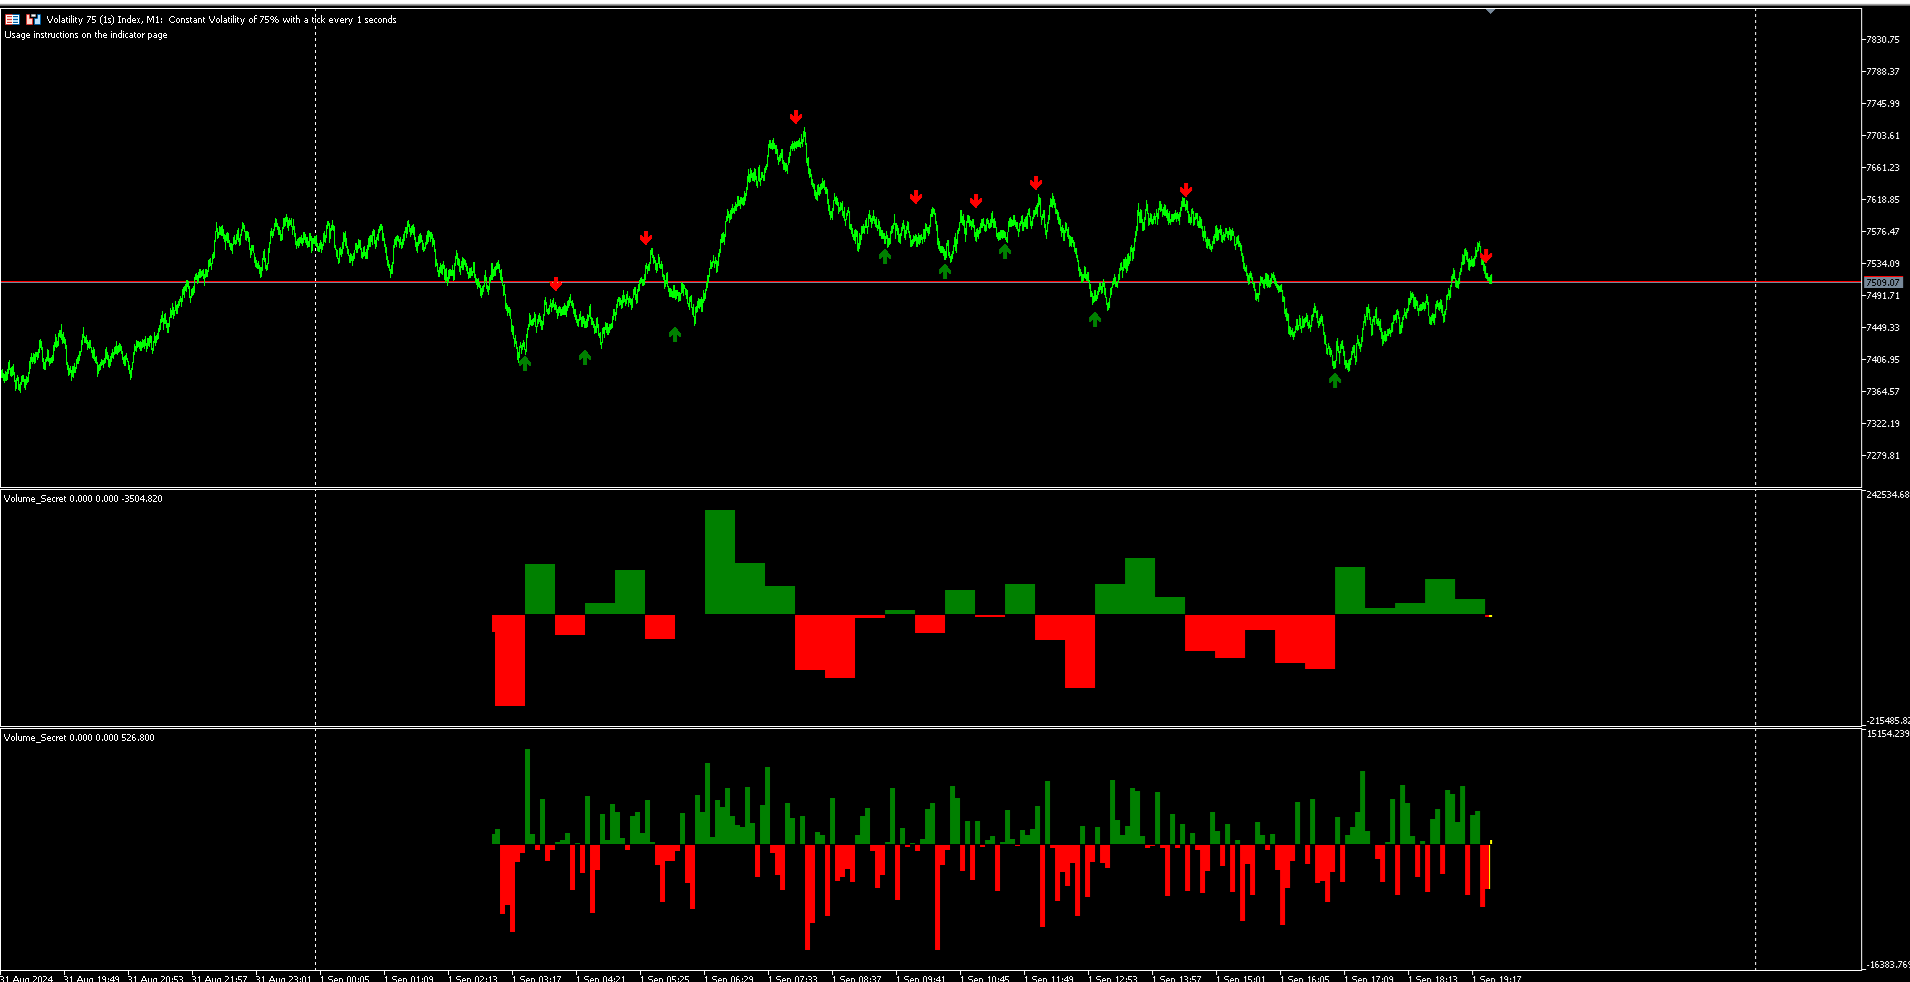
💰 バージョン1.2:すべての金融商品に対応

バージョン1.2では、VolumeSecretがすべての金融商品、株式、FX、仮想通貨、商品などに対応するように調整されました。このアップデートにより、インディケーターの汎用性が向上し、さまざまな市場での最適な分析が可能になります。

💬 フィードバックの重要性

あなたのフィードバックは、VolumeSecretの継続的な改善に不可欠です。あなたの経験を共有することで、インディケーターをよりトレーダーのニーズに合わせて改良することができます。ぜひご意見やご提案をお寄せいただき、最高のツールを提供し続けるためにご協力ください!


おすすめのプロダクト
Stackable VWAP
Flavio Javier Jarabeck
3 (3)
Volume Weighted Average Price (VWAP) is a trading benchmark commonly used by Big Players that gives the average price a Symbol has traded throughout the day. It is based on both Volume and price. Additionally we put in this indicator the MVWAP (Moving Volume Weighted Average Price). For those who do not know the usage and the importance od this indicator I recommend a great article about this subject at Investopedia ( https://www.investopedia.com/articles/trading/11/trading-with-vwap-mvwap.asp
FREE
Functional in the Forex market. Functional in the B3 market - Bolsa Brasil Balcão. Motivation The technical Fibonacci retraction indicator for many is essential and the basis for all market movement forecasts. The name of the tool comes from the Italian mathematician Leonardo de Pisa (13th century). This DEMO version will work in Meta Trader with Demo and Strategy Tester. To purchase the Full version that works on a Real account, click on: https://www.mql5.com/en/market/product/38089
FREE
Midas VWAP
Paulo Henrique Faquineli Garcia
4 (1)
Volume Weighted Average Price (VWAP) is a trading benchmark commonly used by Big Players that gives the average price a Symbol has traded throughout the day. It is based on both Volume and price. This indicator contains Daily VWAP and MIDAS' VWAP, which means you are able to anchor the beggining of MIDAS' calculations and, therefore you will be able to use this methodology to study price versus volume moves after anchor point. You will be able to anchor up to 3 HIGH MIDAS VWAP's and 3 LOW. Wis
FREE
Necessary for traders: tools and indicators Waves automatically calculate indicators, channel trend trading Perfect trend-wave automatic calculation channel calculation , MT4 Perfect trend-wave automatic calculation channel calculation , MT5 Local Trading copying Easy And Fast Copy , MT4 Easy And Fast Copy , MT5 Local Trading copying For DEMO Easy And Fast Copy , MT4 DEMO Easy And Fast Copy , MT5 DEMO The homeopathic indicator is also called the CCI indicator. The CCI indicator was propos
FREE
This indicator uses a different approach from the previous version to get it's trendlines. This method is derived from Orchard Forex, and the process of making the indicator is demonstrated in there video   https://www.youtube.com/watch?v=mEaiurw56wY&t=1425s . The basic idea behind this indicator is it draws a   tangent line   on the highest levels and lowest levels of the bars used for calculation, while ensuring that the lines don't intersect with the bars in review (alittle confusing? I kno
FREE
VWAP Indicator
LUC JACOBUS A VERHEECKE
4.24 (21)
Volume Weighted Average Price (VWAP) The volume weighted average price (VWAP) is a  trading   benchmark  used by traders that gives the average price a security has traded at throughout the day, based on both volume and price. It is important because it provides traders with insight into both the trend and value of a security. This indicator VWAP V2 is free and is the manual version of the extended Easy VWAP indicator (30 Euro), where the date and time properties are automatically entered. With
FREE
FusionAlert StochRSI Master is an indicator available for MT4/MT5 platforms, it is a combination of RSI & Stochastic indicator which provide "alerts" when the market is inside "overbought and oversold" regions combined for both indicators, results in more precise and accurate signals to be used as a wonderful tool, in the form of "buy or sell" signals. This indicator comes with many customization options mentioned in the parameter section below, user can customise these parameters as needful. Jo
FREE
Value Chart Candlesticks
Flavio Javier Jarabeck
4.75 (8)
The idea of a Value Chart indicator was presented in the very good book I read back in 2020 , " Dynamic Trading Indicators: Winning with Value Charts and Price Action Profile ", from the authors Mark Helweg and David Stendahl. The idea is simple and the result is pure genius: Present candlestick Price analysis in a detrended way! HOW TO READ THIS INDICATOR Look for Overbought and Oversold levels. Of course, you will need to test the settings a lot to find the "correct" one for your approach.
FREE
MT4版  | Trend Monitor VZインジケーター  |  Owl Smart Levelsインジケーター   |  Owl Smart Levels戦略   |   FAQ エリオット波理論は 、価格チャート上の波の視覚的モデルに依存している金融市場のプロセスの解釈です。 Valable ZigZagインジケータは、取引の決定を行うために使用することができる市場の波の構造を表示します。 Valable ZigZag indicatorはより安定しており、古典的なZigZag indicatorのように方向を変えることはなく、トレーダーを誤解させます。 これは、指標波の構築にフラクタルを使用することによって達成される。 Telegram チャット: @it_trader_chat 新しい Expert Advisor Prop Master   - 取引ターミナルでテストしてください https://www.mql5.com/ja/market/product/115375 Valable ZigZagは、主にトレンド指標です 。 これは、トレーダーが取引すべき主な方
FREE
すべてのストラテジーをスキャンし、選択したアクティブのすべてのタイムフレームでの買いポイントと売りポイントを表示するスキャナーをお持ちになったことはありますか? それがまさにこのスキャナーが行うことです。このスキャナーは、 Rule Plotter: プログラミング不要のストラテジー作成ツール で作成した買いシグナルと売りシグナルを表示し、さまざまなアクティブとタイムフレームで実行するために設計されています。 Rule Plotterのデフォルトストラテジーは陽線と陰線だけです。つまり、Rule Plotter内に何のストラテジーも描かない場合、このスキャナーは選択したアクティブのすべてのタイムフレームでのキャンドルの色を表示します。キャンドルが陰線の場合は赤で、陽線の場合は緑です。 好きなだけストラテジーを作成 標準のストラテジーに制限されることはありません。Metatraderで利用可能なすべての指標を使用して従来のストラテジーを構築するか、お好きな指標を使用してカスタムストラテジーを構築できます。 このスキャナーはRule Plotterが提供するもののほんの一部であり、Rule
FREE
Hunt markets with Hunttern ZigZag . Easy to use with one parameter    You can use it for the following:       -Classic patterns       -Heads and shoulders       -Harmonic patterns       -Elliott Wave       -Support and resistance       -Supply and Demand Single parameter:      -Period (1-120) Features:        -Candle time        -Single parameter        -Light mode template This is version 1 of Hunttern ZigZag. We are very happy to receive feedback from you.
FREE
Full VWAP
Alexandre Borela
4.84 (31)
このプロジェクトが好きなら、5つ星レビューを残してください。 インスタグラムでフォロー:borelatech ボリュームウェイト平均価格は、合計ボリュームに取引された値の比率です 特定の時間の地平線上に取引. 平均価格の尺度です。 株式が取引地平線上に取引されている. VWAPは、多くの場合、 投資家の取引ベンチマークは、可能な限り受動を目指す 実行。 このインジケータを使用すると、VWAPを以下のように描画できます。 現在の日。 現在の週。 現在の月。 現在の四半期。 現在の年。 または: 前の日。 前週。 前の月。 前の四半期。 年末年始
FREE
Cybertrade Keltner Channels - MT5 Created by Chester Keltner, this is a volatility indicator used by technical analysis. It is possible to follow the trend of financial asset prices and generate support and resistance patterns. In addition, envelopes are a way of tracking volatility in order to identify opportunities to buy and sell these assets. It works on periods longer than the period visible on the chart. All values ​​are available in the form of buffers to simplify possible automations.
FREE
QuantumAlert Stoch Navigator is a free indicator available for MT4/MT5 platforms, its work is to provide "alerts" when the market is inside "overbought and oversold" regions in the form of "buy or sell" signals. This indicator comes with many customization options mentioned in the parameter section below, user can customise these parameters as needful. Join our   MQL5 group , where we share important news and updates. You are also welcome to join our private channel as well, contact me for the p
FREE
Combining the best of Price Action , Directional Movement , and Divergence/Convergence analysis, Candle Color Trend is a easy and reliable way to identify trend direction. The indicator automatically paints the candles according to the assumption that an uptrend is defined by prices that form a series of higher highs and higher lows. In contrast, a downtrend is defined by prices that form a series of lower highs and lower lows. Additionally, ADX Wilder indicator is used to measure trend weakness
FREE
MIDAS Super VWAP
Flavio Javier Jarabeck
4.38 (8)
Imagine VWAP, MVWAP and MIDAS in one place... Well, you found it! Now you can track the movement of Big Players in various ways, as they in general pursue the benchmarks related to this measuring, gauging if they had good execution or poor execution on their orders. Traders and analysts use the VWAP to eliminate the noise that occurs throughout the day, so they can measure what prices buyers and sellers are really trading. VWAP gives traders insight into how a stock trades for that day and deter
FREE
VWAP and MVWAP
Flavio Javier Jarabeck
3.33 (3)
Volume Weighted Average Price (VWAP) is a trading benchmark commonly used by Big Players that gives the average price a Symbol has traded throughout the day. It is based on both Volume and price. Additionally we put in this indicator the MVWAP (Moving Volume Weighted Average Price). For those who do not know the usage and the importance od this indicator I recommend a great article about this subject at Investopedia ( https://www.investopedia.com/articles/trading/11/trading-with-vwap-mvwap.asp )
FREE
Looks for strong price movements and draws levels upon their completion. You determine the strength of the movement yourself by specifying in the settings the number of points and the number of candles of the same color in a row in one direction. There are 2 types of building in the settings: extrenum - high / low close - close price You can also adjust the number of displayed levels and the number of candles for calculations. By default, the settings indicate 5 levels for 360 candles.
FREE
Tillson's T3 moving average was introduced to the world of technical analysis in the article ''A Better Moving Average'', published in the American magazine Technical Analysis of Stock Commodities. Developed by Tim Tillson, analysts and traders of futures markets soon became fascinated with this technique that smoothes the price series while decreasing the lag (lag) typical of trend-following systems.
FREE
White Weis Volume This indicator shows the sum of the volume in each wave, bulish or bearish, as idealized by David Weis , but it brings an important addition , which is the marking of the bar with the highest volume of the wave (White Bar)! In coding the indicator, it was sought to optimize the code to require minimal processing during use and not to overload mt5. The indicator can be used for pre-trading analysis and study, where the trader analyzes possible points of support and resi
The Graphic Alignment Context (GAC) Technical Indicator measures the vertical difference of the simple average price of a financial instrument in the context of three different timeframes determined by a defined number of bars or candles (periods) to determine the strength of the buy or sell trend. sale. Ascending average prices indicate Buying strength (1), Descending average prices indicate Selling strength (-1) and any scenario different from the previous two conditions indicates Neutrality
FREE
This is a buyer and seller aggression indicator that analyzes the shape of each candle and project this data in a histogram form. There are 4 histograms in one. On the front we have two: Upper - Buyer force. Lower - Seller force. At the background we also have two histogram, both with same color. They measure the combined strenght of buyers and sellers. This histograms can be turned off in Input Parameters. It is also possible to have the real or tick volume to help on this force measurement. IN
FREE
WaveTrend Plus
Nguyen Thanh Cong
5 (3)
Introduction WaveTrend Plus is an amazing oscillator that can detect optimal entry points in the market with high precision using complex computations of price and momentum. This version packs many improvements compared to the original WaveTrend such as cleaner visuals, oversold/overbought signals and divergence detection Signal Buy when oversold signal appear (green dot below) or when a bullish divergence is detected (green dashed line) Sell when overbought signal appear (red dot ab
FREE
Simple Weis Wave
Jean Jacques Huve Ribeiro
3.67 (3)
One of the best tools for analyzing volume, Weis Wave was idelized by David Weis, to facilitate the reading of directional flow. For the VSA method disciples it is an evolution of the practices created by Richard Wycoff, facilitating a predictive reading of the market, always seeking an accumulation and distribution of the negotiated contracts. Cumulative wave volume  Range of wave ( removed) Average Wave volume Ref "Tim Ord lectures" ( removed)
FREE
The Market Thermometer can be used to help traders identify sleepy or turbulent periods. It helps beginners to check when is the ideal time to enter operations, that is, when the value of the thermometer is below its average for several periods, identifying a peaceful market. When the market is heated, that is, the thermometer is above three times its average, it is time to make profits. The Thermometer measures the extent to which the end of a period, maximum or minimum price, projects outsi
FREE
Donchian Pro
Paulo Henrique Faquineli Garcia
5 (2)
The Donchian Channel Channels are among the most popular tools of technical analysis, as they visually convey to the analyst the limits within which most price movement tends to occur. Channel users know that valuable information can be obtained at any time, whether prices are in the central region of a band or close to one of the border lines. One of the best known techniques to explore these concepts is Bollinger Bands. However, John Bollinger was not the only one to research the applicatio
FREE
Coiote Volume Candle
Alexandre Moraes De Souza Lima
Candle de Volume Coiote O Candle de Volume  Coiote é um indicador que mede a variação do volume no tempo, seu corpo é pela variação do volume anterior pelo volume atual, sua direção pelo fechamento do preço. 1. identificado um topo no indicador Candle de Volume  Coiote (marcado o fechamento do preço). 2. identificado um fundo no indicador Candle de Volume Coiote (marcado o fechamento do preço). 3. fundo 3 igual fundo 2 no indicador Candle de Volume Coiote, preço no 3 é diferente de fundo 2
FREE
Qstick is a way to objectively quantify candlestick analysis and improve the interpretation of candlestick patterns. Qstick was developed by Tushar Chande and published in his book " The New Technical Trader - Boost Your Profit by Plugging Into the Latest Indicators (1994) ". Qstick is built based on a moving average of the difference between the Open and Close prices. The basis of the idea is that the Opening and Closing prices are the heart of candlestick analysis. We strongly recommend the re
FREE
This indicator sums up the difference between the sells aggression and the buys aggression that occurred in each Candle, graphically plotting the waves of accumulation of the aggression volumes.   Through these waves an exponential average is calculated that indicates the direction of the business flow. Note: This indicator DOES NOT WORK for Brokers and/or Markets WITHOUT the type of aggression (BUY or SELL).   Be sure to try our Professional version with configurable features and alerts:  Agr
FREE
Free automatic Fibonacci is an indicator that automatically plots a Fibonacci retracement based on the number of bars you select on the BarsToScan setting in the indicator. The Fibonacci is automatically updated in real time as new highest and lowest values appears amongst the selected bars. You can select which level values to be displayed in the indicator settings. You can also select the color of the levels thus enabling the trader to be able to attach the indicator several times with differe
FREE
このプロダクトを購入した人は以下も購入しています
まず第一に、この取引インジケーターは再描画されず、再描画されず、遅延しないことを強調する価値があります。これにより、手動取引とロボット取引の両方に理想的なものになります。 ユーザーマニュアル:設定、入力、戦略。 アトミックアナリストは、価格の強さとモメンタムを利用して市場でより良いエッジを見つけるためのPA価格アクションインジケーターです。ノイズや誤ったシグナルを除去し、取引ポテンシャルを高めるための高度なフィルターを備えています。複雑なインジケーターの複数のレイヤーを使用して、アトミックアナリストはチャートをスキャンし、複雑な数学的計算をシンプルなシグナルと色に変換します。これにより、どのような初心者トレーダーでも理解して使用し、一貫した取引の決定を行うことができます。 「アトミックアナリスト」は、新規および経験豊富なトレーダー向けにカスタマイズされた包括的な取引ソリューションです。プレミアムインジケーターとトップノッチの機能を1つの取引戦略に組み合わせ、すべてのタイプのトレーダーにとって汎用性のある選択肢にします。 デイリートレーディングとスキャルピング戦略:高速で正確な
まず第一に、このトレーディングシステムがノンリペイント、ノンリドロー、ノンラグのインジケーターであることを強調する価値がある。これにより、手動取引とロボット取引の両方に理想的なものになっています。 オンラインコース、マニュアル、プリセットのダウンロード。 「スマートトレンドトレーディングシステム MT5」は、新規および経験豊富なトレーダー向けにカスタマイズされた包括的なトレーディングソリューションです。10以上のプレミアムインジケーターを組み合わせ、7つ以上の堅実なトレーディング戦略を備えており、多様な市場状況に対応する多目的な選択肢となっています。 トレンドフォロー戦略:トレンドを効果的に乗り越えるための正確なエントリーとストップロス管理を提供します。 リバーサル戦略:潜在的なトレンドの反転を特定し、トレーダーがレンジ相場を活用できるようにします。 スキャルピング戦略:高速で正確なデイトレードおよび短期取引のために設計されています。 安定性:すべてのインジケーターはノンリペイント、ノンリドロー、ノンラグであり、信頼性の高いシグナルを保証します。 カスタマイズ:個々の取引の嗜好に合わせ
最初のパルスレベルを反転 (RFI)     指示する     ロシア     -        utilizar con   el indicador の ESP 推奨事項 -   TPSpro トレンド プロフェッショナル版 -   MT5のバージョン 最も重要なことは、将来においても最も重要なことです。 機能のプリンシパル: ゾーンのほとんどは、ベンダーとコンプラドールによってアクティブ化されます。 状況を直感的に把握できるよう、初期の衝動を修正します。 LOGIC AI: MUESTRA zonas (círculos) parabuscar puntos de entrada cuando se activa una plantilla 視覚的に優れた視覚効果があり、最も重要な機能がすべて揃っていることに注意してください。 優れたニベレス/ゾーンの視覚化 (modo MTF) 世界で最も人気のある場所/ゾーンです。これを使用するのに最適な方法です (   TPSproTREND PRO   )。 アルゴリズム プロフェッショナル セパラド パソ ア パソ パラ オペラ それは
Bill Williams Advanced is designed for automatic chart analysis using Bill Williams' "Profitunity" system. The indicator analyzes four timeframes at once. Manual (Be sure to read before purchasing) Advantages 1. Automatically analyzes the chart using the "Profitunity" system of Bill Williams. The found signals are placed in a table in the corner of the screen. 2. Equipped with a trend filter based on the Alligator indicator. Most of the system signals are recommended to be used only accordi
note: this indicator is for METATRADER4, if you want the version for METATRADER5 this is the link:  https://www.mql5.com/it/market/product/108106 TRENDMAESTRO ver 2.4 TRENDMAESTRO recognizes a new TREND in the bud, he never makes mistakes. The certainty of identifying a new TREND is priceless. DESCRIPTION TRENDMAESTRO identifies a new TREND in the bud, this indicator examines the volatility, volumes and momentum to identify the moment in which there is an explosion of one or more of these data a
Elliott Wave Trend was designed for the scientific wave counting. This tool focuses to get rid of the vagueness of the classic Elliott Wave Counting using the guideline from the template and pattern approach. In doing so, firstly Elliott Wave Trend offers the template for your wave counting. Secondly, it offers Wave Structural Score to assist to identify accurate wave formation. It offers both impulse wave Structural Score and corrective wave Structure Score. Structural Score is the rating to sh
Introduction to X3 Chart Pattern Scanner X3 Cherart Pattern Scanner is the non-repainting and non-lagging indicator detecting X3 chart patterns including Harmonic pattern, Elliott Wave pattern, X3 patterns, and Japanese Candlestick patterns. Historical patterns match with signal patterns. Hence, you can readily develop the solid trading strategy in your chart. More importantly, this superb pattern scanner can detect the optimal pattern of its kind. In addition, you can switch on and off individu
IVISTscalp5
Vadym Zhukovskyi
5 (5)
iVISTscalp5インジケーターをご紹介します。このインジケーターは、トレーディングにおいて独自でありながら効果的です。時間データに基づくこのインジケーターは、多年にわたる経験と金融市場の深い分析の結果です。iVISTscalp5インジケーターは、手動トレーディングにとって優れたツールです。便利さ、簡単さ、可視化 - すべての複雑さが内部に隠されています。私たちは、iVISTscalp5インジケーターの設定と使用を最大限に簡素化しました。このインジケーターは、MT5ターミナルにあるすべての金融商品に適しています。 稼働時間は、4時から20時(UTC+3)です。 iVISTscalp5インジケーターメニュー(スクリーンショット1を参照): History - 引用を計算する週数 dT_min - 時間間隔の選択(分) TFline - 水平ボリュームの作成(時間枠) BARSline - 水平ボリュームの作成(バー数) TFtrend1 - デイリーチャンネルの作成(時間枠) BARStrend1 - デイリーチャンネルの作成(バー数) TFtrend2 - 週次チャンネルの作成(時
3 Indicators in 1 indicator Strategy based on price action Made specifically for the best forex currency pairs Can be used in the best time frame of the market at a very reasonable price This indicator is basically 3 different indicatos . But we have combined these 3 indicators in 1 indicator so that you can use 3 indicators at the lowest price. All three strategies are based on price action. But based on different trends. Long term, medium term and short term Attributes : No repaintin
Matreshka
Dimitr Trifonov
5 (1)
Matreshka self-testing and self-optimizing indicator: 1. Is an interpretation of the Elliott Wave Analysis Theory. 2. Based on the principle of the indicator type ZigZag, and the waves are based on the principle of interpretation of the theory of DeMark. 3. Filters waves in length and height. 4. Draws up to six levels of ZigZag at the same time, tracking waves of different orders. 5. Marks Pulsed and Recoil Waves. 6. Draws arrows to open positions 7. Draws three channels. 8. Notes support and re
WHY IS OUR FXACCCURATE LS MT5 THE PROFITABLE ? PROTECT YOUR CAPITAL WITH RISK MANAGEMENT Gives entry, stop and target levels from time to time. It finds Trading opportunities by analyzing what the price is doing during established trends. POWERFUL INDICATOR FOR A RELIABLE STRATEGIES We have made these indicators with a lot of years of hard work. It is made at a very advanced level. Established trends provide dozens of trading opportunities, but most trend indicators completely ignore them!
The SuperTrend MTF indicator is an excellent trend tracking indicator . It can not only display SuperTrend trends within the timeframe of the chart, but also set up to display SuperTrend trends for larger time frames simultaneously . This will be beneficial for grasping trends at a larger time scale and predicting future trends . At the same time, the price of the trend line can also be displayed at a glance, making it easy to observe. Input parameters :  ATR period used at chart timeframe 
Elliot Waves Analyzer Pro calculates Elliot Waves to Help Identify Trend direction and Entry Levels. Mainly for Swing Trading Strategies. Usually one would open a Position in trend direction for Wave 3 or a Correction for Wave C . This Indicator draws Target Levels for the current and next wave. Most important Rules for Elliot Wave Analysis are verified by the Indicator.  The Pro version analyzes Multiple Timeframes and shows the Subwaves and Target-Levels.   For an Overview  " Elliot Waves Anal
"Piranha" - an autonomous trading system that determines overbought and oversold levels on the chart. Red and blue zones represent overbought and oversold levels respectively. Entry points are marked with arrows: a downward arrow in the red zone for "sell" and an upward arrow in the blue zone for "buy". The Take profit level is indicated by the green moving average. Key features: Adjusting the Take profit level as the green moving average changes position. Averaging ability when a new market e
Limited Offer:    Take advantage of our limited-time offer on the FxBears Powers Indicator! When you purchase this powerful tool, you'll also receive the renowned FxBears EA, an expert advisor that automatically executes the indicator's signals. Don't miss out on this unbeatable combination to enhance your trading strategy! No more losses with this indicator, test it for years ago and see if there is losses in one day results. but before testing it please see the explaining video down here. 
Introducing the South African Sniper indicator created by a small group of traders with a few years trading trading the financial market profitably . This is a plug and play indicator that provides you with  BUY and SELL (SNIPER ENTRY) signals with TARGET and trail stops. The indicator Works with all MT5 trading instruments. The indicator uses previous  chart data as receipt to speculate on future market moves.  "The South African Sniper indicator community are very happy with the indicator an
VTrende Pro
Andrii Diachenko
5 (1)
VTrende Pro - MTF indicator for trend trading with a display panel for MT5 *** Videos can be translated into any language using subtitles (video language - Russian) Although the signals of the VTrende Pro indicator can be used as signals of a full-fledged trading system, it is recommended to use them in conjunction with the Bill Williams TS. VTrende Pro is an extended version of the VTrende indicator. Difference between Pro version and VTrende: - Time zones - Signal V - signal 1-2 waves
The indicator is designed to close positions on the market in time. For example: to take profits ahead of schedule if the price has not reached TakeProfit, and the market is turning around. The indicator analyzes the momentum, not the trend. He does not give any information about the trend. The indicator is well suited for finding divergence. The Ershov 38 Parrots indicator dynamically adjusts to the market and detects price movement impulses of medium and high amplitude. It almost does not rea
Scalping Tool for Deriv Description: This trading indicator is designed for traders specializing in scalping. It provides signals for trading in the direction of short-term price movements. The indicator is optimized for use on the M1 timeframe and supports Boom and Crash indices (300, 500, 1000). The indicator will be sold in a limited quantity. Features: Trading direction: towards short-term price movements. Filters and indicators: Reaction volume indicator: displays activity zones. Trend i
クリスマスセール!40% OFF!1月1日に価格が$250に値上がり! GoldenGate Entriesをご紹介します:最先端のトレーディングソリューション! GoldenGate Entries(GGE)を使用して取引する革新的なアプローチを発見しましょう。GGEは、取引体験を向上させるために設計された先進的なインジケーターで、ユーザーに正確性と自信を持たせるための包括的な機能を提供します。 通貨ペア:Any(FX - 商品 - 株式 - 株式 - クリプト) タイムフレーム:15分からH1 主な特徴: 買いと売りの矢印の指示:常に情報を受け取るために、買いと売りの矢印の指示をポップアップアラートとともに受け取ります。 GoldenGate_Algo:GoldenGate_Algoを使用して市場の状況を把握し、市場が「売り過ぎ」または「買い過ぎ」かどうかを評価する強力なツールです。 現在のトレンド分析:視聴中のタイムフレームで現在のトレンドにアクセスして、取引を市場の主流方向に合わせることができます。 組み込みのピボットポイント:組み込まれた
Currently Price  20% OFF  ( for unlimited use ) Indicator   USER MANUAL , trade setups, solving issues, etc :  Direct Download Here     (  for users only  ) Hello World! Introducing.. SMCpro tool and Indicator for  MetaTrader 5 , a cutting-edge feature designed to revolutionize your trading experience. With innovative ICT Smart Money Concept, you gain unparalleled insight into market dynamics, empowering you to make informed trading decisions like never before. SMC Indicator built on th
The iChannels
BeeXXI Corporation
5 (1)
Ultra-fast recognition of parabolic channels (as well as linear, horizontal and wavy channels) throughout the depth of history, creating a hierarchy of channels. Required setting: Max bars in chart: Unlimited This indicator is designed primarily for algorithmic trading, but can also be used for manual trading.  This indicator will have a very active evolution in the near future and detailed descriptions on how to apply to create robots
Introducing the Power Trade Plus indicator designed by a small group of traders with a few years of experience trading the market profitably.  The Power Trade Plus is derived from the Power Trade indicator,  the indicator strive in powerful sniper entries and take profit levels,  with an algorithm that's can determine the markets volatility and Provides entries based on the current market volatility. This indicator is much more effective in stock ,currencies and indices.
How to use Pair Trading Station Pair Trading Station is recommended for H1 time frame and you can use it for any currency pairs. To generate buy and sell signal, follow few steps below to apply Pair Trading Station to your MetaTrader terminal. When you load Pair Trading Station on your chart, Pair Trading station will assess available historical data in your MetaTrader platforms for each currency pair. On your chart, the amount of historical data available will be displayed for each currency pai
プレシジョン・インデックス・オシレーター(Pi-Osc)は、Precision Trading SystemsのRoger Medcalfによるものです。 バージョン2は、チャートにスーパーファストでロードされるように注意深く再コードされ、その他の技術的な改良も組み込まれて、エクスペリエンスを向上させています。 Pi-Oscは、市場が強制的に行かなければならない、すべての人のストップを取り除くためのポイントである、極限のエクソースト・ポイントを見つけるために設計された正確な取引タイミング信号を提供するために作成されました。 この製品は、極限のポイントがどこにあるかを知るという古代の問題を解決し、トレーダーの生活をはるかにシンプルにします。 これは、業界標準のオシレーターとは異なる強力な要素を持つ高度なコンセンサス・インジケーターです。 使用されている一部の機能には、需要指数、マネーフロー、RSI、スティリング、パターン認識、出来高分析、標準偏差の極値などがあり、異なる長さでこれらのバリエーションが多く含まれています。 初めて見ると、訓練されていない目には、他の
PTS - Precision Trading Systemsによるダイバージェンスバイファインダー Precision Divergence Finderは、市場の底を非常に正確に見つけることを目的としており、頻繁に成功しています。 テクニカル分析において、底を選ぶ技術は通常、トップを選ぶよりもはるかに簡単です。このアイテムは、まさにこのタスクのために設計されました。ブルシューダイバージェンスが識別された後、買い物をする前にトレンドが上向きに転換するのを待つのが賢明です。10本または20本のバーの高値を入力するか、移動平均15-30を上昇中に使用してトレンドの変化を特定できます。 この複雑なアルゴリズムは、リアルタイムのバーバーベースでアクティブなデマンドインデックスのダイバージェンスの数を検出し、カウントします。 モデルは、市場価格が新しい安値を付けており、デマンドインデックスが新しい安値を付けていないときに、ダイバージェンスが発生していると観察します。 このインジケーターは、2つの設定を使用します。 1. デマンドインデックス(DI)の長さは、インジケー
[ MT4 Version ] Only the next 10 units at current price! Final price: $299 Are you tired of spending months on demo or live accounts to test your trading strategies? The Backtesting Simulator is the ultimate tool designed to elevate your backtesting experience to new heights. Utilizing Metatrader historical symbol information, it offers an unparalleled simulation of real market conditions. Take control of your testing speed, test ideas quickly or at a slower pace, and witness remarkable improve
Good day! I present to you a trading technical indicator for Deriv broker synthetic indices. This indicator ONLY works with the following indices: Boom 300 Index Boom 500 Index Boom 1000 Index Crash 300 Index Crash 500 Index Crash 1000 Index The indicator was created to give signals to open medium-term trades in the direction of Spikes. But you can open trades in the opposite direction to Spikes, at your own risk. Trade only on M1. Other TFs do not guarantee the correct operation of the indic
トレンドに乗りましょう。はい、買いでも売りでも、15分枠でエントリーシグナルを待ち、30分枠でシグナルが現れたらシグナルを確認します(シグナルが現れるまでに1時間以上かかる場合もあります。戻ることができます) 15分足に戻り、30分足に戻り、メインシグナルが現れるまでこれを繰り返し、30分足にシグナルが出たら価格でエントリーし、描画ラインが変化した時点で利益確定となります。 、利益が確定したとき、または反対のシグナルが現れたとき これは非常にシンプルで、すべての主要通貨で機能します。  メタル、インジケーター、すべてのフレームですが、最も良い結果は 30 分フレームです。 ストップロスは常にローソク足の底値よりも下に設定し、資本管理を超えてはなりません 資本金の10%
作者のその他のプロダクト
AI Channel
Thalles Nascimento De Carvalho
3.67 (3)
Welcome to the presentation of the AI Channel indicator, a powerful tool that uses artificial intelligence for price channel analysis in the financial market. In this session, we will explore how this revolutionary indicator can assist investors and traders in making more informed and strategic decisions. Let's get started! I. What is the AI Channel indicator? AI Channel is an indicator developed based on advanced artificial intelligence algorithms. It utilizes historical price data of financial
FREE
Swing Point Volume
Thalles Nascimento De Carvalho
Swing Point Volume, the indicator that signals weakness and strength at the tops and bottoms. This indicador can be for used the Wyckoff Method. Information provided; - Swing on customized ticks. - Volume and points in each balance sheet. - Percentage of Displacement. - Sound alert option on top and bottom breaks. - Volume in ticks and Real Volume. - Volume HL (extreme) or (opening and closing) - Customized volume shapes.
Atr Projection
Thalles Nascimento De Carvalho
ATRプロジェクション指標は、金融市場における価格の潜在的な動きの限界について正確な洞察を提供するために設計され、テクニカル分析において堅牢なツールとして際立っています。その柔軟なアプローチにより、ユーザーは各取引資産の特定のニーズに適応する形で直感的に分析メトリクスをカスタマイズすることが可能です。 カスタマイズ可能な動作: ATRプロジェクションは、デフォルトでは過去100本のローソク足の平均の30%を考慮して動作します。この柔軟性により、ユーザーは好みや各資産の固有の特性に合わせてメトリクスを調整でき、よりパーソナライズされた分析が可能です。 30%および100本のローソク足の選択の裏にある論理: 慎重な割合とローソク足の数の選択は、過去の動きを正確に捉え、より精密なプロジェクションを提供することを目的としています。この戦略的なアプローチは、価格が有意な動きの可能性が高い領域を強調し、トレーダーにより情報を提供します。 ATRプロジェクションの利点: 1. カスタマイズ可能なテクニカル精度: ユーザーは各取引資産の特定の条件に合わせてメトリクス
Box Weis Wave
Thalles Nascimento De Carvalho
5 (1)
Weis Wave Boxで分析を次のレベルへ! 精度と明確さを求めるトレーダーのあなたに、 Weis Wave Box は最適なツールです。この先進的なインジケーターは、ボリュームの波とスイングポイントの詳細な視覚分析を提供し、市場における努力と結果の関係をよりよく理解する手助けをします。 Weis Wave Boxの主な特徴: カスタマイズ可能なボリューム波: 自分の取引戦略に合わせてティック単位でボリューム波を調整できます。 調整可能な履歴: 特定の時間期間に焦点を当てて、より正確で関連性のある分析を行えます。 ティックと実際のボリューム: ティックと実際のボリュームを明確に区別し、より包括的な市場ビューを提供します。 上部のボックス可視化: ボリューム(エネルギー)が最も高かった場所と価格の変動が少なかった場所を明確に視覚化します。この視覚化により、努力と結果の関係を特定し、どの力が優位に立っているかを示し、将来の価格変動の可能性を示唆します。 ️ カスタマイズ可能なスイング形式: totalVol、length、width、barDVol、l
Long Short Pro
Thalles Nascimento De Carvalho
Long & Short インジケーター - Pro バージョン: 市場分析の無限の可能性を解き放とう! すべての資産に制限なし Long & Short インジケーターの Pro バージョンは、すべての金融資産に対して完全な自由を提供します。制限なしで、同じインジケーターをお気に入りのすべての資産に適用できます! 制限なし インジケーターのすべての機能を制限なしでお楽しみください。Pro バージョンは、完全かつ無制限の体験を提供し、市場のあらゆる機会を最大限に活用できるようにします。 Pro バージョンの特徴 無制限のアクセス : インジケーターをすべての金融資産で使用し、その完全な可能性を探ります。 高度な精度 : 詳細な分析と明確なシグナルを活用して、情報に基づいた安全な決定を下すことができます。 完全な柔軟性 : 資産や戦略に関係なく、取引のニーズに合わせてインジケーターを調整します。 重要な機会のアラートを受け取る アラートを有効にして、重要なレベルを注意深く監視し、市場機会の最前線に立ち続けましょう。 EA 作成のためのバッファ
Reversal Vol Propagation
Thalles Nascimento De Carvalho
Are you tired of missing out on trading opportunities by not being able to identify price reversals in time? Do you want to maximize your profits and make informed trading decisions? Introducing the Reversal Vol Propagation Indicator, the revolutionary tool that uses neural networks and volume data to predict potential price reversals. Based on a powerful combination of advanced algorithms and cutting-edge technology, the Reversal Vol Propagation meticulously analyzes volume patterns and past pr
Didi Index Volume
Thalles Nascimento De Carvalho
Didiインデックスボリュームをご紹介します。これは、ブラジルのトレーダーであるオディール・アギアールによって開発されたテクニカル分析の指標であり、金融市場での機会を特定するための先進的かつ強力なアプローチで注目されています。さまざまなプラットフォームで利用可能なDidiインデックスボリュームは、正確な洞察と貴重な情報を求めるトレーダーにとって不可欠なツールとなっています。 この指標は、オディール・アギアールによって作成された名高いDidiインデックスと、取引量の知恵を駆使した組み合わせです。この組み合わせにより、価格の動向と取引量の相互作用をより深く分析し、資産の動きに対するユニークな視点を提供します。 洗練されたアルゴリズムと加重平均の計算を用いて、Didiインデックスボリュームは取引量に基づいた価格変動を予測することができます。この特徴は、新興トレンドの特定、市場の反転、そして適切なエントリーポイントや出口ポイントのタイミングを把握する上で非常に重要です。 Didiインデックスボリュームを使用することで、正確な市場の解釈が可能な客観的かつ信頼性の高い情報にアクセ
Smart Binary Volume
Thalles Nascimento De Carvalho
スマートバイナリーボリューム指標は、トレーディングボリュームの分析と機械学習を組み合わせた多目的なツールです。スキャルピングや他の短期取引戦略を含むさまざまな市場や戦略に適用できます。高度な機械学習アルゴリズムを使用して、この指標は複雑なパターンを識別し、より正確な買いシグナルと売りシグナルを生成します。 Buffer to Create EA. Buffer Line Gold = 0. Buffer Line Red = 2 Buffer   AI  =  3 AI Buffer  >=  0  ("SIGNAL BUY") AI Buffer  <=  0  ("SIGNAL SELL") 使用上のヒント: 1. 反対の場合に注意してください:Smart Binary Volumeインジケーターのラインが反対の動きを示す場合に注意してください。この条件はエントリーシグナルを示す可能性があります。 2. 上昇のシグナル:青いラインが0.30より上にある場合、そして赤いラインが-0.30以下の領域にある場合に注意してください。この配置は上昇トレンドを
TimeChannel
Thalles Nascimento De Carvalho
The "Timechannel" is a powerful technical analysis tool designed specifically for traders who want to gain deeper and more accurate insights into price movements across multiple timeframes (multi-timeframe). This indicator is an essential addition to the toolbox of any serious trader seeking to make informed and data-driven trading decisions. Key Features: Advanced Multi-Timeframe Analysis : Timechannel allows traders to analyze price movements on different timeframes simultaneously. This is cr
DeltaBook
Thalles Nascimento De Carvalho
デルタブックインジケーターは、ボリュームデルタの使用とオーダーブックからの情報を組み合わせて、株式、先物、仮想通貨などの金融市場で価格の動きを検出する強力な市場分析ツールです。デルタブックはその最大の潜在能力を引き出すためにリアルタイムのボリュームデータとオーダーブック情報へのアクセスが必要です。 デルタブックの主要な特徴は、市場参加者の行動に関する詳細な情報に基づいてトレンドや取引機会を特定できる高度な市場分析戦略です。以下はデルタブックインジケーターを説明するためのいくつかのヒントと重要な要点です: ボリュームデルタ:ボリュームデルタは特定の時間枠内の買い手(需要)と売り手(供給)のボリュームの違いです。この指標は買い手と売り手の不均衡を数量的に示し、市場での買いと売りのプレッシャーの変化を特定するのに役立ちます。 オーダーブック:オーダーブックは市場のすべての買い注文と売り注文のリアルタイムの記録です。トレーダーが資産を買いたい価格や売りたい価格、それらの価格で取引したい資産の数量を表示します。デルタブックはオーダーブックの情報を使って市場参加者の行動を分析します。 価格の流れ:
Big Player Range
Thalles Nascimento De Carvalho
5 (1)
「BigPlayerRange」の力を発見:市場のテクニカル分析におけるあなたの味方 BigPlayerRange をご紹介します。これは市場での機関投資家の関心エリアを明らかにするために設計された先進的なテクニカル分析ツールです。このツールを使えば、主要な市場参加者がどこで積極的に関与しているかを正確に特定し、これがあなたの取引戦略にどのように影響するかを理解することができます。 主な特徴: 機関投資家の関心エリアのマッピング : BigPlayerRange は、機関投資家の活動が高いゾーンを強調表示し、市場の潜在的な動きについて貴重な洞察を提供します。 出口参考の予測 : インジケーターは、2段階での可能な出口を提案するために予測を使用し、将来の価格動向に基づいた戦略の計画をサポートします。 リトレースメントの確率 : 価格が特定された範囲に戻ったときのリトレースメントの可能性を評価します。この機能は、リスク管理や戦略の調整に役立ちます。 BigPlayerRangeの使い方: 関心エリアの特定 : インジケーターを使用して、機関投資家の活動が高いエリア
Master OBV
Thalles Nascimento De Carvalho
MasterOBV:市場のトレンドを正確に把握しよう! MasterOBV は、 ボリューム 、 ポジティブコレレーション 、および 移動平均線(MA) を組み合わせた テクニカル分析指標 で、金融市場でのトレンドの識別を向上させます。 主な機能: スマートボリューム: 取引量を分析し、トレンドの強さにおける重要な変化を特定します。 ポジティブコレレーション: 相関のある資産を組み合わせ、ペアのボリュームに基づいて価格の移動の可能性を強化する、より広範で正確な視点を提供します。 ビジュアルチャンネル: ビジュアルチャンネルを利用して、トレンドの継続と反転の可能性を明確かつ正確に評価し、直感的な視覚分析を提供します。 スムーズな移動平均線: MA が価格の変動を平滑化し、基礎的なトレンドの方向を特定しやすくします。 なぜ MasterOBV を選ぶべきか? 決定の自信: 複数の要素を統合し、自信を持ってエントリーとイグジットの決定ができるようにします。 包括的な分析: 価格だけでなく、ボリューム、資産の相関関係、およびビジュアルチャンネ
Smart Delta Volume
Thalles Nascimento De Carvalho
Smart Delta Volume: ダイナミックな市場条件に適応する精密なツール Smart Delta Volume は、絶えず変化する市場の状況に対応するために設計された、高度なテクニカル指標です。このインジケーターは、ボラティリティに応じて自動的に調整されるダイナミックなレベルを利用して、出来高の流れと価格の動きの相互作用について、より包括的で信頼性の高い視点を提供します。この適応力は、特にボラティリティの高い市場で、迅速かつ正確なインサイトを求めるトレーダーにとって非常に重要です。 リトレースメントの客観的な確認: 偽シグナルを減らし、信頼性を向上させる Smart Delta Volume の最も強力な機能の1つは、そのリトレースメントのバリデーターです。この機能は、価格が2つのダイナミックなレベルを越えたときに自動的に作動し、リトレースメントの有効性を確認します。この客観的な確認は、リスクを最小限に抑え、偽シグナルを回避したいトレーダーにとって不可欠です。リトレースメントを確認することで、このインジケーターは特定されたトレンドへの信頼を高め、より情報に基づい
VolaMetrics VSA
Thalles Nascimento De Carvalho
VolaMetrics VSA | 技術分析の強力な味方 VolaMetrics VSA は、 Volume Spread Analysis (VSA) メソッドと詳細な 取引量分析 を組み合わせた技術分析指標です。 価格の重要な動き を 特定 し、 追跡 するために設計されたこのツールは、 取引量 と 価格スプレッド の相互作用を利用して、トレーディング決定をサポートする貴重な洞察を提供します。 Volume Spread Analysis (VSA) の基礎 Volume Spread Analysis (VSA) は、技術分析で尊敬されているメソッドで、 取引量 、 価格スプレッド 、および 価格の終値 の関係を特定の期間内で理解することに焦点を当てています。最も情報を持つオペレーター( スマートマネー )が価格の動きに影響を与えるという考えに基づき、VSA は 積み上げまたは分配のシグナル を特定し、価格の重要な変化を予測します。 VolaMetrics VSA の機能 ️ VolaMetrics VSA は、従来の VSA 分析を自動化し、 逆転の可能性があるシ
SwingVolumePro
Thalles Nascimento De Carvalho
概要 SwingVolumePro は、幅広い金融資産に適用できる高度で多用途なインジケーターであり、さまざまな取引スタイルをサポートします。厳密なボリュームと価格の分析に基づいて開発されており、すべてのレベルのトレーダーが高品質のデータに基づいて情報に基づいた意思決定を行うための明確で正確なシグナルを提供します。 主な特徴 多用途性: SwingVolumePro は、株式、外為(フォレックス)、暗号通貨など、さまざまな資産に適用できます。スキャルピングから長期ポジションまで、さまざまな取引戦略に対応しています。 正確で信頼できるシグナル: 高精度なシグナルを提供することに重点を置いているSwingVolumeProは、価格吸収パターンや市場のアグレッションを特定するために高度な技術を使用しています。これらのシグナルは明確に表示され、迅速かつ効果的な意思決定が容易になります。 高度なボリュームと価格の分析: インジケーターは、ボリュームと価格の相互作用の詳細な分析を使用して、努力と結果の間にズレがある状況を検出し、市場の潜在的な動きを示唆します。
CVD SmoothFlow Pro
Thalles Nascimento De Carvalho
CVD SmoothFlow Pro - すべての資産に対応した無制限のボリューム分析! CVD SmoothFlow Pro は、精密で無制限のボリューム分析を求めるトレーダーに最適なソリューションです。Cumulative Volume Delta(CVD)の計算と高度なノイズフィルタリングを使用することで、プロ版はあらゆる金融資産の取引に必要な柔軟性と精度を提供します。 CVD SmoothFlow Pro が提供するもの: クリアな分析 :ノイズをフィルタリングし、すべての金融資産における重要なボリュームの動きを際立たせます。 ️ 正確な計算 :買いと売りの差を監視し、外為、インデックス、暗号通貨などの資産におけるボリュームの詳細な動きを提供します。 直感的なインターフェース :データの表示が明確で、分析がわかりやすく効率的です。 トレンドの特定 :市場のトレンドを自信を持って特定し、情報に基づいた意思決定をサポートします。 実用的な用途: リアルタイムで任意の資産における買い手と売り手のバランスを監視します。 ボリュームに基づいてトレンドの反転
フィルタ:
レビューなし
レビューに返信
バージョン 1.2 2024.09.01
使用説明が追加され、インジケーターがさまざまなインストゥルメントに適応されました。