Dynamic Forex28 Navigator
- インディケータ
- Bernhard Schweigert
- バージョン: 1.4
- アップデート済み: 24 3月 2025
- アクティベーション: 5
Dynamic Forex28 Navigator - 次世代の Forex 取引ツール。
現在 49% オフ。
Dynamic Forex28 Navigator は、長年人気のインジケーターを進化させたもので、3 つの機能を 1 つにまとめています。
- Advanced Currency Strength28 インジケーター (レビュー 695 件) +
- Advanced Currency IMPULSE with ALERT (レビュー 520 件) +
- CS28 コンボ シグナル (ボーナス)。
インジケーターの詳細 https://www.mql5.com/en/blogs/post/758844
次世代の Strength インジケーターが提供するもの
- オリジナルで気に入っていたすべての機能が、新機能と精度の向上によって強化されました。
主な機能:
独自の通貨強度計算式。
- すべての時間枠でスムーズかつ正確な強度ライン。
- トレンドの特定と正確なエントリーに最適です。
ダイナミックマーケットフィボナッチレベル (マーケットフィボナッチ)。
- このインジケーターに固有のユニークな機能。
- フィボナッチは価格チャートではなく通貨の強度に適用されます。
- 正確な反転ゾーンのためにリアルタイムの市場活動に適応します。
リアルタイムの市場モメンタム。
- 9番目のラインは、市場がアクティブかパッシブかを示します。
- 取引のタイミングに不可欠です。
包括的なアラートと表示。
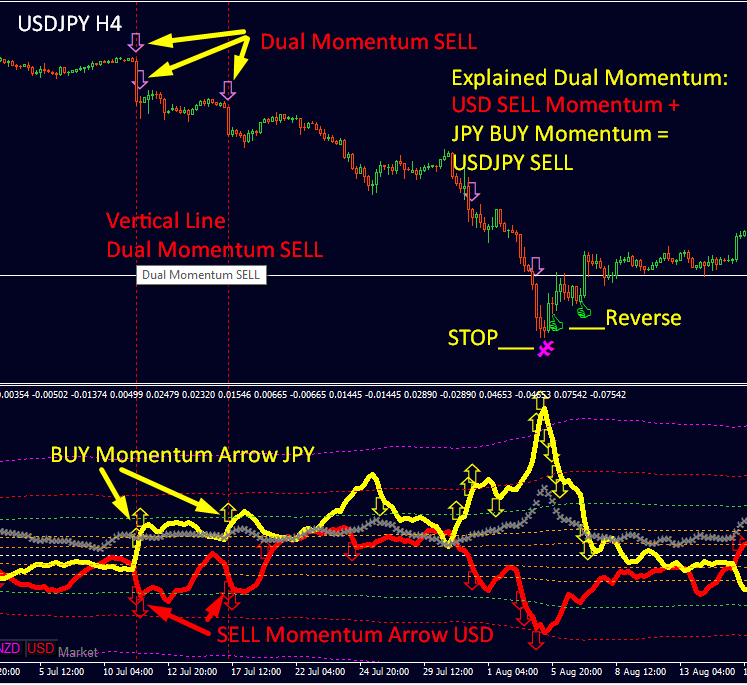
- 各通貨の最強の買いと売りのモメンタム。
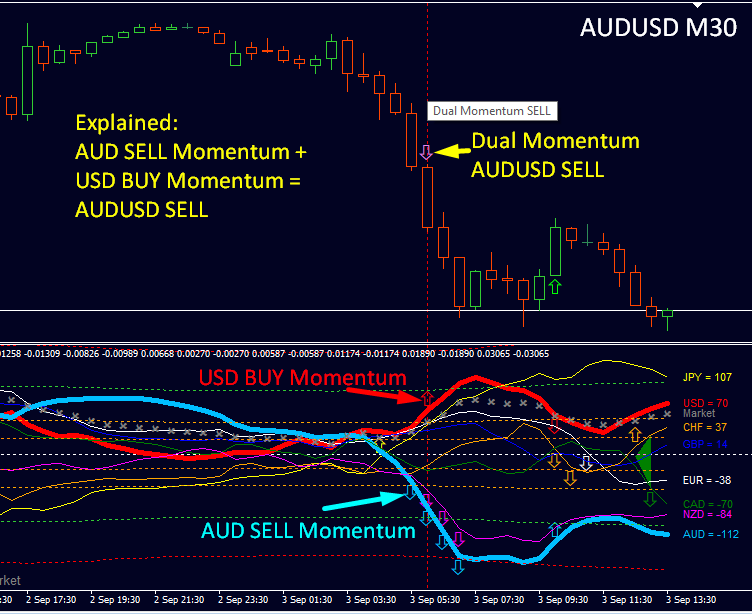
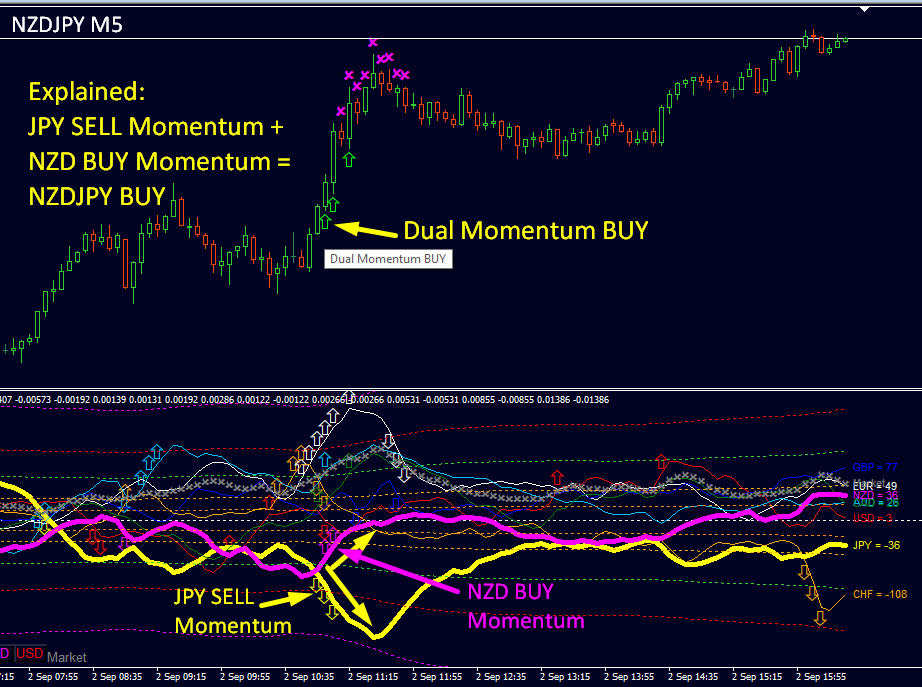
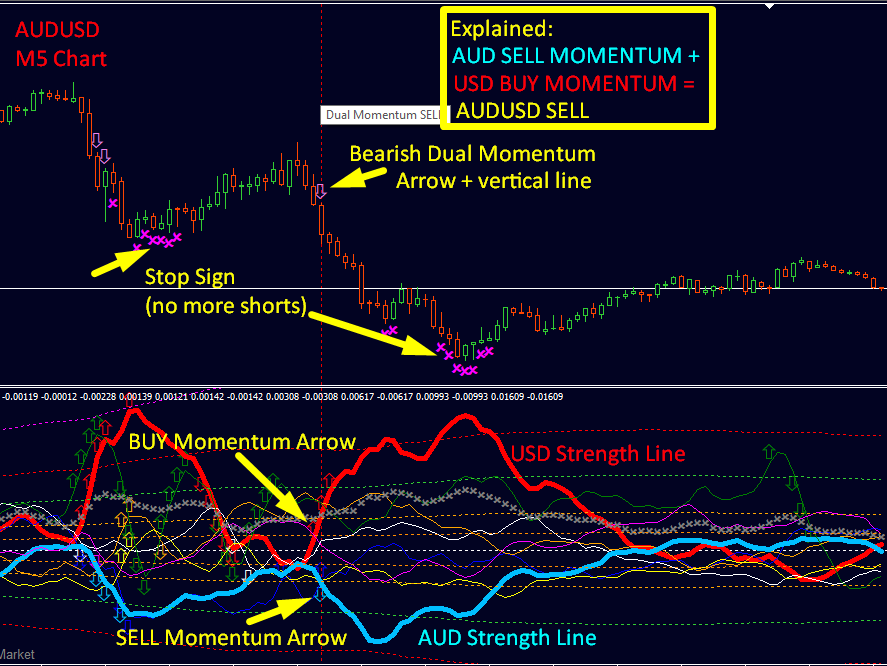
- 28ペアのデュアルモメンタム買いと売り。
- 買われすぎ/売られすぎの警告、範囲外とストップ。
- 反転とプルバックのアラート。
- 特別なクロスレベルパターン通知。
最適化されたパフォーマンス。
- データ呼び出しを減らしてブローカーフィードを高速化。
- 信頼性を高める自動サポートチャート。
ユーザーフレンドリーなインターフェース。
- チャート切り替えボタンが速い。
- 明確なシグナルと情報を備えた直感的なレイアウト。
対象者:
- 初心者からエキスパートまで、すべてのトレーダーに適しています。
- 取引戦略で通貨の強さを活用したい方に最適です。
開始方法:
Dynamic Forex28 Navigator で取引を向上させましょう。Forex 市場で優位に立つために必要な洞察とツールを手に入れましょう。
ユーザーマニュアル: こちらをクリックしてください https://www.mql5.com/en/blogs/post/758844
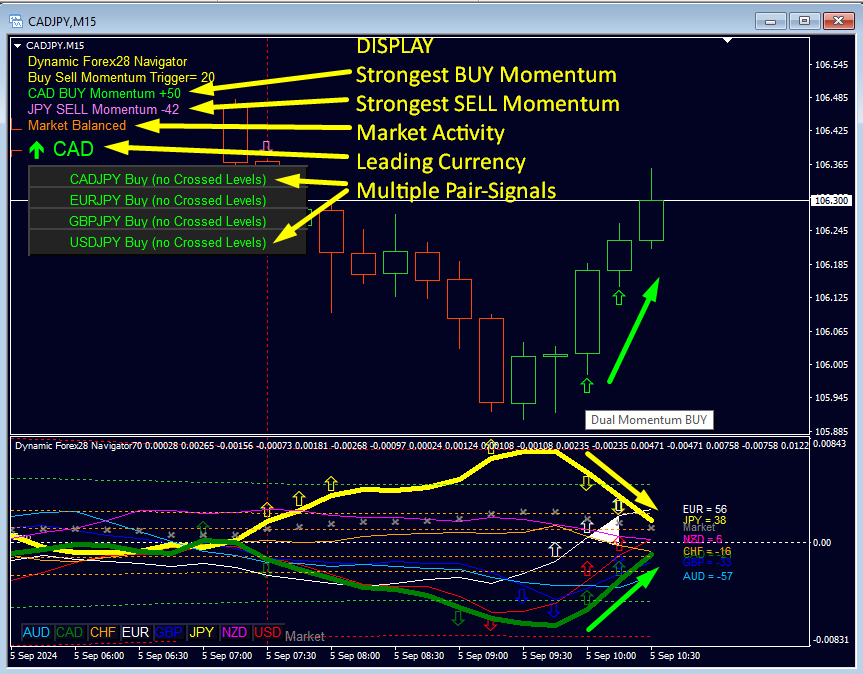
Dynamic Forex28 Navigator の新しい表示の概要。
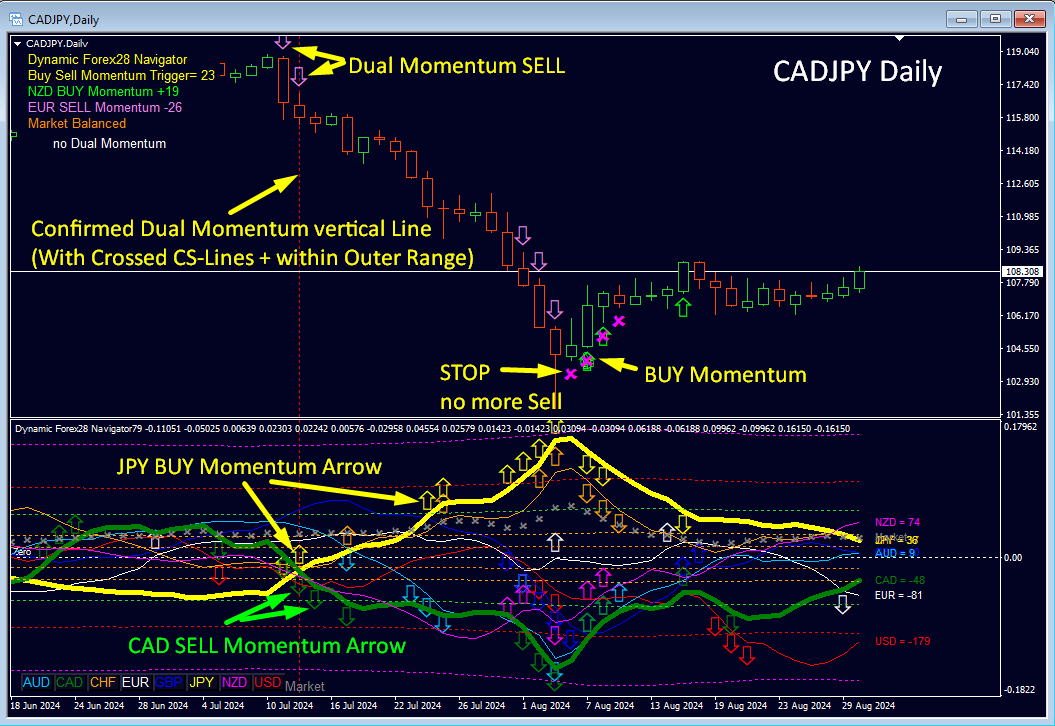
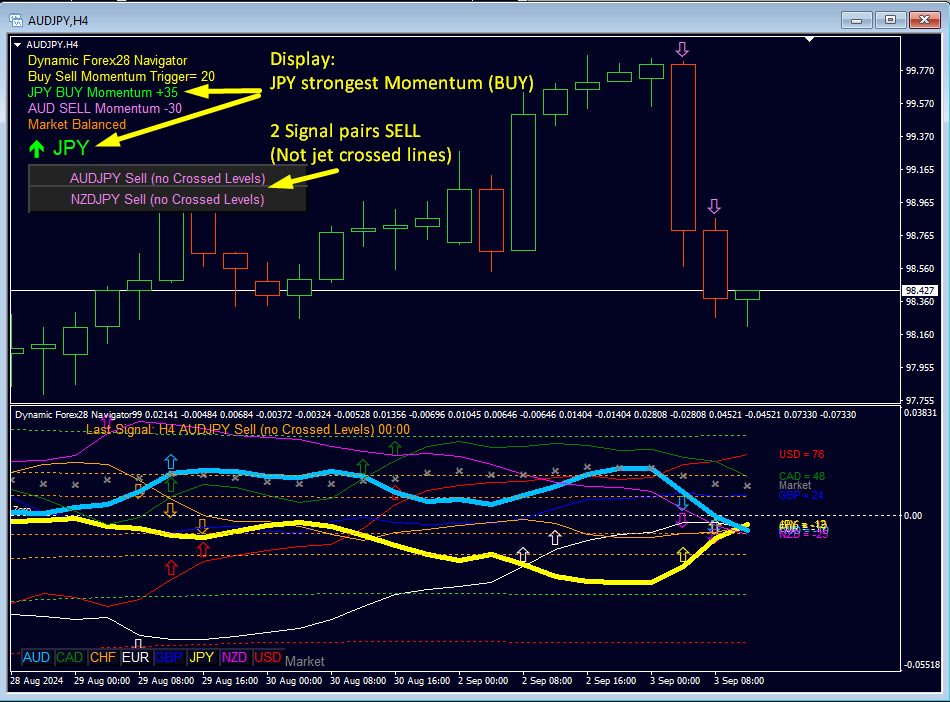
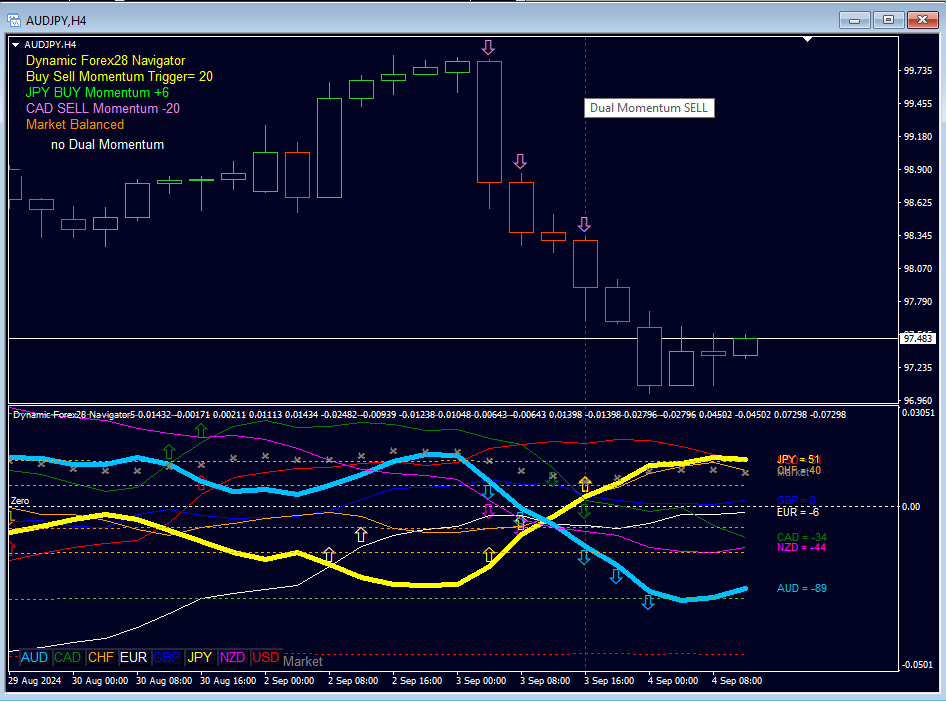
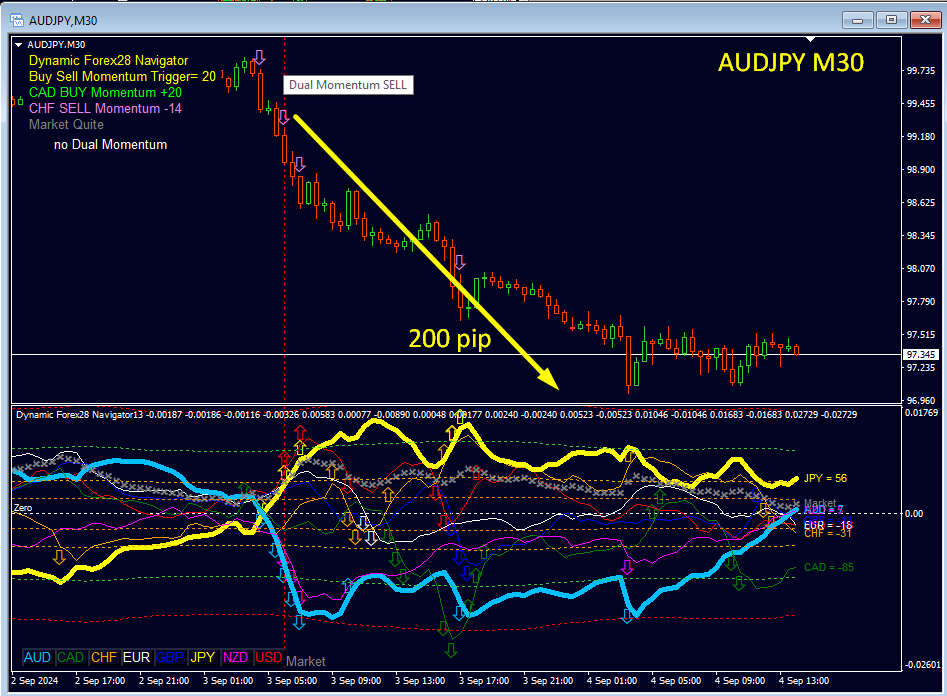
- モメンタム変更トリガー 23。説明: 現在のモメンタム値入力が 23 に設定されていることを示します。指定された条件が満たされると、BUY & SELL モメンタム矢印がトリガーされます。
- BUY モメンタム。説明: 最も強い上昇モメンタムを持つ通貨 (例: NZD 27 買いモメンタム) を表示し、値を緑色で表示します。
- 売りモメンタム。説明: 最も強い下降モメンタムを持つ通貨 (例: USD -29 売りモメンタム) を表示し、値を赤色で表示します。
- 市場アクティビティ。説明: リアルタイムおよび市場全体の状況を 5 つのステータスで提供し、ボラティリティの高い期間には「市場が不安定!!」などの警告を表示します。
- 絶対通貨モメンタム。説明: 最も強いまたは最も弱い、最も強い買いおよび売りモメンタムを持つ通貨を強調表示し、トレーダーに重要な市場の動きの概要を提供します。
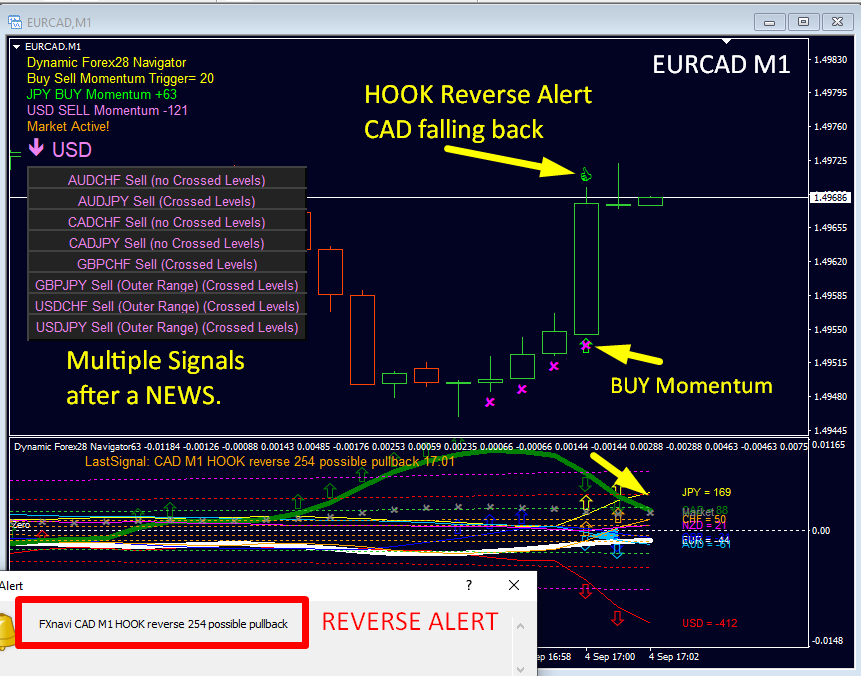
- クローズドバーの BUY/SELL (アラート付き) のデュアルモメンタムシグナル。説明: 指定された条件を満たす複数のシグナルをリストし、デュアルモメンタムを示します。各シグナルには、通貨ペア、アクション(買い/売り)、および通貨が外側の範囲を越えたか、外側の範囲に到達した条件(「交差レベル」および「外側の範囲」)の確認が含まれます。シグナルをクリックすると、対応するチャートが開きます。
バーの終値で取引し、再描画は行いません。
ダイナミック Forex28 ナビゲーターの主な入力パラメータ。
買いと売りのモメンタム設定。
- フィボナッチ スロープ (18-26) で買いと売りのモメンタムをトリガーします。モメンタムを示すために、買いと売りのモメンタム マーケット フィボナッチ レベル (23 スロープ) を設定します。
- 買いと売りのモメンタム矢印を描画します (サブウィンドウ)。チャートのサブウィンドウに矢印を表示して、強い通貨の買いと売りのモメンタムを示します。
デュアル モメンタム アラート設定。
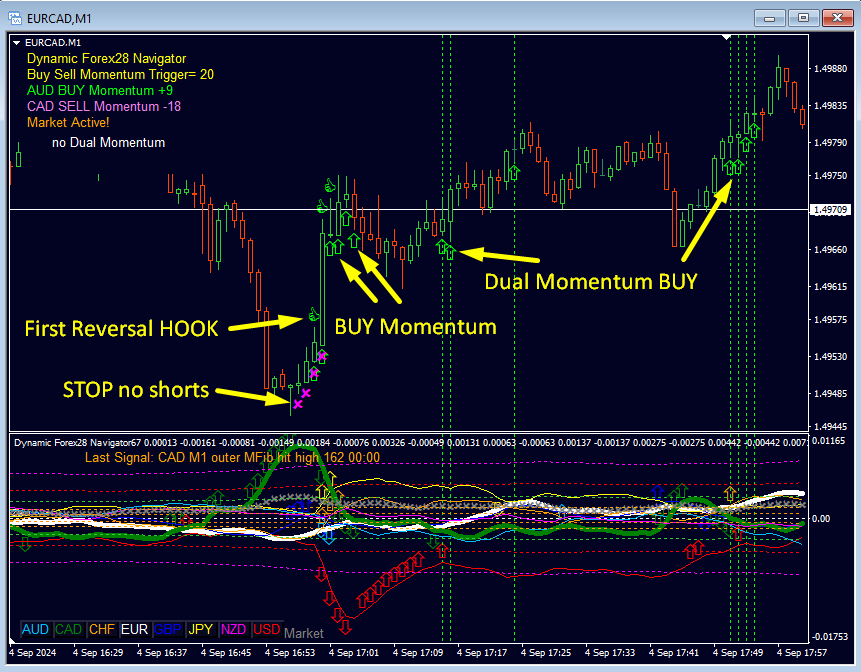
- デュアル モメンタムの矢印を描画します (メイン ウィンドウ)。検出されたすべてのデュアル モメンタム シグナル (ベース通貨とクォート通貨の強いモメンタム) の矢印を表示します。
- デュアル モメンタムに V ラインを描画します。フィルターを使用して、確認済みのデュアル モメンタム シグナルに垂直線を描画します。
- デュアル モメンタムをアラートします。
デュアル モメンタム フィルター設定。
- 範囲外情報を表示。チャートに範囲外情報を表示して、より適切な分析を行います。
- 外側の外側範囲最大レベル (100-161)。売られすぎ/買われすぎゾーンの外側の外側範囲最大レベルを設定します。
- CS 交差レベル情報を表示。外側範囲情報とともに交差レベルを表示します。
CS アラート設定。
- アラート外側範囲トリガー HIT。通貨の強さが外側範囲市場のフィボナッチ レベルに達したときにアラートします。
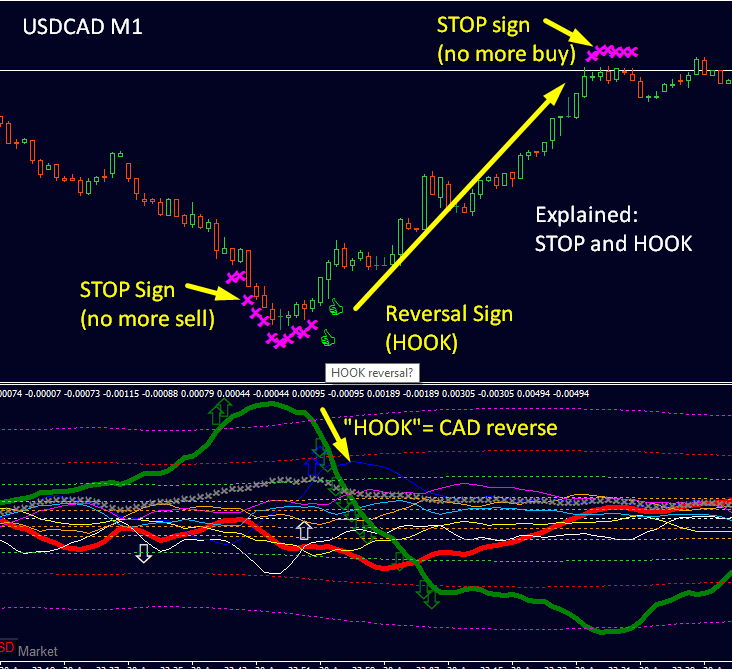
- アラート外側範囲トリガー HOOK。通貨の強さが外側範囲から低下したときにプルバック/反転のアラートを送信します。
設定リバーサルまたは終了。
- アラート外側レベル HIT。外側範囲フィボナッチにヒットしたときにアラートします。
- アラート外側レベル HOOK (リバーサル)。潜在的なリバーサルに対してリバーサル HOOK をアラートします。
- HOOK 外側フィボナッチ トリガー レベル (161-262)。上記のフィボナッチ レベル。
- フック最小デュアル モメンタム (20-48)。
- 反転フック矢印(つまみ)を描きます。
- 外側フィボナッチストップを描きます。チャート上の外側の市場フィボナッチストップレベルを示します。
- 外側フィボナッチストップ値(100-261)。上記の最小フィボナッチ。
CS クロスアラート設定。
- 通貨クロスレベル機能を有効にします。主要な市場シグナルの通貨クロスレベルサインを有効にします。
- クロスフィボスロープ(20-46)。最小デュアルモメンタム。
- 通貨クロスレベルをアラートします。有効にすると、通貨クロスレベルイベントのアラートが発生します。
一般アラート設定。
- ポップアップアラートを有効にします。主要な市場イベントのポップアップアラートをオンにします。
- 電子メールアラートを送信します。通貨の強さのシグナルの電子メールアラートを送信します。
- プッシュ通知を送信します。アラートのプッシュ通知を携帯電話に送信します。
その他の設定。
- クイックチャートを新しいウィンドウで開きます。 2 つの通貨名またはアラート ボタンをクリックすると、チャートをすばやく切り替えることができ、新しいペアが別のウィンドウで開きます。
- サポート チャートを開く。ブローカー フィードを最新かつ信頼できる状態に保つために、サポート チャートを開きます。
- アラートからペアを除外する。コンマ区切りのリストを使用して、アラートから除外するペアを指定します。
- エキスパート (EA) に PIN を使用する。パフォーマンスを向上させるために、エキスパート アドバイザーに PIN を送信します。
ヒント:
- 私のテンプレートを使用します。スターター パックを要求するメッセージを送信してください。
- インジケーターを中断したくない場合は、「新しいウィンドウでチャートを開く」を使用します。
- より高い時間枠のトレンド (モメンタム) 内にとどまります。
- トレード設定として通貨デュアル モメンタムを探します。
- 特別: MT4 チャート履歴を更新するには、7 つのサポート チャートが開きます (マニュアルを参照)。この機能は無効にできます。
- 取引システムとトレード例については、プロフィールのニュースとブログを確認してください。
質問がある場合はいつでもお手伝いします。今後もグリーンピップが沢山出ることを祈っています。
よろしくお願いいたします、ベルンハルト
(注: このページは自動翻訳されています。元の英語版については、https://www.mql5.com/en/market/product/122172 をご覧ください)


Outstanding Product – Reliable and Effective!