HiperCube Market Profile
- インディケータ
- Adrian Lara Carrasco
- バージョン: 1.1
HiperCube Market Profile !
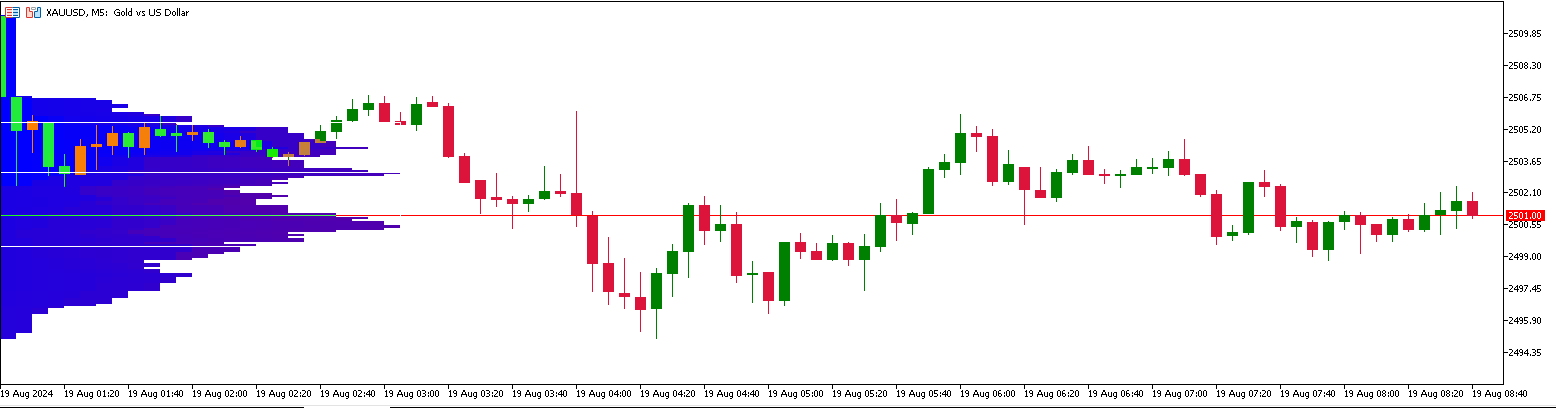
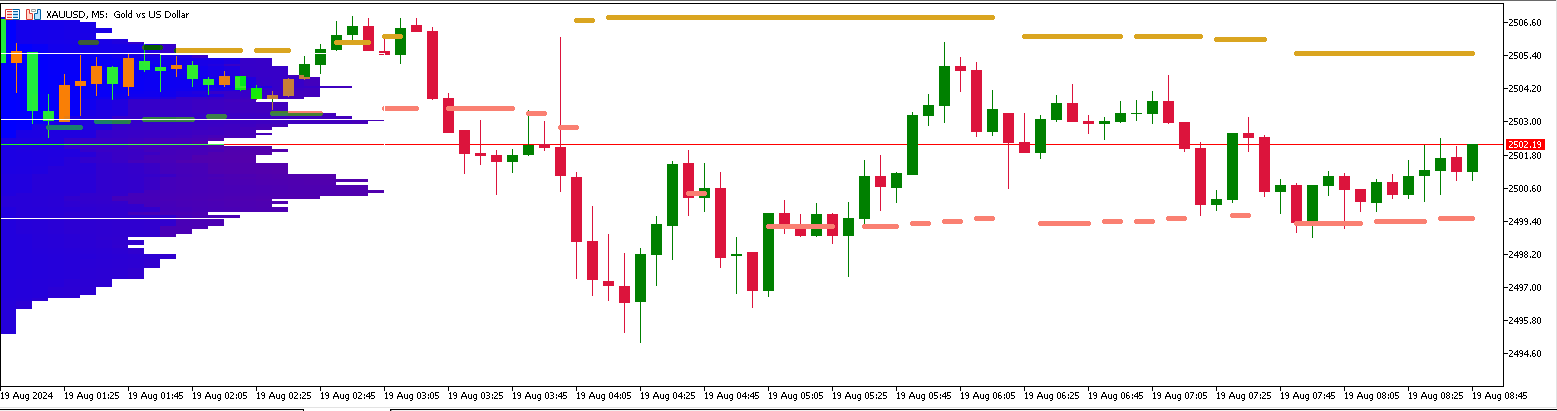
A Market Profile is a graphical representation that combines price and time information in the form of a distribution. It displays price information on the vertical scale (y-axis) and volume information on the horizontal scale (x-axis). This chart type provides insights into market activity, allowing traders to visualize and evaluate fair market value in real-time.
Features:
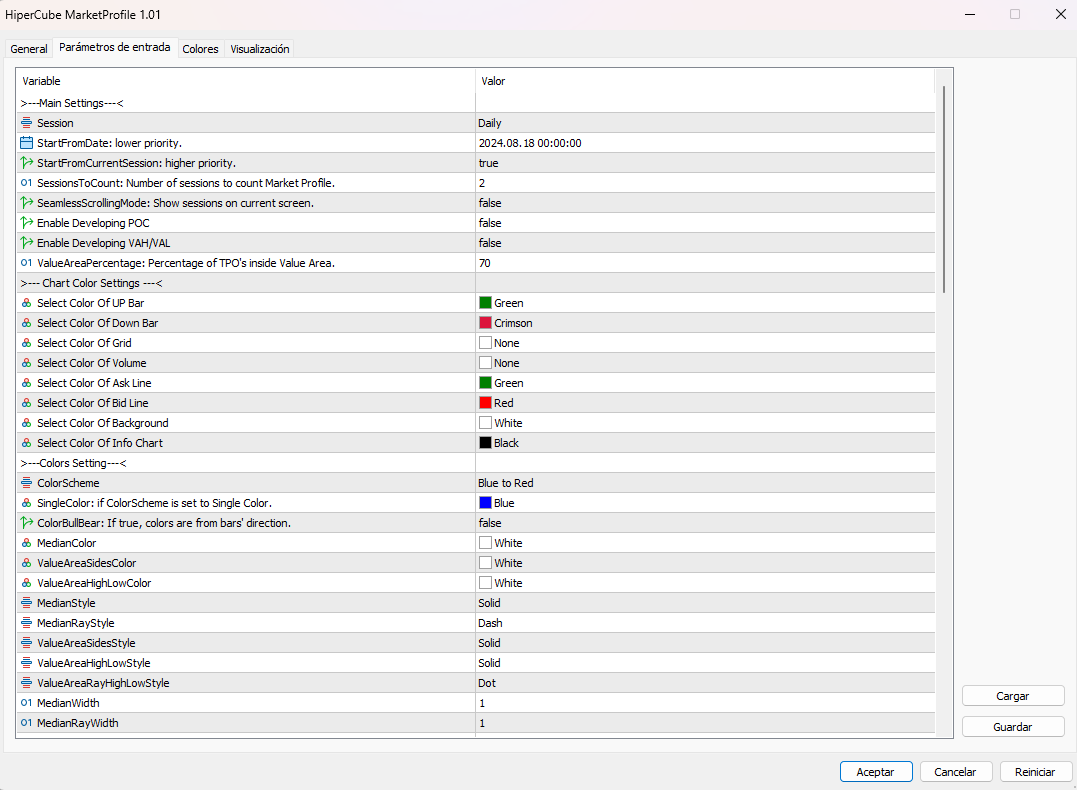
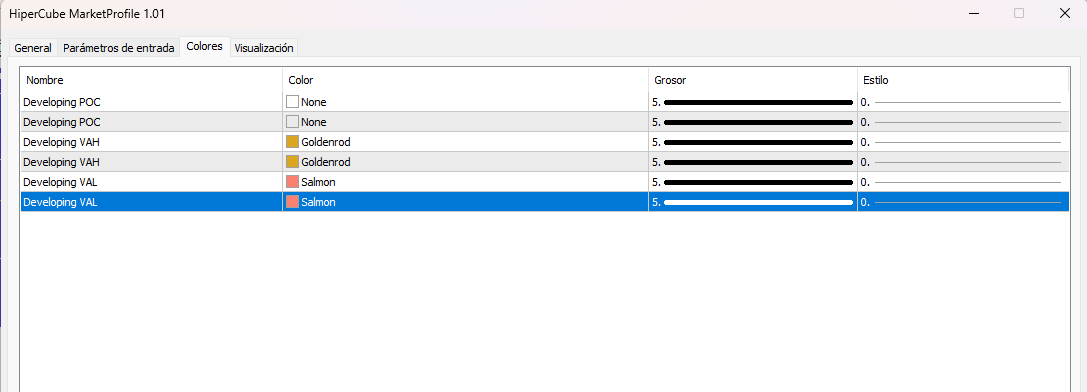
- Custom Colors
- Custom Chart
- Clearly info on Chart
- Graph and attractive interface
- Setting to configure your style