Thi Uni Gt Pro
- インディケータ
- Mr Thiti Chunsangsook
- バージョン: 1.0
- アクティベーション: 5
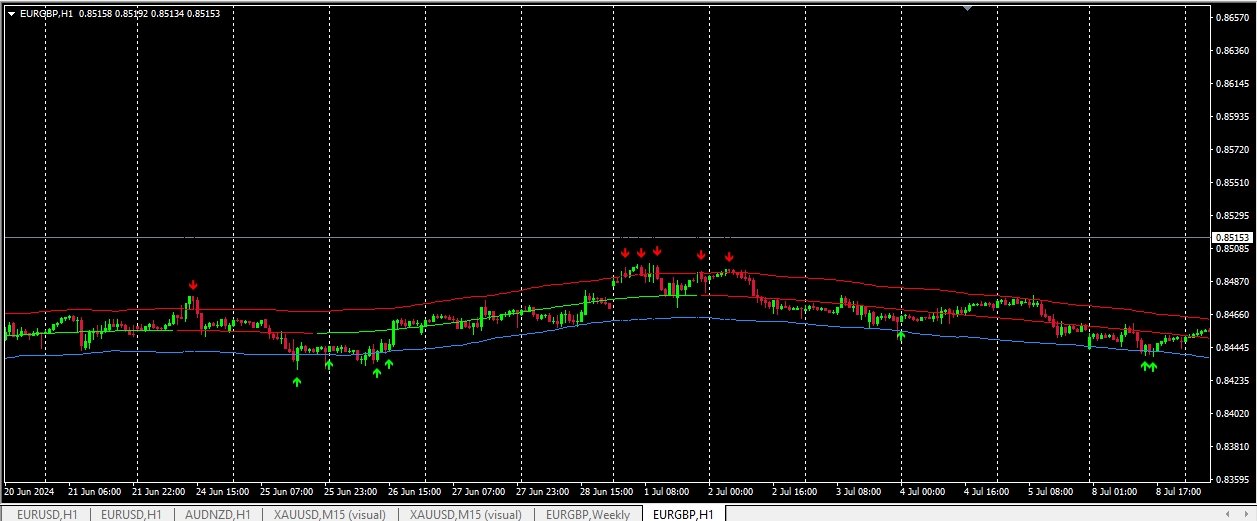
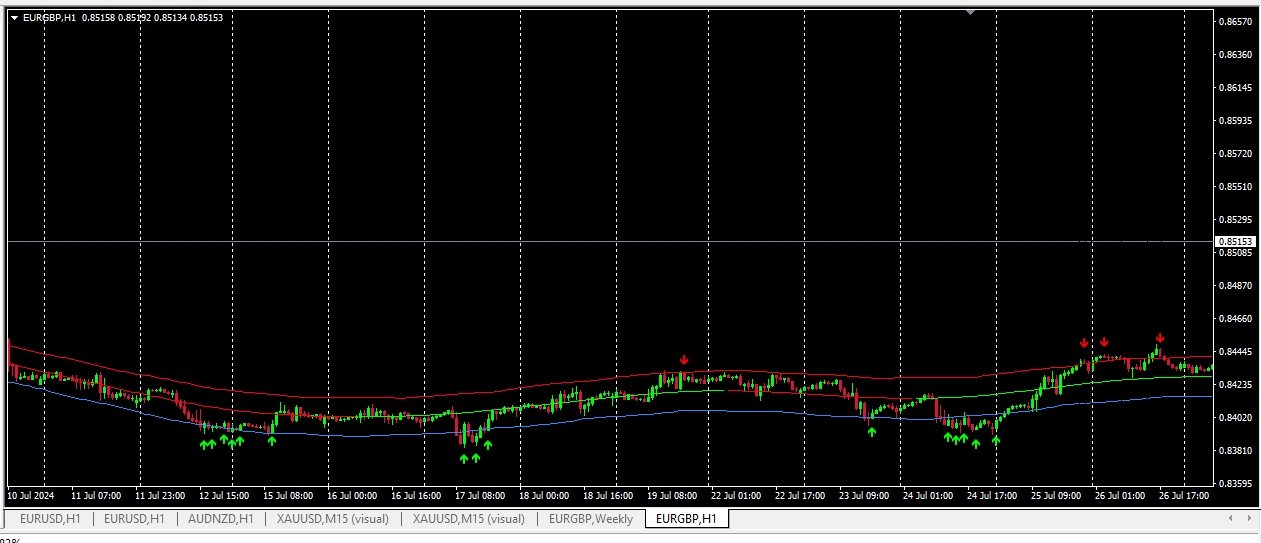
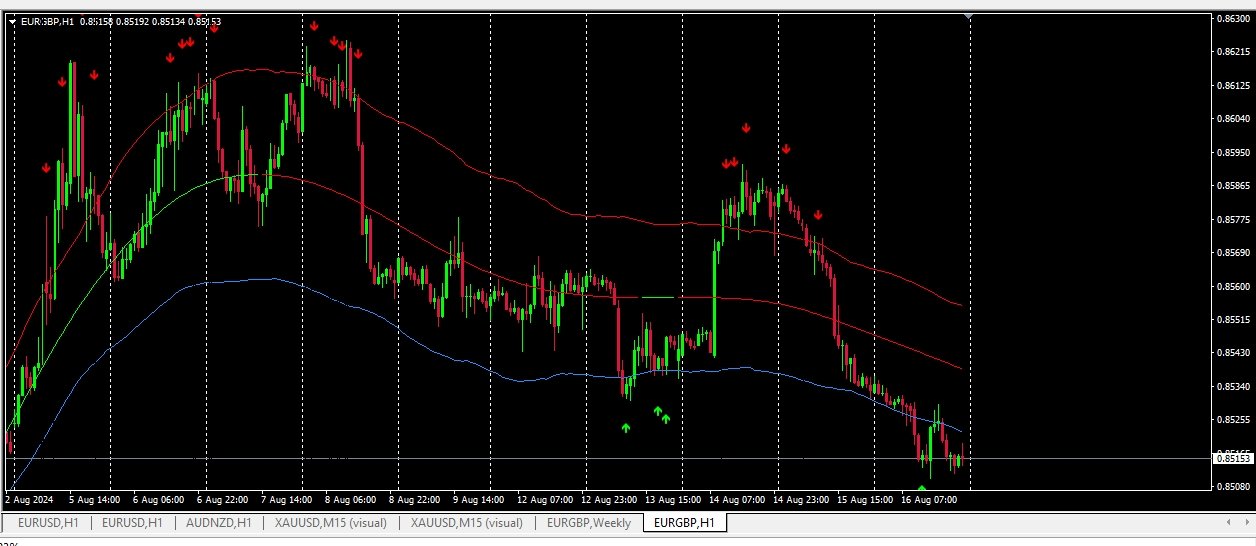
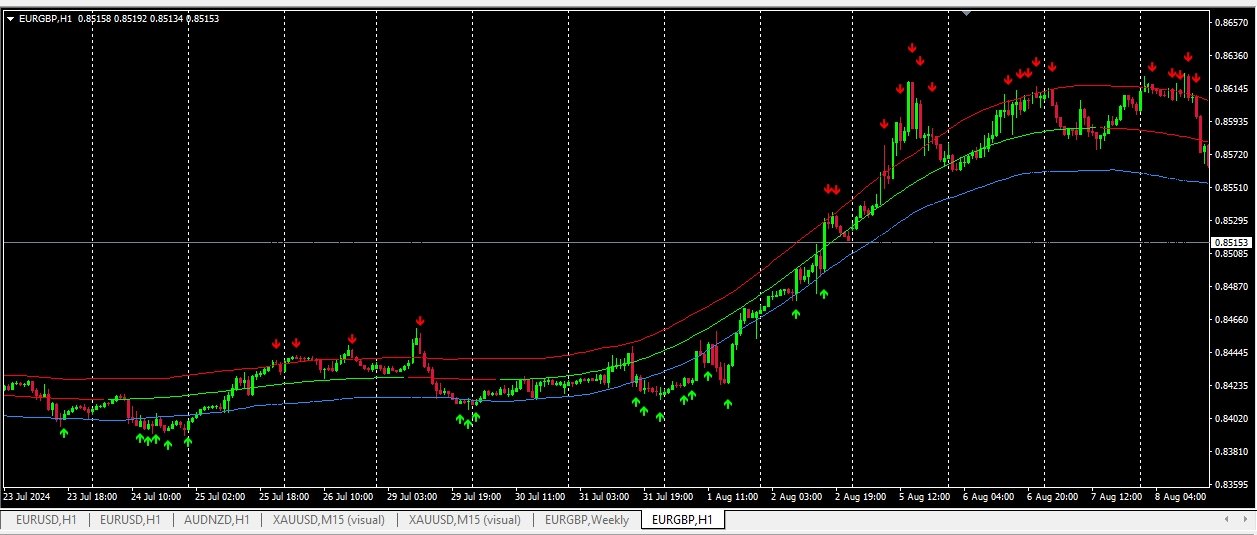
Signal with Zigzal
Recommended trading indicators
1. Calculate Zone point from zigzag
2. Calculate Signal Buy Sell from zone
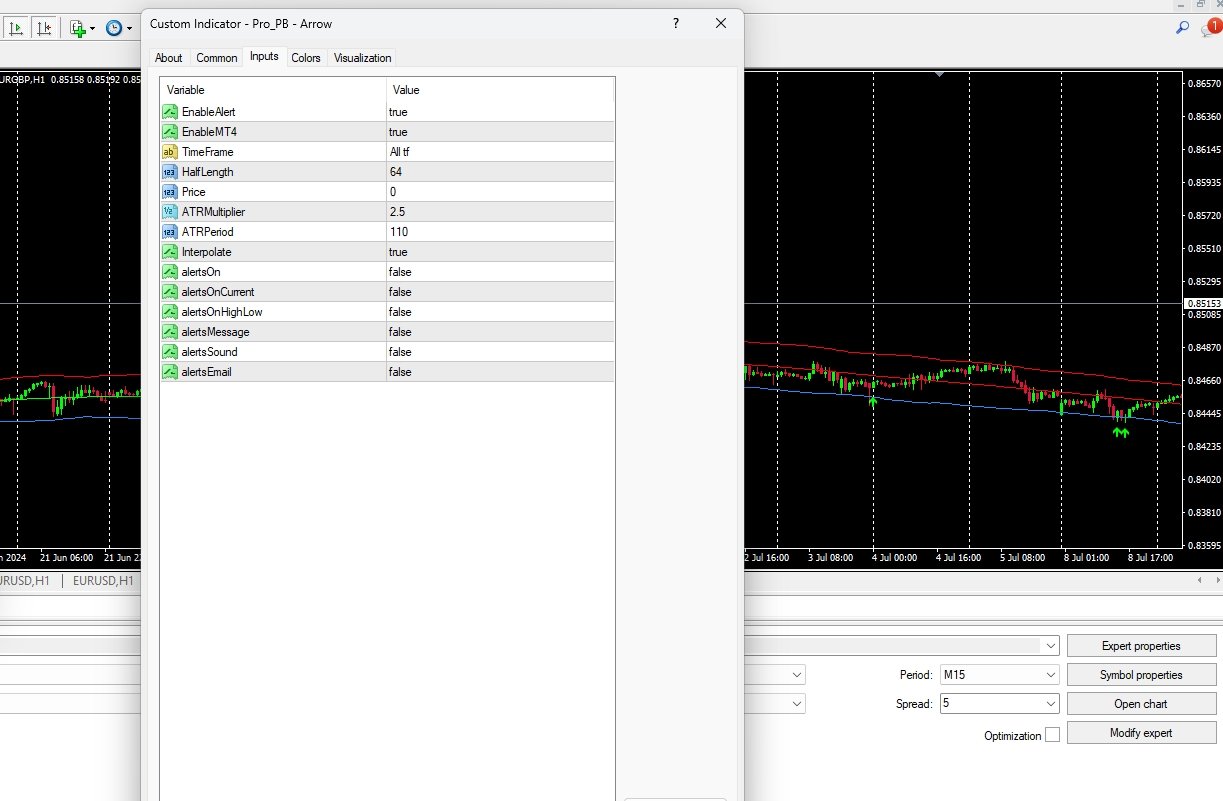
3. You can adjust the input parameters.
4. Send Signal Buy , Sell
5. Calculate Open Order Point
6. The indicator uses a custom proprietary non-redrawing ZigZag for determining patterns, therefore the indicator never repaints its signals.