Heiken Ashi fxam
- インディケータ
- Ely Alsedy
- バージョン: 1.0
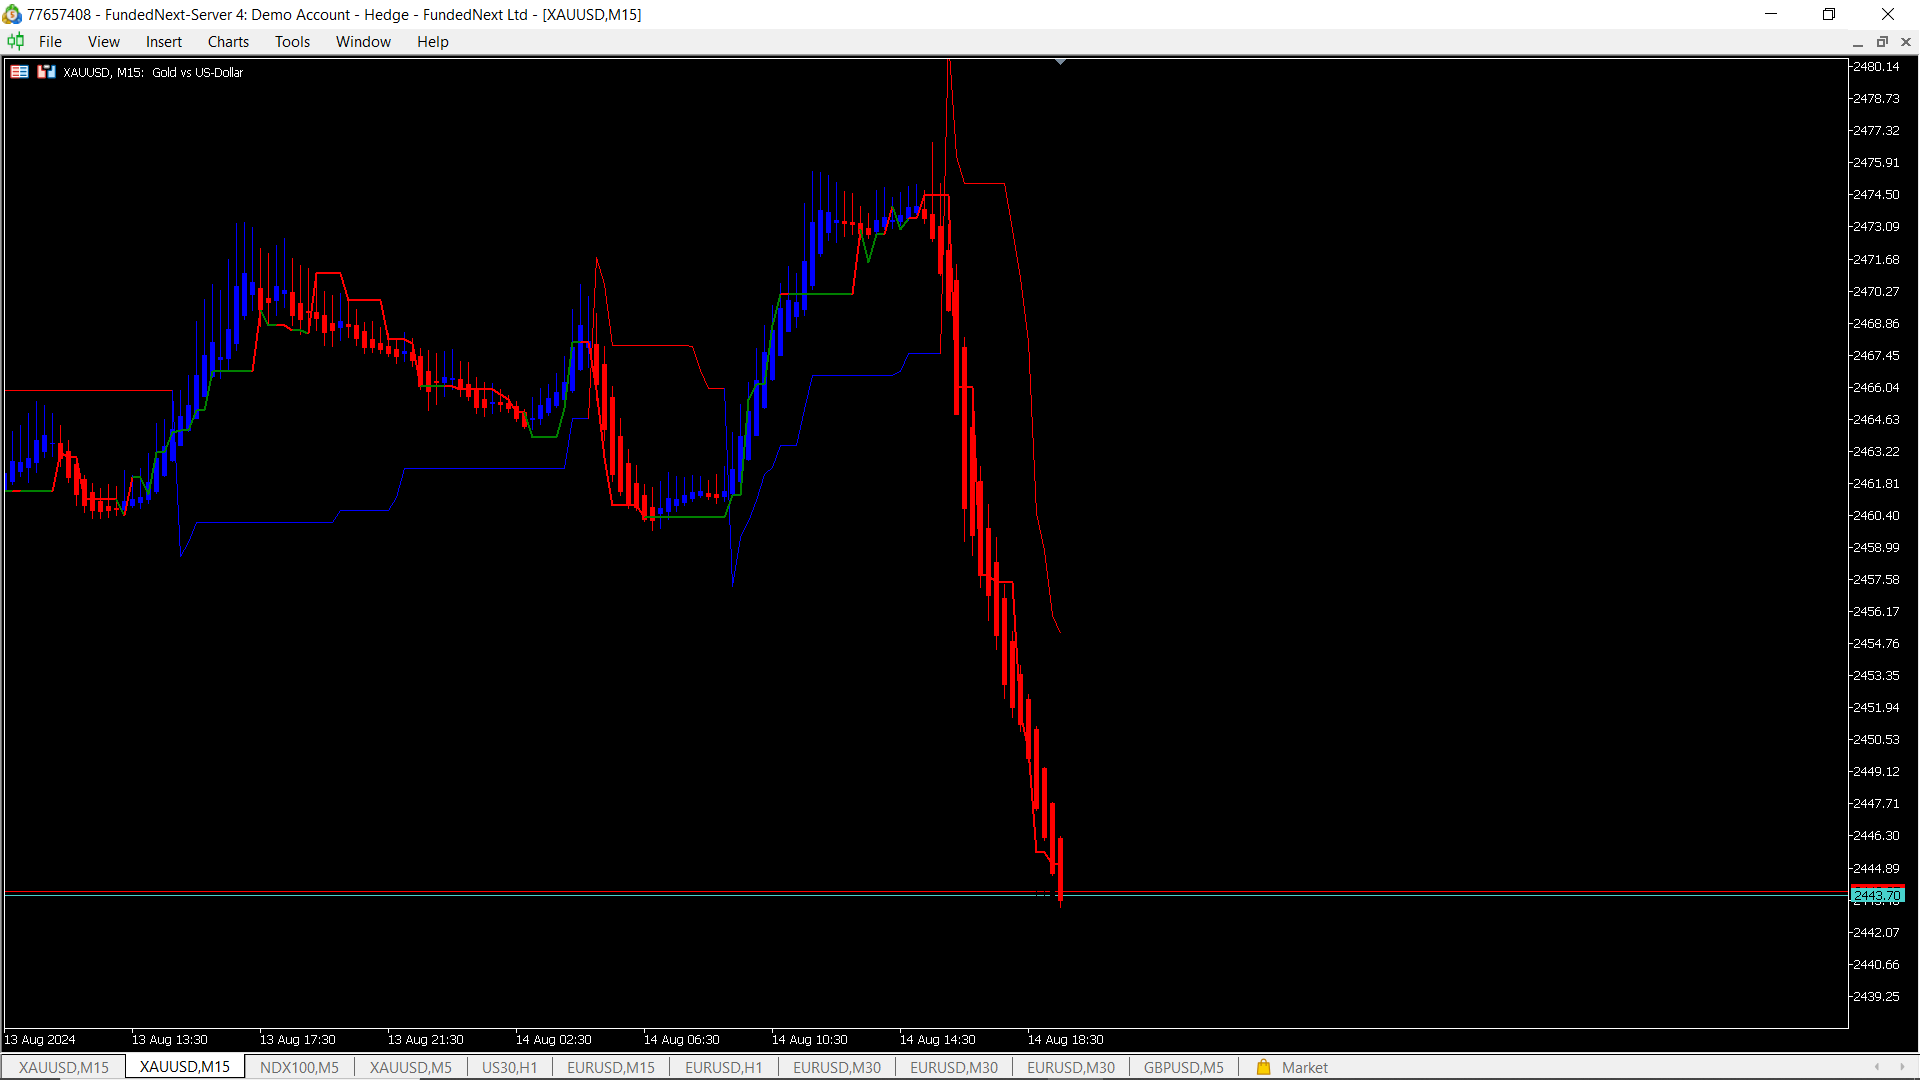
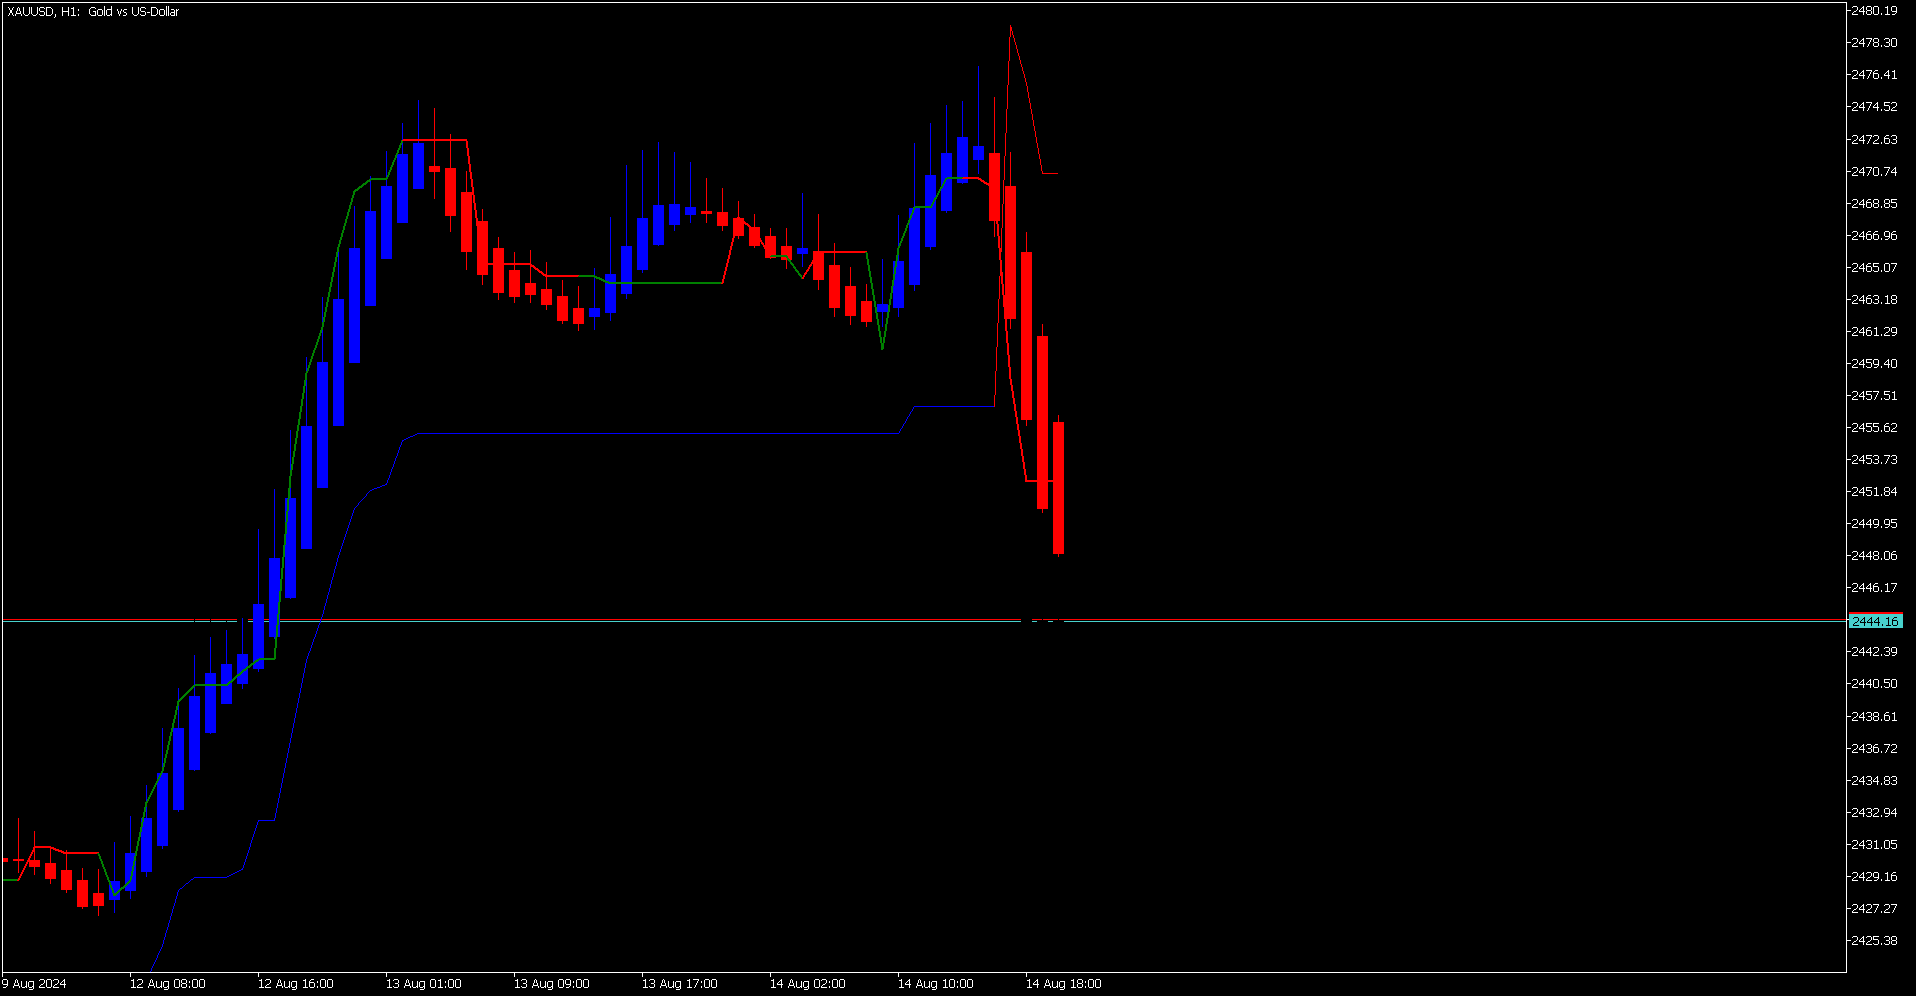
平均足(ヘイキンアシ)MT5インジケーター
平均足(ヘイキンアシ)MT5インジケーターは、標準的な価格データをより滑らかでトレンドに沿ったローソク足に変換し、市場トレンドや潜在的な反転ポイントをより簡単に識別できるようにする強力なツールです。
主な特徴:
- 明確なトレンド識別: 異なるローソク足の色で上昇トレンドと下降トレンドを視覚的に区別します。
- ノイズの低減: 価格変動をフィルタリングし、市場の主要な動きをより明確に表示します。
- 早期トレンド検出: 標準チャートでトレンドの変化が明らかになる前に、潜在的なトレンド変化を予測します。
- 汎用性: 単独で使用することも、他のテクニカル指標と組み合わせて総合的な分析を行うこともできます。
- カスタマイズ可能な設定: インジケーターを特定の取引設定や戦略に合わせて調整できます。
メリット:
- トレンドを特定し、潜在的なエントリーポイントと出口ポイントを識別する能力を向上させます。
- 市場ノイズの影響を減らし、重要な価格変動に集中します。
- 市場ダイナミクスをより明確に理解することで、より情報に基づいた取引決定を行うことができます。
- 検証済みのテクニカル分析ツールを使用して競争優位性を得ることができます。
対象ユーザー:
- テクニカル分析を向上させたいあらゆるレベルのトレーダー。
- より滑らかでトレンド指向の市場ビューを好むトレーダー。
- 既存の取引戦略を補完するツールを探しているトレーダー。
平均足(ヘイキンアシ)MT5インジケーターの可能性を開放し、取引を次のレベルに引き上げましょう!
注: より効果的な製品プロモーションのために、このインジケーターを使用して適用できる特定の戦略に関する情報と、使用例を示すチャートのスクリーンショットを追加することをお勧めします。
平均足インジケーターにさらに具体的な機能を追加しますか?