• 概要
  • レビュー
  • コメント

Indicator Pilot

Welcome to a highly versatile and customizable trading indicator designed to elevate your trading strategy. This indicator integrates four moving averages (MAs) and order blocks, providing you with a powerful tool for market analysis and decision-making.

Key Features:

  1. Four Moving Averages (MAs):

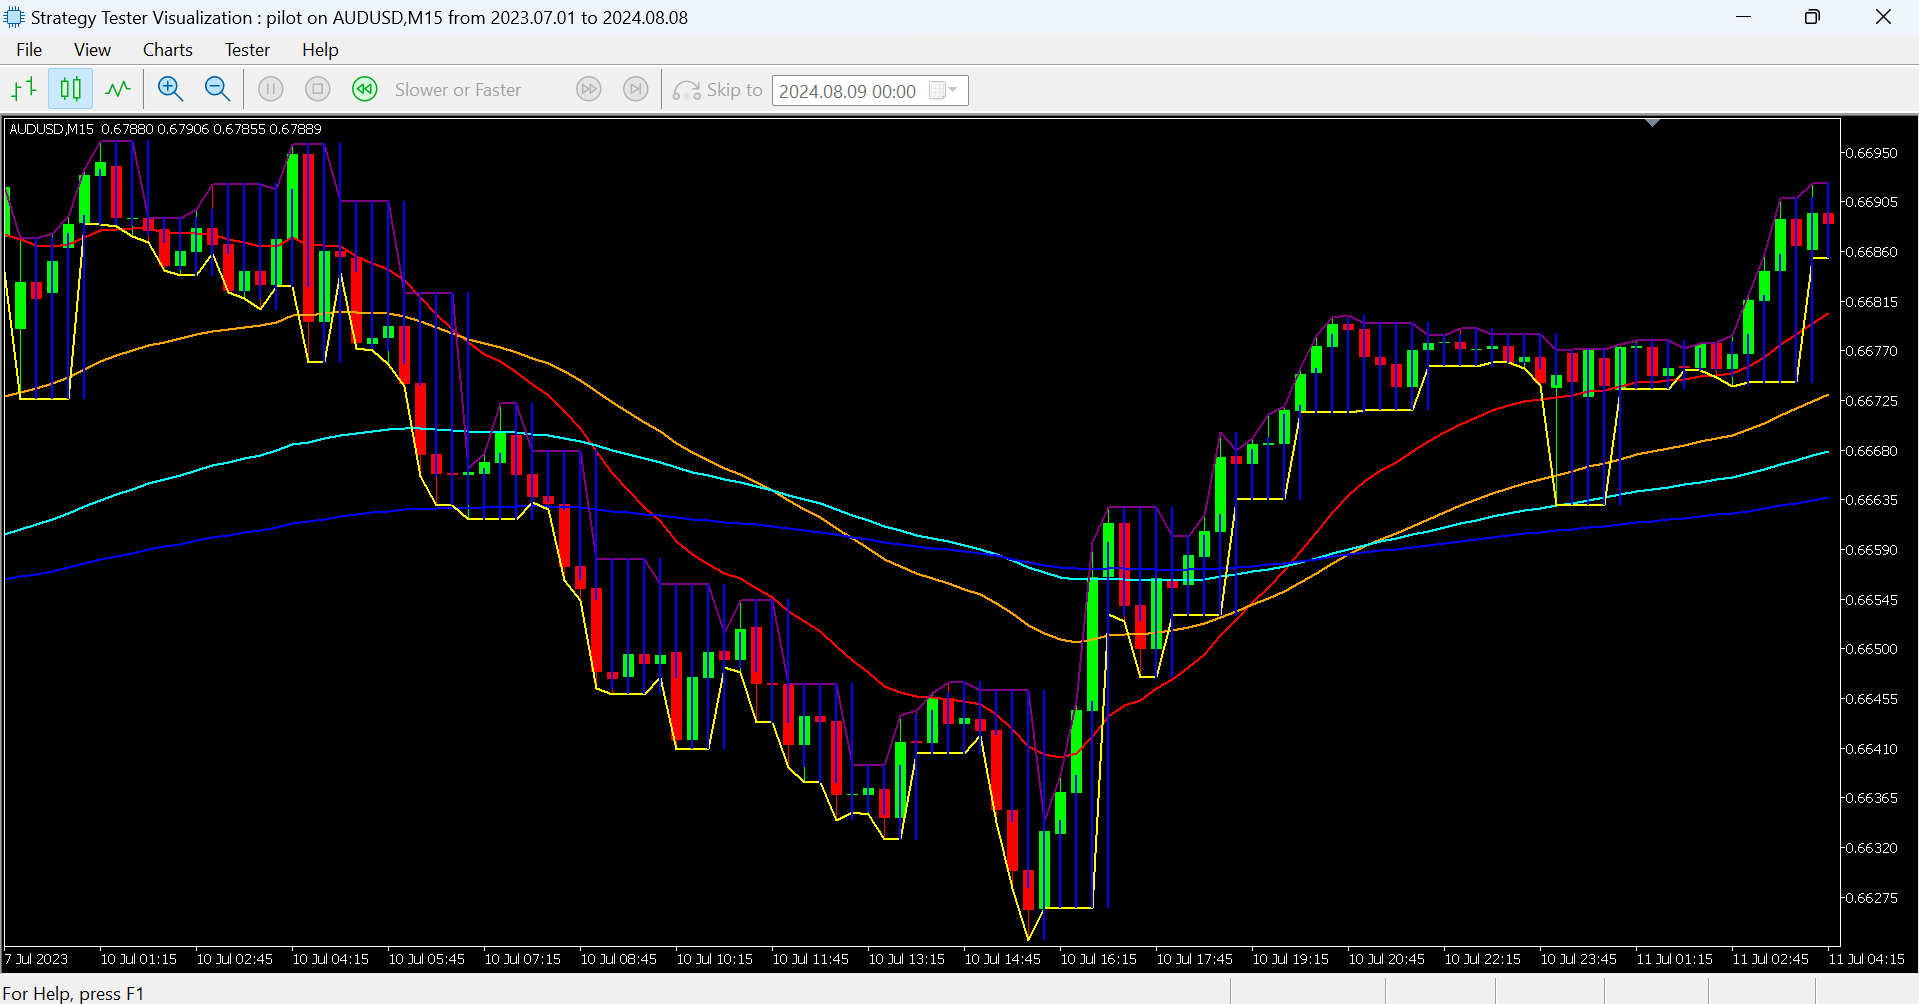
    • This indicator allows you to utilize up to four different moving averages simultaneously. You can adjust each MA's period, color, and style to tailor the indicator to your specific trading needs. Whether you prefer exponential moving averages (EMAs) or simple moving averages (SMAs), this tool offers the flexibility to use the type of MA that best fits your strategy.
  2. Order Blocks Visualization:

    • Order blocks are crucial for identifying potential areas of support and resistance. This indicator highlights these blocks, giving you a clear visual representation of key price levels where significant buying or selling activity has occurred. This feature helps you make more informed decisions about entry and exit points.
  3. Customizable Colors and Values:

    • The indicator is designed with user customization in mind. You can change the colors of the moving averages and order blocks to ensure they stand out on your chart. Additionally, you can adjust the values of the moving averages to match your trading strategy, whether you’re using short-term or long-term MAs.
  4. Signal Generation:

    • Buy Signal: A buy signal is generated when the 20-period moving average crosses above the 50-period moving average. This crossover indicates a potential upward trend and serves as an entry point for long trades.
    • Strong Buy Signal: A stronger buy signal is triggered when all four moving averages align in the same direction, confirming a robust upward trend and enhancing the reliability of the buy signal.
    • Sell Signal: Conversely, a sell signal is generated when the 20-period moving average crosses below the 50-period moving average, suggesting a potential downward trend and providing an entry point for short trades.
    • Strong Sell Signal: A strong sell signal is triggered when all four moving averages align in the same direction, indicating a significant downward trend and reinforcing the validity of the sell signal.

This indicator is designed to be highly adaptable, allowing you to fine-tune the settings to match your trading style and preferences. Its visual clarity and customization options make it a valuable addition to your trading toolkit.

We hope this indicator enhances your trading experience by providing clear and actionable signals based on moving average crossovers and order blocks. Customize it to fit your strategy and make more informed trading decisions.

Thank you for considering this tool for your trading needs.


おすすめのプロダクト
The indicator detects and displays М. Gartley's Butterfly pattern. The pattern is plotted by the extreme values of the ZigZag indicator (included in the resources, no need to install). After detecting the pattern, the indicator notifies of that by the pop-up window, a mobile notification and an email. The pattern and wave parameters are displayed on the screenshots. The default parameters are used for demonstration purposes only in order to increase the amount of detected patterns. Parameters z
Enjoy the Free Candle Color indicator.  Kijun Sen is an element of Ichimoku Kinko Hyo Indicator, it's far too complicated for many traders hence they tend to be confused.  We have simplified it so the Kijun Sen will change colors as it activates without the Tenkan Sen, Senkou Span, Up Kumo and Down Kumo.  Customize to your period parameter and colors of your choice.  Great for beginners and seasoned traders.  Set your period and enjoy GOOD LUCK and ALL THE BEST IN YOUR TRADING JOURNEY !!!!!
FREE
The idea of the system is to indentify the reversal patterns using the calculation of the composite candle. The reversal patterns is similar to the "Hammer" and "Hanging Man" patterns in Japanese candlestick analysis. But it uses the composite candle instead the single candle and doesn't need the small body of the composite candle to confirm the reversal. Input parameters: Range - maximal number of bars, used in the calculation of the composite candle. Minimum - minimal size of the composite can
FREE
The TrendOscillator Indicator is an upgraded version of the traditional Stochastic Oscillator.   It comprises two lines: %K and %D.   The %K line represents the current market position.   In contrast, the %D line is a moving average of the %K line used to generate signals and identify potential entry or exit points. The good thing is the indicator works on all timeframes like the traditional Stochastic.   However, to avoid any false signals, applying the indicator on longer timeframes is better
FREE
The indicator identifies when a divergence occurs between price and an indicator or oscillator. It identifies both regular and hidden divergences. Combined with your own rules and techniques, this indicator will allow you to create (or enhance) your own powerful system. Features Can detect divergences for the following oscillators/indicators:   MACD, OsMA, Stochastics, RSI, CCI, RVI, Awesome, ADX, ATR, OBV, Composite index, MFI and Momentum. Only one oscillator/indicator can be selected. Draws
FREE
ADXW Cloud
Shahabeddin Baset
4.6 (5)
This is Wilder's ADX with cloud presentation of DI+ & DI- lines. Features 4 standard lines of the ADX indicator: DI+, DI-, ADX, ADXR cloud presentation of DI+/DI- lines with transparent colors applicable to all time-frames and all markets What Is ADX J. Welles Wilder Jr., the developer of well-known indicators such as RSI, ATR, and Parabolic SAR, believed that the Directional Movement System, which is partially implemented in ADX indicator, was his most satisfying achievement. In his 1978 book,
FREE
This indicator displays breakouts on Point-And-Figure-like or Kagi-like custom symbol charts, generated by special expert advisers, such as PointFigureKagiCharts . This indicator is applicable only for custom instruments generated in appropriate way (with time-invariant bars which are multiples of a predefined box size). It makes no sense to apply it to other charts. The breakouts in up or down direction are marked by arrows. The breakout price is found at crossing of one of imaginary lines of
FREE
This indicator is an automated version of the Fibonacci retracement (Fib) indicator. Deciding the best areas to use when drawing the fib can be tricky and this  indicator was made with that in mind. When you drop it on the chart it will automatically choose the best points to draw the fib with, but in case you aren't satisfied with those regions, you can adjust it as you wish.
FREE
Indicator and Expert Adviser  EA Available in the comments section of this product. Download with Indicator must have indicator installed for EA to work. Mt5 indicator alerts for bollinger band and envelope extremes occurring at the same time. Buy signal alerts occur when A bullish candle has formed below both the lower bollinger band and the lower envelope  Bar must open and close below both these indicators. Sell signal occur when A bear bar is formed above the upper bollinger band and upper
FREE
Important Lines
Terence Gronowski
4.86 (21)
This indicator displays Pivot-Lines, preday high and low, preday close and the minimum and maximum of the previous hour. You just have to put this single indicator to the chart to have all these important lines, no need to setup many single indicators. Why certain lines are important Preday high and low : These are watched by traders who trade in a daily chart. Very often, if price climbs over or falls under a preday low/high there is an acceleration in buying/selling. It is a breakout out of a
FREE
Multi-timeframe trend indicator based on the ADX / ADXWilder indicator with Fibonacci levels The indicator shows trend areas using ADX or ADXWilder indicator data from multiple timeframes. The impulse mode of the indicator allows you to catch the beginning of a trend, and several "Screens" with different timeframes allow you to filter out market noise. Fibonacci levels are added to the price chart, which have flexible settings. How the indicator works: if PDI is greater than NDI, then   it`s
FREE
トレンドキャッチャー: アラートインジケーター付きのトレンドキャッチャーストラテジーは、市場トレンドやポテンシャルなエントリーポイントやエグジットポイントを特定するのに役立つ多目的な技術分析ツールです。動的なトレンドキャッチャーストラテジーを備えており、市場状況に適応してトレンドの方向を明確に視覚化します。トレーダーは、自身の好みやリスク許容度に合わせてパラメーターをカスタマイズできます。このインジケーターはトレンドの識別を支援し、ポテンシャルなリバーサルをシグナルし、トレイリングストップのメカニズムとして機能し、市場への迅速な対応のためのリアルタイムアラートを提供します。 特徴: - トレンドの識別:上昇トレンドと下降トレンドをシグナルします。 - トレンドのリバーサル:ローソク足の色が上昇から下降に変わった場合やその逆の場合に、ポテンシャルなリバーサルを警告します。 - リアルタイムアラート:新しいトレンドの識別に対するアラートを生成します。 推奨事項: - 通貨ペア:EURUSD、AUDUSD、XAUUSDなど... - タイムフレーム:H1。 - アカウントタイプ:
FREE
Trend indicator based on the ADX / ADXWilder indicator The indicator shows trend areas using ADX or ADXWilder indicator data. How the indicator works: if PDI is greater than NDI, then it`s bullish movement; if PDI is less than NDI, then it`s bearish movement; if ADX is less than or equal to the filter value specified in the parameters, then there is no movement state. Input parameters of the indicator: Calculate Timeframe - timeframe for calculation; ADX Type - type of ADX calculation based
FREE
This indicator is a straight port of a well known MetaTrader 4 indicator that is freely available on the Internet. It does not redraw at all. It implements a type of breakout strategy. The arrows indicate market direction. Use the indicator on M15 charts and higher. The indicator draws two bands near price action and generates signals when the price closes below the lower band and also above the upper band. The indicator uses periodic highs and lows to calculate upper and lower threshold bands.
FREE
JAC Trend Color Candle
Eduardo Da Costa Custodio Santos
The indicator "JAC Trend Color Candle" for Meta Trader 5, was created to visually facilitate the trend for the trader. It is based on three parameters, which identifies the uptrend, downtrend and non-trending market. The colors are trader-configurable, and the average trader-configurable as well. trend parameters cannot be configured as they are the indicator's differential.
Super Fractals
Aurthur Musendame
5 (4)
Think of the Super Fractal Indicator as the Bill WIlliams Indicator on Steroids. Indicator Abilities: 1. Adjust Candle around Fractal High or Low. 2. Adjust Lookback period and only plot for a specific number of history candles avoiding cluttering your trading desk. 3. The Indicator uses buffers so you call and use it from any EA. Note : The higher the candles around Fractal, the stronger the Turning point anfd viceversa is true.
FREE
The Hi Low Last Day ( Hi Lo Last Day ) indicator shows the high and low of the last trading day and the second trading day, as well as the minimum and maximum of last week . There are many trading strategies on the daily levels. This indicator is indispensable when using such trading strategies. In fact, everything is simple in trading, you just need to understand and accept it for yourself. There is only price!!! What is price? This is the level on the chart. The level is the price that the buy
Description:  For a comprehensive understanding of our indicators, we invite you to explore the entire Q&A section within this MQL5 blog post   here . The "Live Account Statistics" Indicator is a powerful technical analysis tool that provides real-time insights into the performance of your trading account. With this indispensable tool, you can access crucial account statistics, such as balance, equity, drawdown, and more, allowing you to make data-driven trading decisions. Key Features: Real-Ti
FREE
The Scaled Awesome Oscillator (SAO) represents a refined adaptation of the Awesome Oscillator, aimed at establishing consistent benchmarks for identifying market edges. Unlike the standard Awesome Oscillator, which records the variation in pips across different commodities, the only unchanging reference point is the zero line. This limitation hampers investors and traders from pinpointing specific levels for trend reversals or continuations using the traditional Awesome Indicator, a creation of
FREE
BUY INDICATOR AND GET EA FOR FREE AS A BONUS + SOME OTHER GIFTS! ITALO TREND INDICATOR  is the best trend indicator on the market, the Indicator works on all time-frames and assets, indicator built after 7 years of experience on forex and many other markets. You know many trend indicators around the internet are not complete, does not help, and it's difficult to trade, but the Italo Trend Indicator is different , the Italo Trend Indicator shows the signal to buy or sell, to confirm the signal t
Macd Rsi
Ignacio Agustin Mene Franco
macd rsi It is a macd indicator added to the rsi to capture perfect entries in the average crossovers! As seen in the indicator, it has 2 lines, one of gold color and the other violet line, where the cross of the violet with the gold downwards is a sell signal when it crosses the violet up from the gold it is a buy signal! very good to make shorts works for forex markets and synthetic indices It is used in any temporality! Good profit! World Investor.
インジケーター   "Haven Key Levels PDH PDL"   は、トレーダーがチャート上の重要なレベルを視覚化するのを支援します。次のレベルを自動的にマークします: DO (Daily Open)   — 日の開始レベル。 NYM (New York Midnight)   — ニューヨークの真夜中レベル。 PDH (Previous Day High)   — 前日の最高値。 PDL (Previous Day Low)   — 前日の最安値。 WO (Weekly Open)   — 週の開始レベル。 MO (Monthly Open)   — 月の開始レベル。 PWH (Previous Week High)   — 前週の最高値。 PWL (Previous Week Low)   — 前週の最安値。 その他の製品 ->  ここ ツールのカスタマイズオプション: 色とラインの太さの選択: レベルの色設定:   NYM, DO, WO, MO, PDH, PDL, PWH, PWL. ラインの太さの調整。 レベルの表示制御: レベルのライン表示のオン/オフ:
FREE
平均足(ヘイキンアシ)MT5インジケーター 平均足(ヘイキンアシ)MT5インジケーターは、標準的な価格データをより滑らかでトレンドに沿ったローソク足に変換し、市場トレンドや潜在的な反転ポイントをより簡単に識別できるようにする強力なツールです。 主な特徴: 明確なトレンド識別: 異なるローソク足の色で上昇トレンドと下降トレンドを視覚的に区別します。 ノイズの低減: 価格変動をフィルタリングし、 市場の主要な動きをより明確に表示します。 早期トレンド検出: 標準チャートでトレンドの変化が明らかになる前に、 潜在的なトレンド変化を予測します。 汎用性: 単独で使用することも、 他のテクニカル指標と組み合わせて総合的な分析を行うこともできます。 カスタマイズ可能な設定: インジケーターを特定の取引設定や戦略に合わせて調整できます。 メリット: トレンドを特定し、 潜在的なエントリーポイントと出口ポイントを識別する能力を向上させます。 市場ノイズの影響を減らし、 重要な価格変動に集中します。 市場ダイナミクスをより明確に理解することで、 より情報に基づいた取引決定を行うことができます。 検証済
FREE
ToolBot Probabilistic Analysis - FREE   An effective indicator for your negotiations The toolbot indicator brings the calculation of candles and a probabilistic analysis so that you have more security on your own. Also test our  FREE tops and bottoms indicator: :   https://www.mql5.com/pt/market/product/52385#description Also test our  FREE (RSI, ATR, ADX, OBV) indicator:   https://www.mql5.com/pt/market/product/53448#description Try our EA ToolBot for free:   https://www.mql5.com/market/prod
FREE
The indicator is based on Robert Miner's methodology described in his book "High probability trading strategies" and displays signals along with momentum of 2 timeframes. A Stochastic oscillator is used as a momentum indicator. The settings speak for themselves period_1 is the current timeframe, 'current' period_2 is indicated - the senior timeframe is 4 or 5 times larger than the current one. For example, if the current one is 5 minutes, then the older one will be 20 minutes The rest of the s
FREE
Follow The Line MT5
Oliver Gideon Amofa Appiah
4.52 (29)
This indicator obeys the popular maxim that: "THE TREND IS YOUR FRIEND" It paints a GREEN line for BUY and also paints a RED line for SELL. (you can change the colors). It gives alarms and alerts of all kinds. IT DOES NOT REPAINT and can be used for all currency pairs and timeframes. Yes, as easy and simple as that. Even a newbie can use it to make great and reliable trades. NB: For best results, get my other premium indicators for more powerful and reliable signals. Get them here: https://www.m
FREE
The  Kijun-Sen Envelope  is a powerful trend-following indicator based on the  Kijun-Sen  line from the Ichimoku Kinko Hyo system. This tool creates dynamic upper and lower bands around the Kijun-Sen, forming an envelope that helps traders identify market trends, potential reversals, and overbought/oversold conditions. Key Features: • Trend Confirmation – Helps determine whether the market is in a strong uptrend, downtrend, or ranging phase. • Support & Resistance Zones – The envelope acts as
FREE
Free automatic Fibonacci is an indicator that automatically plots a Fibonacci retracement based on the number of bars you select on the BarsToScan setting in the indicator. The Fibonacci is automatically updated in real time as new highest and lowest values appears amongst the selected bars. You can select which level values to be displayed in the indicator settings. You can also select the color of the levels thus enabling the trader to be able to attach the indicator several times with differe
FREE
Description:  For a comprehensive understanding of our indicators, we invite you to explore the entire Q&A section within this MQL5 blog post   here . The "High Spread Alert" Indicator is a valuable tool for traders, providing real-time information about spread fluctuations in the forex market. As a technical analysis tool, it helps traders make informed decisions by alerting them to periods of high spread, which can impact trading conditions and execution. Key Features: Spread Monitoring: The
FREE
インジケーター   Haven FVG   は、市場を分析するためのツールで、チャート上で非効率性の領域(Fair Value Gaps、FVG)を特定することができ、トレーダーに価格分析と取引決定のための主要なレベルを提供します。 他の製品 ->  ココ 主な特徴: 個別のカラー設定: ブルFVGの色   (Bullish FVG Color)。 ベアFVGの色   (Bearish FVG Color)。 柔軟なFVGの視覚化: FVGを検索するための最大ローソク足数。 FVGゾーンの追加延長(特定のバー数)。 FVGの塗りつぶしを有効にするオプション。 中央線(Middle Line): 線の色とスタイルの選択(例:点線)。 線の太さの調整。 一般設定: FVGを現在のバーまで拡張。 塗りつぶしのある歴史的なFVGを除外し、最新のデータに焦点を当てる。 チャート上の非効率性の領域を分析し、根拠のある取引決定を行う簡単で効果的な方法。
FREE
このプロダクトを購入した人は以下も購入しています
トレンド スクリーナー インジケーターでトレンド取引の力を解き放ちます。ファジー ロジックと複数通貨システムを活用した究極のトレンド取引ソリューションです。 ファジー ロジックを活用した革新的なトレンド インジケーターである Trend Screener を使用して、トレンド取引を向上させます。 これは、13 を超えるプレミアム ツールと機能、および 3 つの取引戦略を組み合わせた強力なトレンド追跡インジケーターであり、Metatrader をトレンド アナライザーにする多用途の選択肢となります。 期間限定オファー : トレンド スクリーナー インジケーターは、わずか 100 ドルで生涯ご利用いただけます。 (元の価格 50$ ) (オファー延長) Trend Screener の 100% 非再描画精度の揺るぎない精度を体験して、取引の決定が過去の価格変動の影響を受けないようにしてください。 マルチタイムフレームおよびマルチ通貨機能の多用途性を解放し、比類のない自信を持って外国為替、商品、暗号通貨、インデックスの世界を取引できるようにします。 Trend Screener の包括的な
MONEYTRON – ТВОЙ ЛИЧНЫЙ СИГНАЛ НА УСПЕХ! XAUUSD | AUDUSD | USDJPY | BTCUSD Поддержка таймфреймов: M5, M15, M30, H1 Почему трейдеры выбирают Moneytron? 82% успешных сделок — это не просто цифры, это результат продуманной логики, точного алгоритма и настоящей силы анализа. Автоматические сигналы на вход — не нужно гадать: когда покупать, когда продавать. 3 уровня Take Profit — ты сам выбираешь свой уровень прибыли: безопасный, уверенный или максимум. Четкий Stop Loss — контролируешь риск
PUMPING STATION – あなた専用の「オールインワン」戦略 PUMPING STATIONは、あなたのトレードをより楽しく、そして効果的に変えてくれる革新的なFXインジケーターです。ただの補助ツールではなく、強力なアルゴリズムを備えた本格的なトレーディングシステムで、より安定したトレードのスタートをサポートします。 この商品をご購入いただくと、以下の特典を無料でお付けします: 専用セットファイル:自動設定による最大パフォーマンスを実現。 ステップバイステップのビデオマニュアル:PUMPING STATION戦略の使い方を学べます。 Pumping Utility:PUMPING STATION専用の半自動トレードボットで、より快適かつシンプルな運用を可能にします。 ※ご購入後すぐにご連絡ください。追加リソースへのアクセスを提供いたします。 PUMPING STATIONの仕組み: トレンド管理:市場のトレンド方向を即座に判断。トレンドはあなたの最高の味方です。 エントリーサイン:チャート上の矢印で、取引のタイミングと方向を明確に示します。 明確な目標設定:インジケーターが自
Golden Trend Indicator MT5
Noha Mohamed Fathy Younes Badr
4.89 (18)
Golden Trend indicator  is The best indicator for predicting trend movement this indicator never lags and never repaints and never back paints    and give  arrow buy and sell    before the candle appear  and it will help you and  will make your trading decisions clearer its work on all currencies and  gold and crypto and all time frame This unique  indicator uses very secret algorithms to catch the  trends, so you can trade using this indicator and see the trend clear on charts  manual guide and
FX Volume MT5
Daniel Stein
4.82 (17)
FX Volume:ブローカー視点で捉える本物の市場センチメント クイック概要 トレード手法をさらに高めたいとお考えですか? FX Volume は、リテールトレーダーやブローカーのポジション状況をリアルタイムで提供します。これは、COTのような遅延レポートよりもはるかに早く知ることができます。安定した利益を目指す方も、さらなる優位性を求める方も、 FX Volume は大きな不均衡を見極め、ブレイクアウトを確認し、リスク管理を洗練させるのに役立ちます。今すぐ始めて、実際の出来高データがどのように意思決定を変革するかを体感してください! 1. FX Volume がトレーダーにとって非常に有益な理由 高精度の早期警戒シグナル • 各通貨ペアを売買しているトレーダー数を、他者よりも早く、ほぼリアルタイムで把握できます。 • FX Volume は、複数のリテールブローカーから得られる本物の出来高データを収集し、分かりやすい形式で提供する 唯一 のツールです。 強力なリスク管理 • ロングやショートの大きな偏り(インバランス)を特定し、潜在的なトレンド転換を見逃しません。ストップ
サポートとレジスタンススクリーナーは、1つのインジケーター内に複数のツールを提供するMetaTraderの1つのレベルインジケーターにあります。 利用可能なツールは次のとおりです。 1.市場構造スクリーナー。 2.強気のプルバックゾーン。 3.弱気プルバックゾーン。 4.デイリーピボットポイント 5.毎週のピボットポイント 6.毎月のピボットポイント 7.ハーモニックパターンとボリュームに基づく強力なサポートとレジスタンス。 8.銀行レベルのゾーン。 期間限定オファー:HVサポートおよびレジスタンスインジケーターは、50ドルと生涯でのみご利用いただけます。 (元の価格125 $) MQL5ブログにアクセスすると、分析例を含むすべてのプレミアム指標を見つけることができます。 ここをクリックしてください。 主な機能 ハーモニックおよびボリュームアルゴリズムに基づく強力なサポートおよびレジスタンスゾーン。 ハーモニックおよびボリュームアルゴリズムに基づく強気および弱気のプルバックゾーン。  市場構造スクリーナー 毎日、毎週、毎月のピボットポイント。 ドキュメント すべてのサポートおよび
FX Power: 通貨の強弱を分析して、より賢い取引を実現 概要 FX Power は主要通貨と金の実際の強弱をあらゆる市場状況で理解するための必須ツールです。強い通貨を買い、弱い通貨を売ることで、 FX Power は取引の意思決定を簡素化し、高い確率の取引機会を見出します。トレンドを追従する場合でも、極端なデルタ値を使用して反転を予測する場合でも、このツールはあなたの取引スタイルに完全に適応します。ただ取引するだけではなく、 FX Power で賢く取引をしましょう。 1. なぜ FX Power がトレーダーにとって非常に有益なのか 通貨と金のリアルタイム強弱分析 • FX Power は主要通貨と金の相対的な強弱を計算し、マーケットダイナミクスに関する明確な洞察を提供します。 • どの資産がリードしているか、または後れを取っているかを監視して、取引するペアを賢く選びましょう。 マルチタイムフレームの包括的なビュー • 短期、中期、長期のタイムフレームで通貨と金の強弱を追跡し、マーケットトレンドに基づいて取引戦略を調整できます。 • スキャルピングからスイングトレード
優れたテクニカルインジケーター「Grabber」をご紹介します。これは、すぐに使える「オールインワン」トレーディング戦略として機能します。 ひとつのコードに、市場のテクニカル分析ツール、取引シグナル(矢印)、アラート機能、プッシュ通知が強力に統合されています。 このインジケーターを購入された方には、以下の特典を無料で提供します: Grabberユーティリティ:オープンポジションを自動で管理するツール ステップバイステップのビデオマニュアル:インジケーターのインストール、設定、取引方法を解説 カスタムセットファイル:インジケーターをすばやく自動設定し、最大限の成果を出すための設定ファイル 他の戦略はもう忘れてください!Grabberだけが、あなたを新たなトレードの高みへと導いてくれるのです。 Grabber戦略の主な特徴: 推奨タイムフレーム:M5〜H4 対応通貨ペア・資産:どれでも使用可能ですが、私が実際に検証した以下を推奨します(GBPUSD、GBPCAD、GBPCHF、AUDCAD、AUDUSD、AUDSGD、AUDCHF、NZDUSD、NZDCAD、EURCAD、EURUSD、E
Quantum TrendPulse を ご紹介します。これは、   SuperTrend   、   RSI   、および Stochastic のパワーを 1 つの包括的なインジケーターに組み合わせて、取引の可能性を最大限に引き出す究極の取引ツールです。精度と効率を求めるトレーダー向けに設計されたこのインジケーターは、市場のトレンド、勢いの変化、最適なエントリー ポイントとエグジット ポイントを自信を持って特定するのに役立ちます。 主な特徴: SuperTrend 統合: 現在の市場動向に簡単に追従し、収益性の波に乗ることができます。 RSI精度: 買われすぎと売られすぎのレベルを検出し、市場の反転のタイミングに最適で、SuperTrendのフィルターとして使用されます。 確率的精度: 確率的振動を活用して、変動の激しい市場で隠れたチャンスを見つけます。SuperTrend のフィルターとして使用されます。 マルチタイムフレーム分析:   M5 から H1 または H4 まで、さまざまなタイムフレームで市場を常に把握します。 カスタマイズ可能なアラート: カスタム取引条件が満たされ
VERSION MT4        —        ИНСТРУКЦИЯ RUS           —        INSTRUCTIONS  ENG 主な機能: レンダリングなしで正確な入力信号! シグナルが表示されると、それは関連性を維持します。これは、シグナルを提供してからそれを変更し、その結果、入金された資金が失われる可能性があるリドローインジケーターとの重要な違いです。より高い確率と精度で市場に参入できるようになりました。矢印が表示された後、ターゲットに到達する (利益確定) か反転シグナルが表示されるまで、ローソク足に色を付ける機能もあります。 STOP-LOSS/TAKE-PROFITゾーンの表示 エントリーポイントを検索する際の視覚的な明瞭さを改善するために、最適な市場エントリーポイントが検索される購入/販売ゾーンを最初に表示するモジュールが作成されました。ストップロスレベルを操作するための追加のインテリジェントロジックは、時間の経過とともにそのサイズを縮小するのに役立ち、それによって取引に参加するときの初期リスクを軽減します(Move SL)。 より高いタイ
Gold Stuff mt5
Vasiliy Strukov
4.93 (178)
Gold Stuff mt5 は、金専用に設計されたトレンド指標であり、あらゆる金融商品にも使用できます。 インジケーターは再描画せず、遅れません。 推奨時間枠 H1. 設定と個人的なボーナスを得るために、購入後すぐに私に連絡してください!  トレンド スキャナーの強力なサポートを利用して、無料のインジケーターを入手し、プライバシーを守ります。あーみー!   設定 矢印を描く - オンオフ。 チャートに矢印を描く。 アラート - 可聴アラートのオンオフ。 メール通知 - オンオフ。 電子メール通知。 プチ通知 - オンオフ。 プッシュ通知。 次に、色域を調整します。 Gold Stuff mt5 は、金専用に設計されたトレンド指標であり、あらゆる金融商品にも使用できます。 インジケーターは再描画せず、遅れません。 推奨時間枠 H1. 設定と個人的なボーナスを得るために、購入後すぐに私に連絡してください!   設定 矢印を描く - オンオフ。 チャートに矢印を描く。 アラート - 可聴アラートのオンオフ。 メール通知 - オンオフ。 電子メール通知。 プチ通知 - オンオ
FourAverageは、トレンド検出の新しい単語です。 情報技術の発展と多数の参加者に伴い、金融市場は時代遅れの指標による分析にあまり適していなくなっています。 移動平均や確率などの従来のテクニカル分析ツールは、純粋な形でトレンドの方向やその反転を決定することはできません。 1つの指標は、14年の歴史に基づいて、そのパラメータを変更することなく、将来の価格の正しい方向を示すことができますか? 同時に、横向きの市場の動きで妥当性を失うことはありませんか? 答え:はい、それはできます。 私たちのチームは、変化する市場の状況に適応するためのかなり強力で効果的なメカニズムを持つ指標を開発しました。 2025年には、主要なトレンド指標"Four平均"は開発の新しい段階に入っています。 現代の暗号通貨と株式市場は、この指標のために作成されたようです。 独自の平滑化式を使用すると、通貨ペアまたは他の楽器の任意の機能のための指標を調整(パターンを識別)することができます。 さて、利益を上げるためには、1つの指標で十分であり、これはほんの始まりに過ぎません。 他のツールと組み合わせて、または信号フィル
FX Levels: あらゆる市場における非常に高精度なサポート&レジスタンス 概要 通貨ペア、株式指数、個別銘柄やコモディティなど、どのような市場でも信頼できるサポートとレジスタンスを特定したいですか? FX Levels は伝統的な “Lighthouse” メソッドと先進的な動的アプローチを融合し、ほぼ汎用的な精度を実現します。ブローカーの実務経験を活かし、自動化されたデイリー更新とリアルタイム更新を組み合わせることで、 FX Levels は反転ポイントを見つけ、利益目標を設定し、自信をもってトレードを管理するための手助けをします。今すぐ試してみて、サポート/レジスタンス分析の正確性がどれほどトレードを向上させるかを実感してください! 1. FX Levels がトレーダーにとって非常に有用な理由 非常に正確なサポート&レジスタンスゾーン • FX Levels は異なるブローカー環境でもほぼ同一のゾーンを生成するよう設計されており、データフィードの差異や時刻設定のずれによる不一致を解消します。 • つまり、どのブローカーを利用していても一貫したレベルが得られるため、戦
Matrix Arrow Indicator MT5
Juvenille Emperor Limited
5 (13)
マトリックスアローインジケーターMT5は、すべてのシンボル/商品(外国為替、商品、暗号通貨、インデックス、株式)で使用できる100%再描画されていないマルチタイムフレームインジケーターに続くユニークな10in1トレンドです。マトリックスアローインジケーターMT5は、初期段階で現在のトレンドを判断し、最大10の標準インジケーターから情報とデータを収集します。 平均方向移動指数(ADX) 商品チャネルインデックス(CCI) クラシック平研アシキャンドル 移動平均 移動平均収束発散(MACD) 相対活力指数(RVI) 相対力指数(RSI) 放物線SAR ストキャスティクス ウィリアムズのパーセント範囲 すべてのインジケーターが有効な買いまたは売りシグナルを与えると、対応する矢印がチャートに印刷され、次のろうそく/バーの開始時に強い上昇トレンド/下降トレンドを示します。ユーザーは、使用するインジケーターを選択し、各インジケーターのパラメーターを個別に調整できます。マトリックスアローインジケーターMT5は選択されたインディケーターからのみ情報を収集し、それらのデータのみに基づいてアローを印刷
IX Power: 指数、商品、暗号資産、外国為替市場の洞察を発見 概要 IX Power は、指数、商品、暗号資産、外国為替市場の強弱を分析するための多用途ツールです。 FX Power が全ての利用可能な通貨ペアデータを活用して外為ペアで最高の精度を提供する一方、 IX Power は基礎資産の市場データにのみ焦点を当てています。この特性により、 IX Power は非外為市場に最適であり、単純な外為分析にも信頼性の高いツールです。どのチャートでもスムーズに機能し、取引判断を向上させるための明確で実行可能な洞察を提供します。 1. IX Power がトレーダーにとって価値がある理由 複数市場での強弱分析 • IX Power は指数、商品、暗号資産、外為シンボルの強弱を計算し、それぞれの市場に合わせた洞察を提供します。 • US30、WTI、ゴールド、ビットコイン、または通貨ペアなどの資産を監視して取引機会を発見できます。 幅広い市場に適応 • 外為取引では、 FX Power が関連する全ての通貨ペアを分析することで比類のない精度を提供します。 • IX Power
反転ゾーン / ピークボリューム / 主要プレーヤーのアクティブゾーン =       TS TPSプロシステム 説明書 RUS       /       説明書     英語     /           バージョン MT4        このインジケーターを購入したすべての購入者は、さらに以下を無料で受け取ります: RFI SIGNALS サービスからの取引シグナルへの 6 か月間のアクセス - TPSproSYSTEM アルゴリズムに従った既製のエントリ ポイント。 定期的に更新されるトレーニング資料 - 戦略に没頭し、プロフェッショナル レベルを高めます。 平日は 24 時間 365 日サポート、非公開のトレーダー チャットへのアクセス - コミュニケーション、サポート、市場状況の分析。 著者の設定ファイル - 余分な労力をかけずに最大の結果を達成するための自動インジケーター設定。 主な機能: 売り手と買い手のアクティブなゾーンを表示します。 このインジケーターは、購入と販売の正しい最初のインパルス レベル/ゾーンをすべて表示します。これらのレベル/ゾーンがアクティブに
これはほぼ間違いなく、MetaTraderプラットフォームで見つけることができる最も完全な調和価格形成自動認識インジケーターです。 19種類のパターンを検出し、フィボナッチプロジェクションをあなたと同じように真剣に受け止め、潜在的逆転ゾーン(PRZ)を表示し、適切なストップロスとテイクプロフィットレベルを見つけます。 [ インストールガイド | 更新ガイド | トラブルシューティング | よくある質問 | すべての製品 ] 19の異なる調和価格形成を検出します プライマリ、派生および補完フィボナッチ投影(PRZ)をプロットします 過去の価格行動を評価し、過去のすべてのパターンを表示します この指標は、独自の品質とパフォーマンスを分析します 適切なストップロスとテイクプロフィットのレベルを表示します ブレイクアウトを使用して適切な取引を通知します すべてのパターン比をグラフにプロットします 電子メール/音声/視覚アラートを実装します スコット・M・カーニーの本に着想を得て、この指標は最も純粋で急を要するトレーダーのニーズを満たすように設計されています。ただし、トレードを容易にする
次世代の自動化された需要と供給のゾーン。どのチャートでも機能する新しい革新的なアルゴリズム。すべてのゾーンは、市場の価格行動に従って動的に作成されています。 2種類のアラート --> 1) 価格がゾーンに達したとき 2) 新しいゾーンが形成されたとき もう 1 つの役に立たない指標はありません。実績のある完全な取引戦略を手に入れることができます。     新機能:     価格が需給ゾーンに達したときにアラートを出す     新しい需給ゾーンが作成されたときにアラートを発します     プッシュ通知アラート     ピップ単位のゾーン幅ラベル     MTF のもう 1 つのタイムフレーム。したがって、現在より 2 時間足高いのではなく、現在より 3 時間足し上に見えるようになります。     アラート/ゾーン/MTF 機能を有効/無効にするボタン あなたが得る利点:     取引から感情を取り除きます。     取引エントリをオブジェクト化します。     確率の高いセットアップで利益を上げましょう。     描画ゾーンから時間を節約します。
プレシジョン・インデックス・オシレーター(Pi-Osc)は、Precision Trading SystemsのRoger Medcalfによるものです。 バージョン2は、チャートにスーパーファストでロードされるように注意深く再コードされ、その他の技術的な改良も組み込まれて、エクスペリエンスを向上させています。 Pi-Oscは、市場が強制的に行かなければならない、すべての人のストップを取り除くためのポイントである、極限のエクソースト・ポイントを見つけるために設計された正確な取引タイミング信号を提供するために作成されました。 この製品は、極限のポイントがどこにあるかを知るという古代の問題を解決し、トレーダーの生活をはるかにシンプルにします。 これは、業界標準のオシレーターとは異なる強力な要素を持つ高度なコンセンサス・インジケーターです。 使用されている一部の機能には、需要指数、マネーフロー、RSI、スティリング、パターン認識、出来高分析、標準偏差の極値などがあり、異なる長さでこれらのバリエーションが多く含まれています。 初めて見ると、訓練されていない目には、他のオシレーター
The   Time_Price_SQ9_Degree   indicator is based on the 9 Gann square. Using this indicator, you can identify strong time and price zones. The indicator displays the levels as a degree value. The degrees can be set in the settings. After launching, the MENU button appears. If it is highlighted, it can be moved to any point on the graph, and after double-clicking on it, it stops being highlighted and menu buttons appear. To hide the menu, just double-click on the button, it will become highlight
FX Dynamic: カスタマイズ可能なATR分析でボラティリティとトレンドを把握 概要 FX Dynamic は平均的な真のレンジ(ATR)の計算を活用して、日次および日中ボラティリティに関する卓越した情報をトレーダーに提供する強力なツールです。80%、100%、130%などのボラティリティ閾値を設定することで、通常の範囲を超えた際にすぐに警告を受け取ったり、有望な利益機会を素早く捉えられます。 FX Dynamic はブローカーのタイムゾーンに合わせて調整でき、安定したボラティリティ測定を維持しながら、リアルタイム分析のためにMetaTraderとシームレスに連携します。 1. なぜFX Dynamicがトレーダーにとって非常に有益か リアルタイムのATRインサイト • 日次・日中のボラティリティをひと目で把握。価格がATRの80%、100%、130%などに達したときに警告を受け取り、重要な水準にあるかどうかを確認できます。 • ボラティリティが完全に爆発する前に潜在的な反転やブレイクアウトを先取り可能。 幅広いマーケットへの適用 • 外国為替、コモディティ、株価指数な
回帰取引を意味する専門的かつ定量的なアプローチを実装する独自の指標。これは、価格が予測可能かつ測定可能な方法で迂回して平均に戻るという事実を利用しており、非定量的な取引戦略を大幅に上回る明確な出入りルールを可能にします。 [ Installation Guide | Update Guide | Troubleshooting | FAQ | All Products ] 明確な取引シグナル 驚くほど簡単に取引できます カスタマイズ可能な色とサイズ パフォーマンス統計を実装します ほとんどの取引戦略を上回ります 適切なSLおよびTPレベルを表示します 電子メール/音声/視覚アラートを実装します 使い方 インディケータは、より高い時間枠からの完全にカスタマイズ可能な移動平均の周りの標準偏差を測定し、トレンドフォローアプローチを使用して正確に取引を見つけます。取引は、現在のチャートの価格アクションに飛び込むことによって見つけられ、価格が選択したより高い時間枠から計算された平均価格帯に戻ったときに閉じられます。それがコード化される方法のために、指標は高ボラティリティと強いトレンドの市場か
まず第一に、この取引ツールはノンリペイント、ノンリドロー、ノンラグの指標であり、プロの取引に理想的ですことを強調する価値があります。 オンラインコース、ユーザーマニュアル、デモ。 スマートプライスアクションコンセプトインジケーターは、新米から経験豊富なトレーダーまで、非常 に強力なツールです。Inner Circle Trader AnalysisやSmart Money Concepts Trading Strategiesなど、20以上の有用な指標を1つに組み合わせています。このインジケーターはスマートマネーコンセプトに焦点を当て、大手機関の取引方法を提供し、彼らの動きを予測するのに役立ちます。 特に、流動性分析に優れており、機関がどのように取引しているかを理解しやすくしています。市場のトレンドを予測し、価格の動きを慎重に分析するのに優れています。機関の戦略とトレードを合わせることで、市場の動向についてより正確な予測ができます。このインジケーターは多目的であり、市場構造を分析し、重要な注文ブロックを特定し、さまざまなパターンを認識するのに優れています。 このインジケーター
サポート線と抵抗線のプロットにうんざりしていませんか? サポートレジスタンス は、非常に興味深いひねりを加えてチャート内のサポートとレジスタンスラインを自動検出およびプロットするマルチタイムフレームインジケーターです。価格レベルは時間とともにテストされ、その重要性が高まるにつれて、ラインは太くなり、暗くなります。 [ インストールガイド | 更新ガイド | トラブルシューティング | よくある質問 | すべての製品 ] 一晩でテクニカル分析を強化 チャートを閲覧せずに重要な価格レベルを検出 一目ですべての価格レベルの相対的な強さを認識する すべての取引で最大30時間のプロットラインを節約 インジケーターは、すべての価格レベルの年齢を表示します インジケーターは再描画されていません 過去および現在の価格レベルは近接によって崩壊し、現在の市場行動に合わせて調整されます。動作は、必ずしもピークではない場所に線が引かれます。 価格レベルは、時間とともに拒否されるにつれて、より暗く、より広くなります ノイズを避けるために、重要でない価格レベルは定期的にクリアされます カスタマイズ可能な時間枠の
Legend mt5
Vladyslava Shaviernieva
This is an indicator that includes the best basic forex indicators , without redrawing. Based on this data, a sell or buy signal is generated. It does not disappear anywhere after the signal, which gives us the opportunity to see the results on the history. It can be used on any currency pair, crypto, metals, stocks It is best used on an hourly chart, but other periods are also acceptable. The best results for the period H1,H4,daily If customers have any questions, I will answer them and af
説明 ICSM(Impulse-Correction SCOB Mapper)は、価格の動きを分析し、有効なインパルス、修正、およびSCOB(Single Candle Order Block)を識別するインジケーターです。柔軟性があり、情報量が多く、使いやすく、最も流動性の高い関心領域に対するトレーダーの認識を大幅に向上させるため、あらゆるタイプのテクニカル分析で使用できる強力なツールです。 設定 一般 | ビジュアル カラーテーマ — ICSMのカラーテーマを定義します。 SCOB | ビジュアル SCOBを表示 — SCOBを有効/無効にします; SCOBをマークする — SCOB表現のスタイルオプションのリストを表します; SCOB色 — SCOBの色を定義します; ICM | ビジュアル ICMラインを表示 — ICM(Impulse-Correction Mapper)ラインを有効/無効にします; ICトレンドを表示 — チャートの下部にある色付きの仕切りを通じてインパルス-修正トレンドの視覚化を有効/無効にします; ライン色 — ICMラインの色
Auto Order Block with break of structure based on ICT and Smart Money Concepts (SMC) Futures Break of Structure ( BoS )             Order block ( OB )            Higher time frame Order block / Point of Interest ( POI )    shown on current chart           Fair value Gap ( FVG ) / Imbalance   -  MTF      ( Multi Time Frame )    HH/LL/HL/LH  -  MTF      ( Multi Time Frame )  Choch  MTF      ( Multi Time Frame )  Volume Imbalance     ,  MTF          vIMB Gap’s Power of 3 Equal High / Low’s  
ICT, SMC, SMART MONEY CONCEPTS, SMART MONEY, Smart Money Concept, Support and Resistance, Trend Analysis, Price Action, Market Structure, Order Blocks, BOS/CHoCH,   Breaker Blocks ,  Momentum Shift,   Supply&Demand Zone/Order Blocks , Strong Imbalance,   HH/LL/HL/LH,    Fair Value Gap, FVG,  Premium  &   Discount   Zones, Fibonacci Retracement, OTE, Buy Side Liquidity, Sell Side Liquidity, BSL/SSL Taken, Equal Highs & Lows, MTF Dashboard, Multiple Time Frame, BigBar, HTF OB, HTF Market Structure
トレンド検出インジケーターはあらゆる戦略を補完し、独立したツールとしても使用できます。 インジケーターの操作に関する推奨事項、コメント   #8   でダウンロードできます 利点 使いやすく、不要な情報でチャートを過負荷にしません。 あらゆる戦略のフィルターとして使用できます。 利益を得るのとストップロスを設定するの両方に使用できる動的なサポートとレジスタンスのレベルが組み込まれています。 ローソク足が閉じた後、インジケーターの色は変わりません。  株式市場、指数、石油、金、およびすべての時間枠で機能します。 トースト通知、電子メール通知、プッシュ通知、サウンドアラートの機能があります。 私の他の開発はここで見つけることができます: https://www.mql5.com/ja/users/mechanic/seller 入力パラメータ Alert-オン/オフ。アラート; Push Notification-オン/オフ。プッシュ通知; Mail-オン/オフ電子メール通知; Fibo 1,2,3,4,5,6,7,11,21,31,41,51,61,71-動的サポートと抵抗レベル
Easy Buy Sell is a market indicator for opening and closing positions. It becomes easy to track market entries with alerts. It indicates trend reversal points when a price reaches extreme values ​​and the most favorable time to enter the market. it is as effective as a Fibonacci to find a level but it uses different tools such as an algorithm based on ATR indicators and Stochastic Oscillator. You can modify these two parameters as you wish to adapt the settings to the desired period. It cannot
作者のその他のプロダクト
EA for gold trading that best works on 15m time frame at Meta trader-5. Also can use for GBPUSD, AUDUSD, NZDUSD work on 30M chart. ***I have given you free please positive Review*** I will provide more customization option with more profitability**  It works best only in gold as it's best customization for gold. I am experienced trader as well as developer so here I have presented my strategy. It's build with Moving average and Parabolic Sar indicators. I used two moving average and Parabolic
FREE
Hello Traders, Introducing a powerful indicator designed to enhance your buy/sell decisions by combining 15 different indicators into one. This unique combination helps minimize false entries, providing you with a more reliable trading strategy. The indicator is easy to use: an upward arrow signals a buy opportunity, while a downward arrow suggests a sell. The indicator is highly versatile and can be applied to any currency pair and any timeframe. However, for optimal performance, I recommend us
AUDUSD Trading Expert Advisor: Overview ***I have given you free please positive Review*** I will provide more customization option with more profitability** 10-13% Drawdown(DD)   ***Updated with customization Options*** This Expert Advisor (EA) is designed for trading AUDUSD on a 30-minute timeframe. It utilizes Moving Averages (MAs) and Parabolic SAR (PSAR) indicators to generate buy and sell signals. The EA ensures that trades have a stop loss (SL) and take profit (TP) to manage risk effecti
Hi, For real setting file or test file knock me.  best for us-100cash us-30, gold etc. Thank you.... Special offer!! for 10 persons only. Then price will revise to 500usd. You may use my free EA name:Gold Hero, Audusd Boss This is the Multi-forex EA can use for most of the pairs as need setting change. Input parameter  you can change yourself for better result. Here I use three indicators as Parabolic SAR and two EMA, Based on the indicator set up signal will create. All entry have SL and TP, l
Hello Traders, *-For your bonus one indicator with SL,TP zone* just give your review, comment.Once finish developing I will give you**** Trend identification Indicator This is a indicator that will identify trend zone as bearish and bullish zone . This indicator can use for all pairs and any timeframe you can use it . *Green lime mean buy.Red line mean sell.You will receive alert sound when signal generate. The create best on high, low point and moving average calculation. You can customize valu
フィルタ:
レビューなし
レビューに返信