Fxaccurate TCT
- インディケータ
- Shiv Raj Kumawat
- バージョン: 1.0
- アクティベーション: 5
WHY IS OUR FXACCCURATE TCT MT5 THE PROFITABLE ?
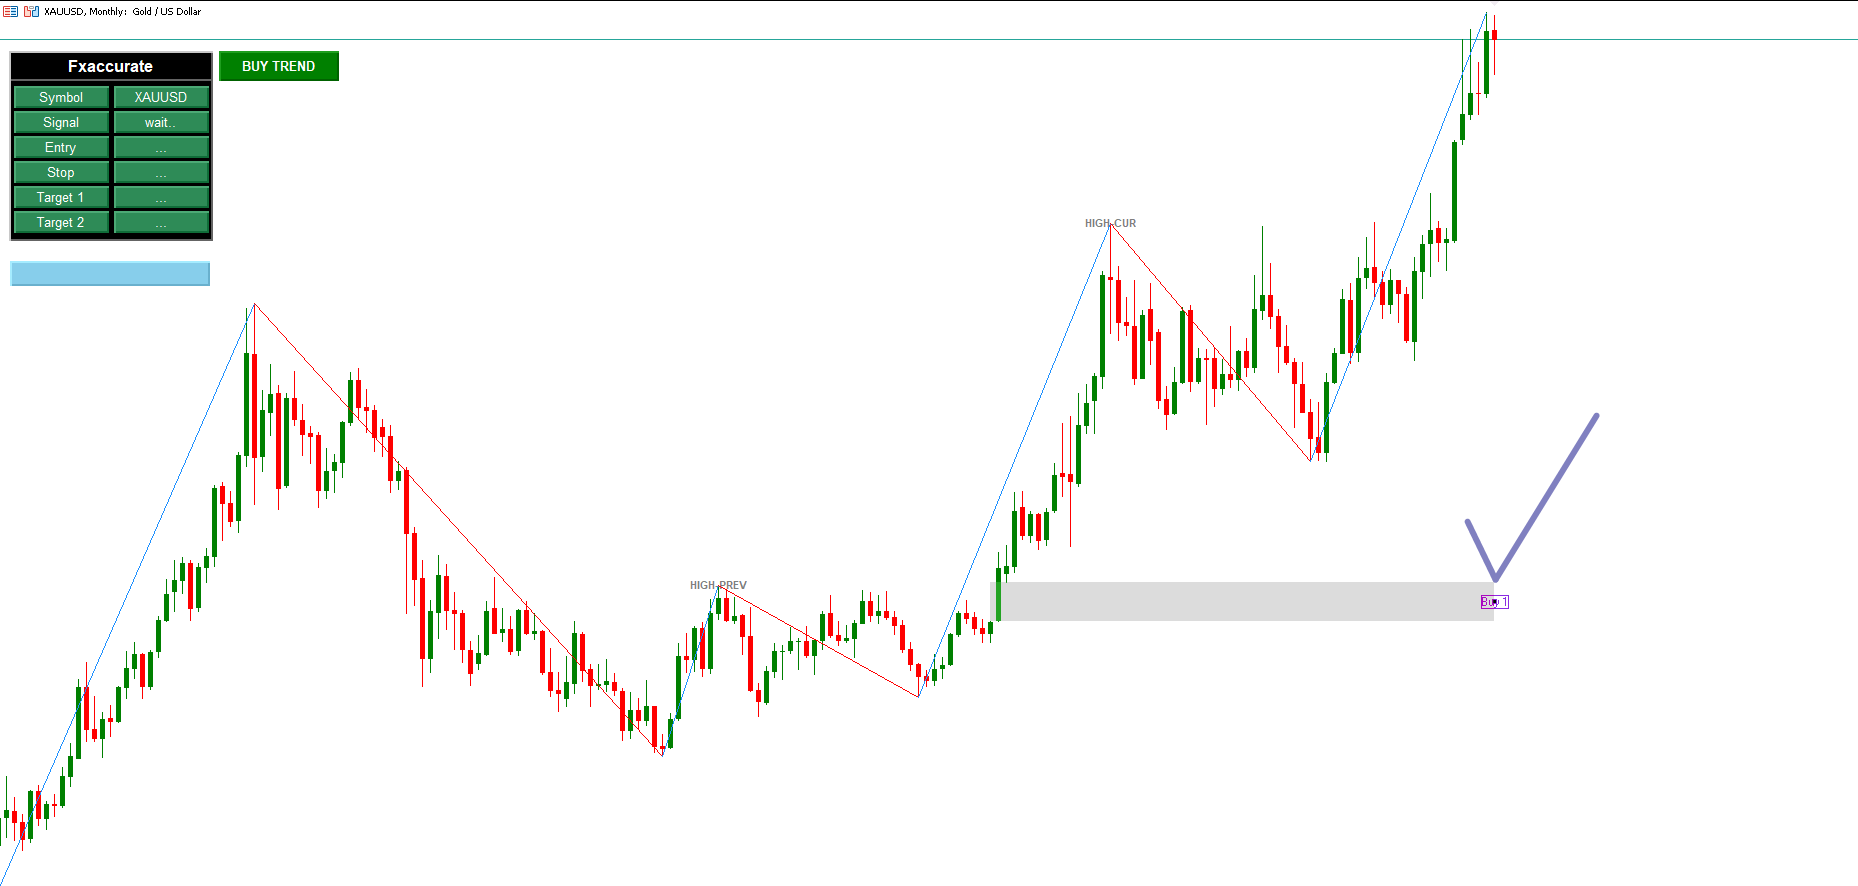
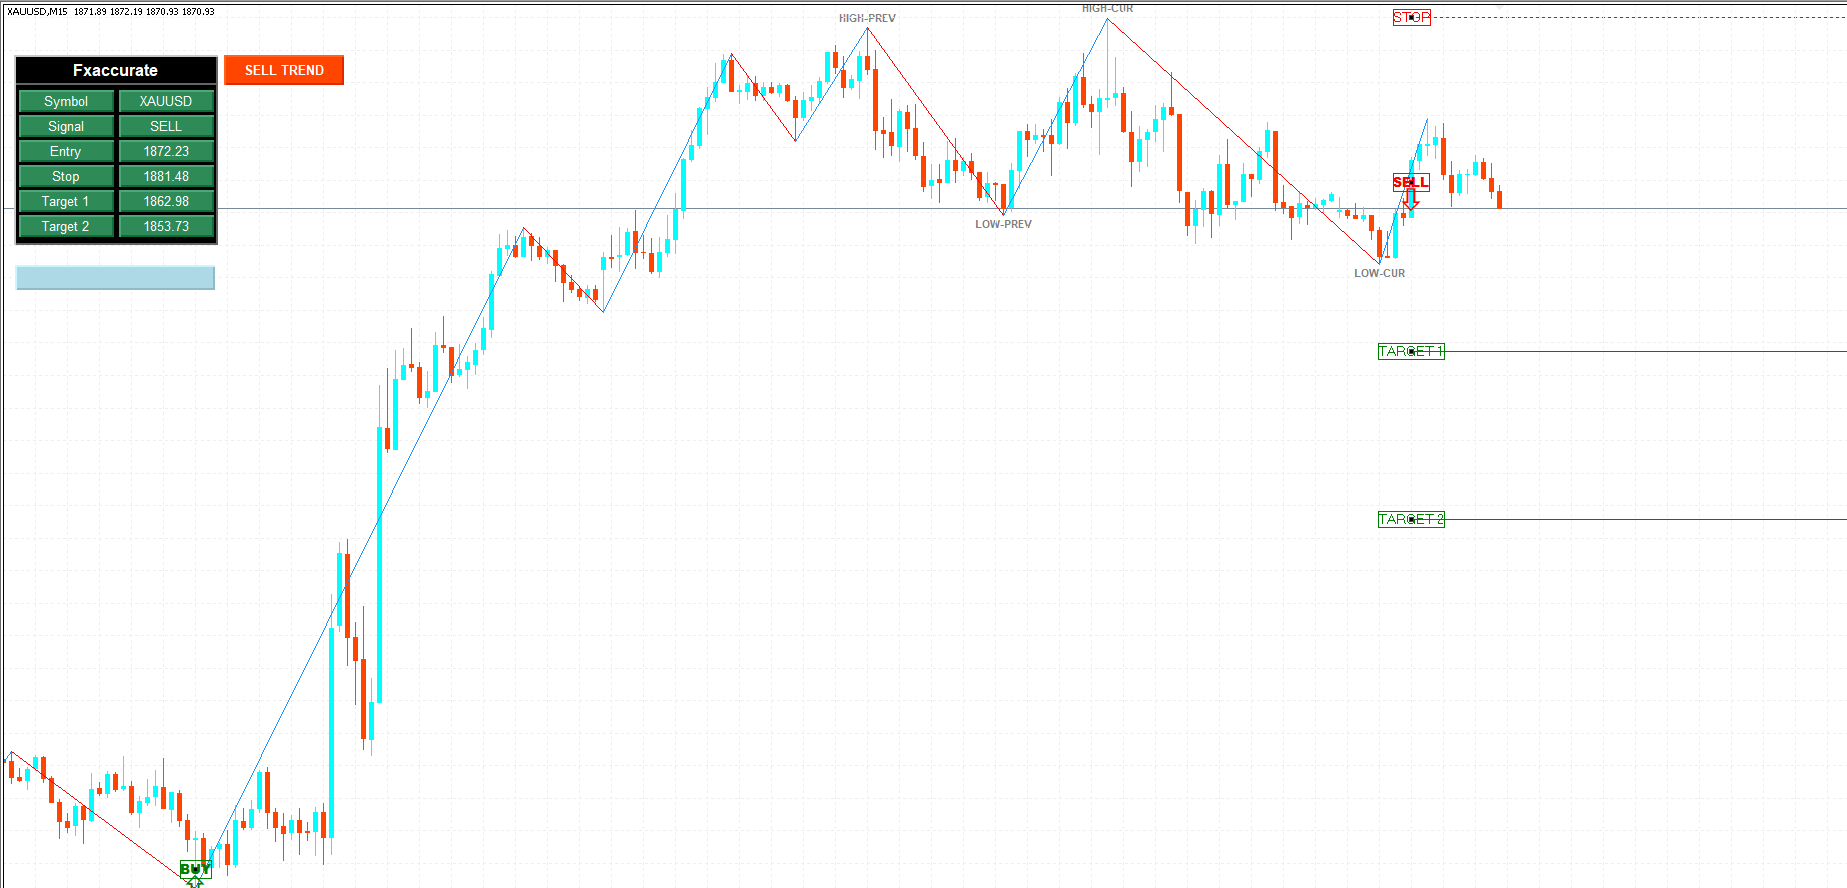
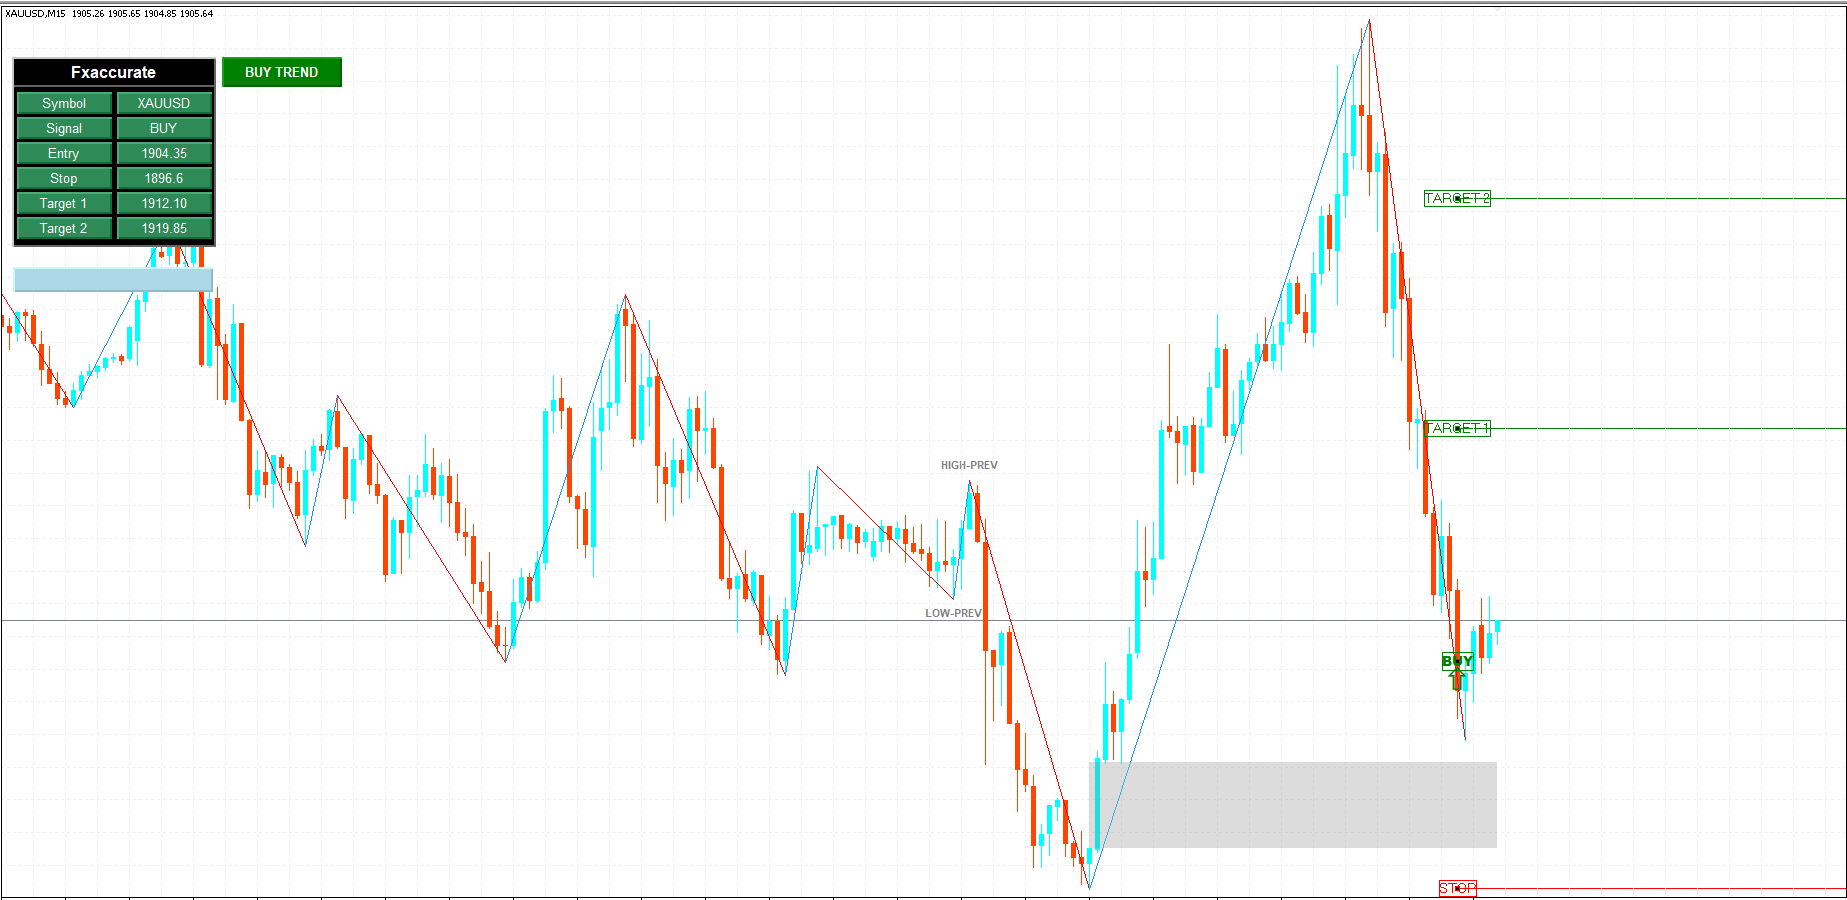
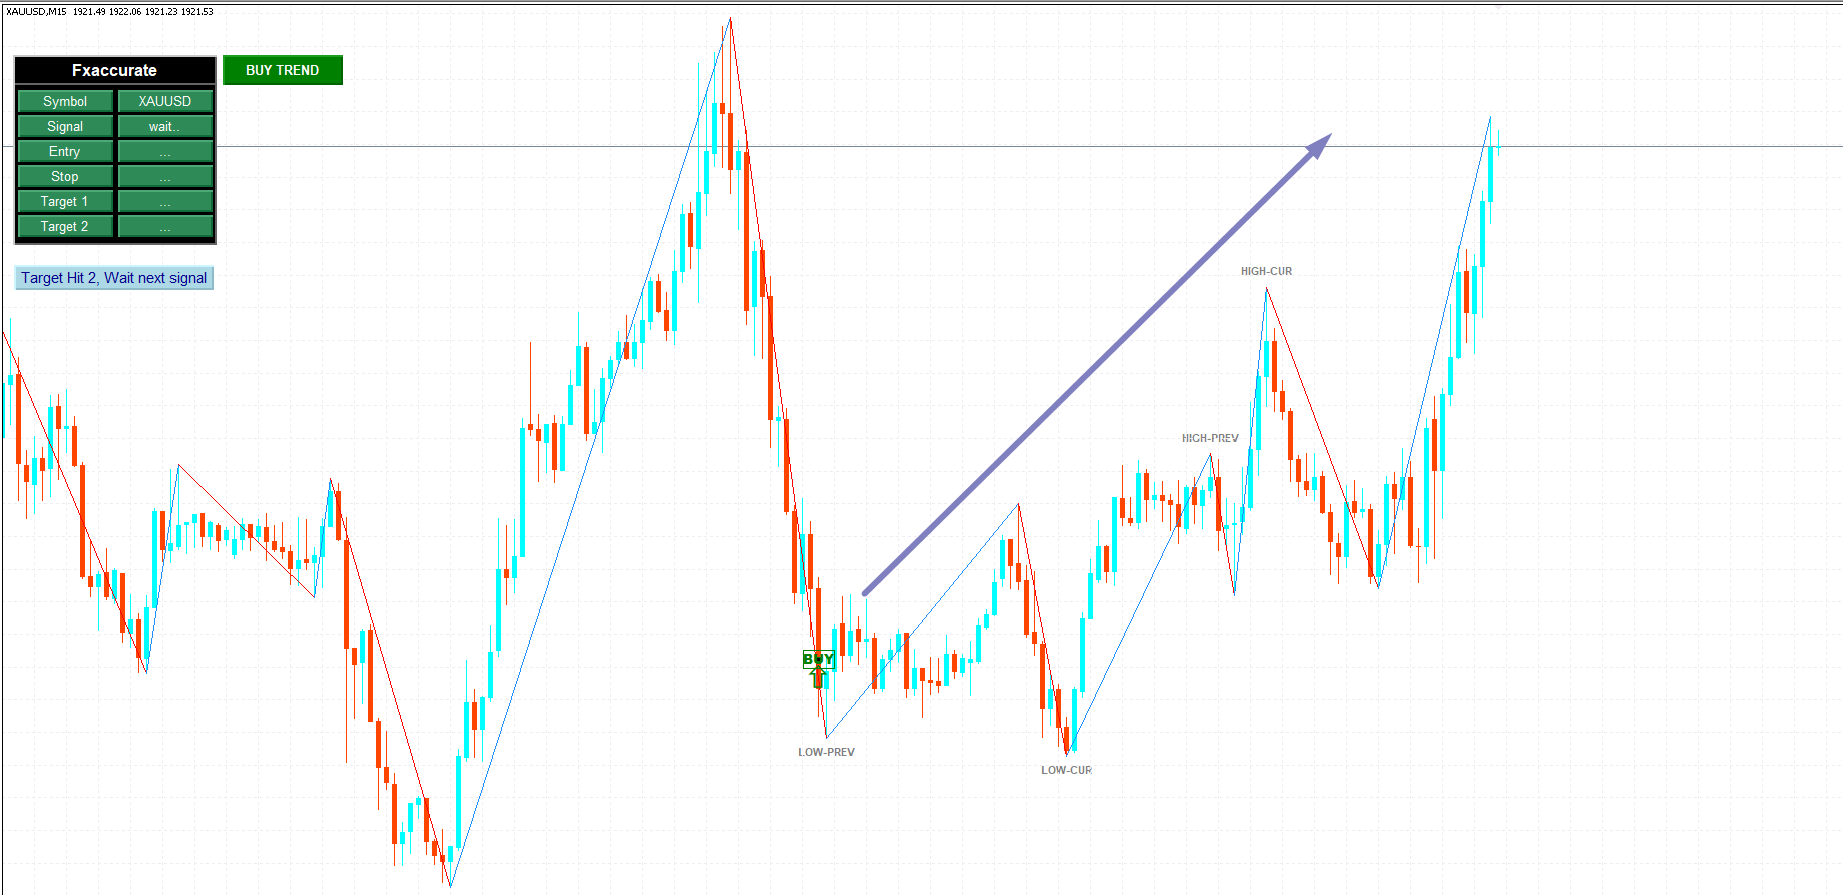
Gives entry, stop and target levels from time to time. It finds Trading opportunities by analyzing what the price is doing during established trends.
We have made these indicators with a lot of years of hard work. It is made at a very advanced level.
Established trends provide dozens of trading opportunities, but most trend indicators completely ignore them! The trend reveals trading indicator represents an average of 10 different trades per trend.

ユーザーは評価に対して何もコメントを残しませんでした