Algorithm Trend
- インディケータ
- Abderrazzak Larhouali
- バージョン: 1.0
- アクティベーション: 5
Welcome, thank you for choosing us
Read carefully before starting
If you want to trade on a demo account, put the indicator there. If you want to trade on a real account, put the indicator there and wait about two hours for the data to be collected again. The data differs between the demo and real accounts in several factors.
We offer you the latest indicators that will help you make decisions after creating your own technical analysis
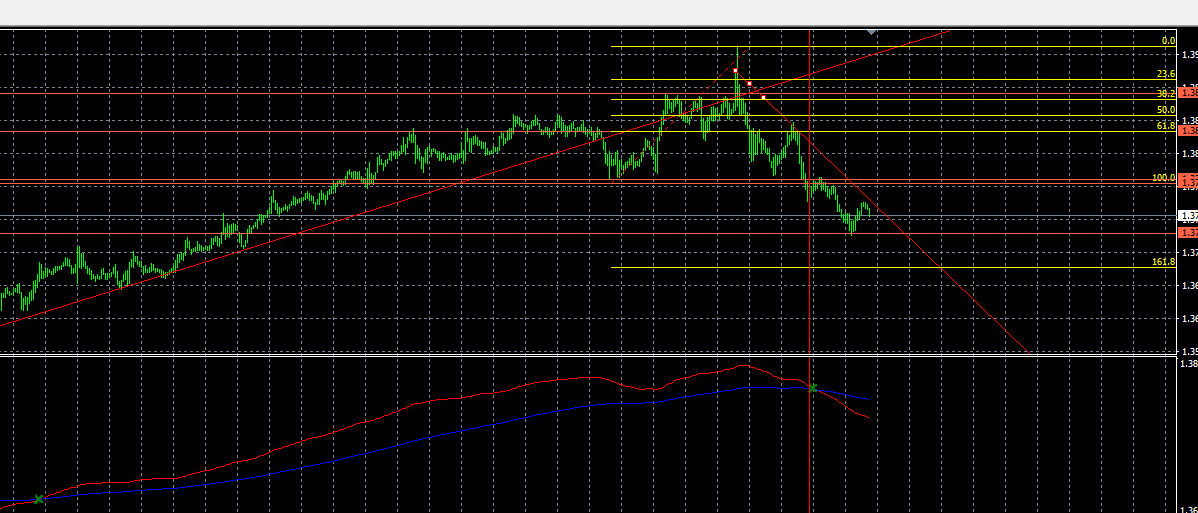
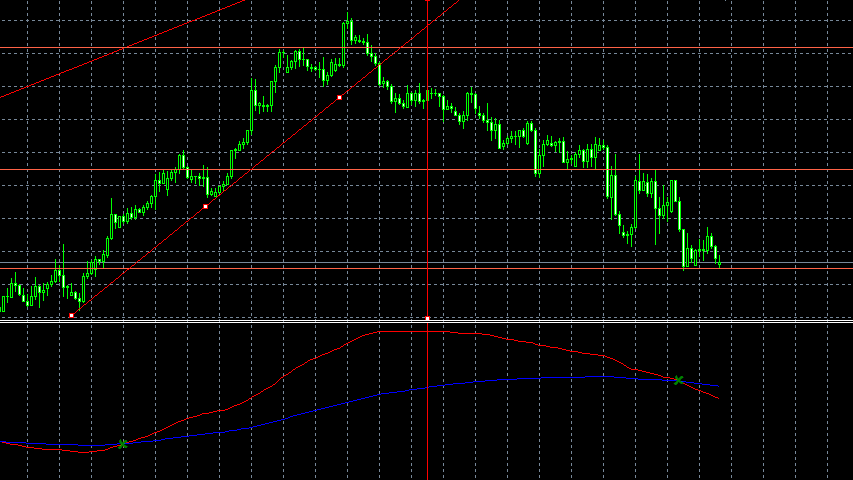
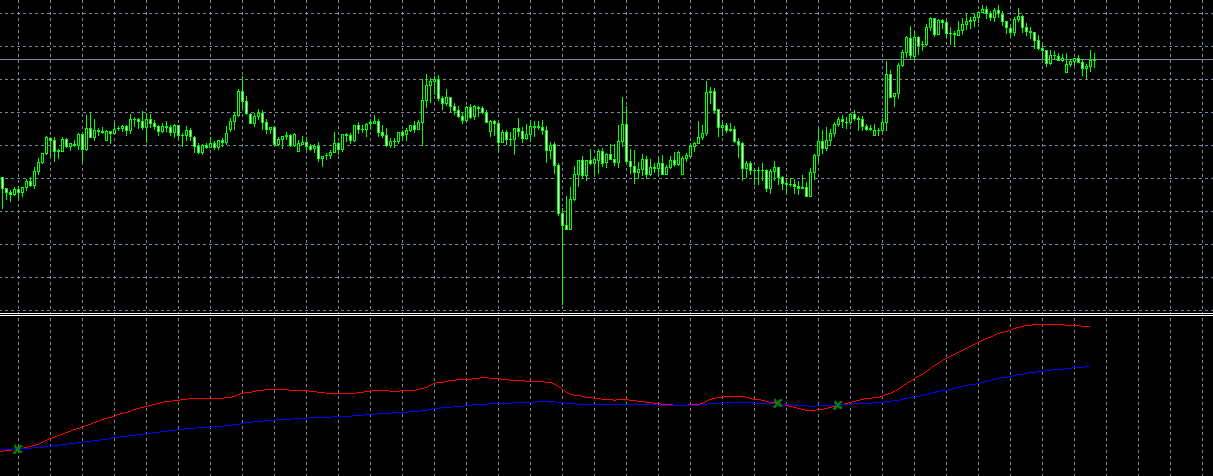
You will see the entry point that you will use to get a good deal
At each intersection there is an opportunity for a deal that the indicator shows you through a mark
It is recommended to use the indicator only in long periods of time, more than half an hour, the opportunities are clear and at a rate of 70 percent
The indicator is still under development in order to add new features and may be transferred to Expert in the future
The initial price will be $ 30 for the current full version
Once the latest version is released, the subscription will be monthly
You can enjoy now and make profits and do not forget that Forex requires patience and do not be greedy when you make profits
a drop of water over time fills the cup