Mauve Expert MT5
- エキスパート
- Ruengrit Loondecha
- バージョン: 24.806
- アクティベーション: 10
---------------------------------------------------------
---------------------------------------------------------
Mauve Expert MT5
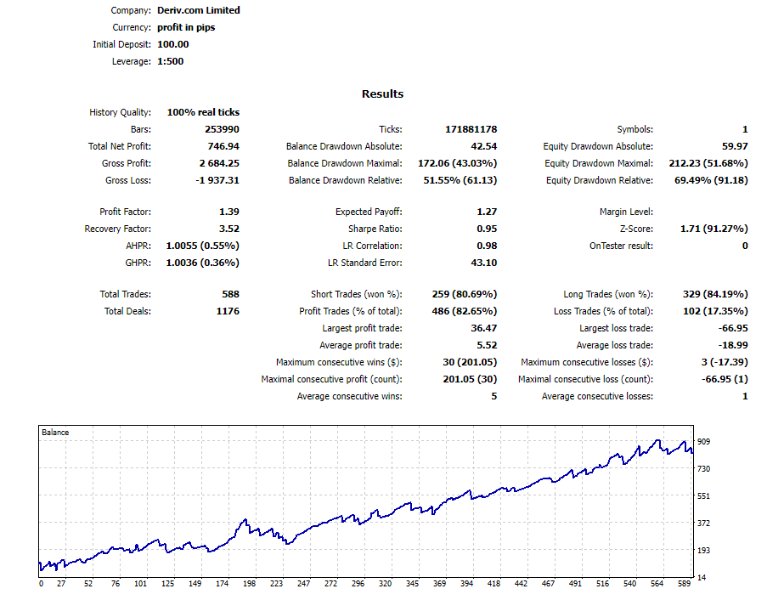
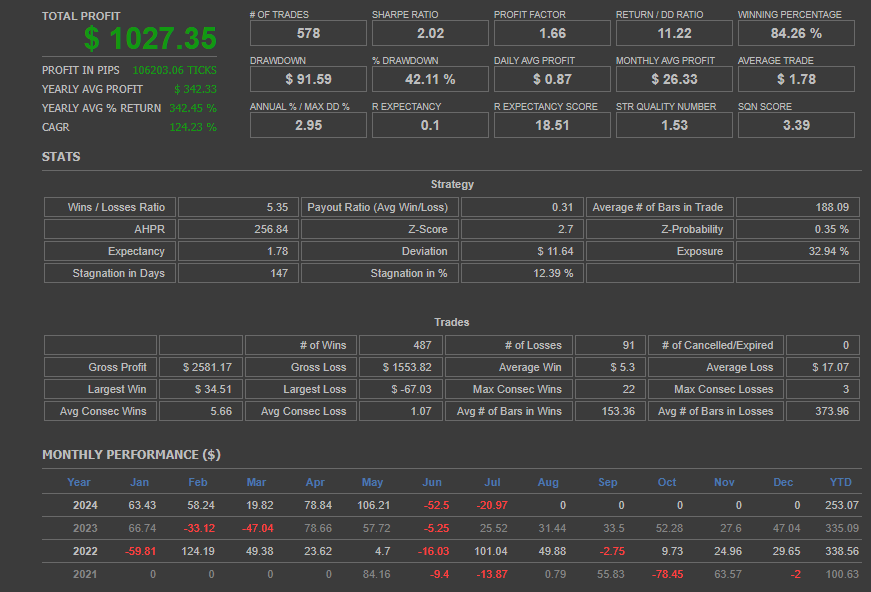
- Optimal Performance: Designed to work best with GOLD on the M5 timeframe.
- Capital Requirements: Minimum starting capital of $100-$300 for a 0.01 lot size (AutoLot feature included).
- Continuous Optimization: Monthly updates to enhance performance and adapt to market conditions.
- Stay Informed: Updates and performance reports in the comments section.
- Live Trading: Follow our live trades at https://t.me/lullfrx
---------------------------------------------------------
Indicators and Concepts
-
Relative Strength Index (RSI):
- RSI is a momentum oscillator that measures the speed and change of price movements on a scale of 0 to 100. Values above 70 indicate overbought conditions, while values below 30 suggest oversold conditions. It helps identify potential reversal points and the strength of trends.
-
Rate of Change (ROC):
- ROC measures the percentage change in price over a specified period, indicating the rate at which the price is changing. It helps assess the strength and speed of price movements, highlighting momentum shifts.
-
Momentum:
- Momentum indicates the rate of change of a security's price over time. It helps identify the strength of price movements and potential trend reversals. High momentum values suggest strong price movements, while low values indicate weaker trends.
-
Moving Average Convergence Divergence (MACD):
- MACD is a trend-following momentum indicator that shows the relationship between two moving averages of a security’s price. It includes the MACD line, the signal line, and the histogram, helping to identify trend changes, buy and sell signals, and the strength of momentum.
-
Ichimoku Kinko Hyo:
- The Ichimoku indicator is a comprehensive tool that provides information about support and resistance levels, trend direction, and momentum. It consists of five lines: Tenkan-sen (Conversion Line), Kijun-sen (Base Line), Senkou Span A (Leading Span A), Senkou Span B (Leading Span B), and Chikou Span (Lagging Span). The Ichimoku cloud (Kumo) helps visualize the overall trend and potential reversal points.
Trade Style
-
Reverse Order at Market:
- This involves entering a trade in the opposite direction of the current market trend based on reversal signals. For instance, if the market is currently in an uptrend and a reversal signal is generated, a sell order is placed, and vice versa.
-
Stop Loss (SL) and Take Profit (TP) by Percentage:
- SL and TP levels are set as fixed percentages away from the entry price. This method allows for clear and consistent risk and reward management by defining exit points based on a predetermined percentage.
-
ATR Move SL to Break Even (MoveSL2BE) with Add Pips:
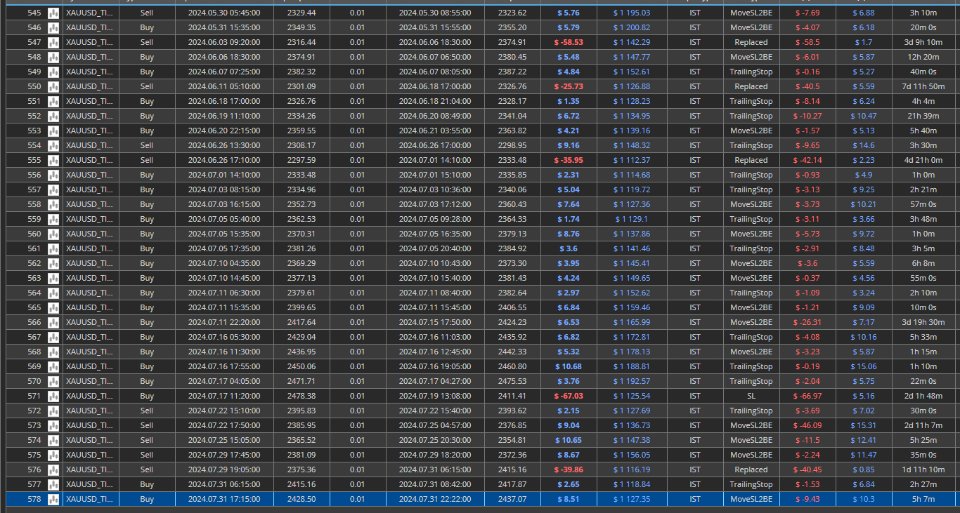
- Once the trade moves favorably, the stop-loss is adjusted to the break-even point (entry price). Additionally, a certain number of pips, calculated based on the ATR, are added to the break-even level to ensure some profit while reducing risk.
-
Trailing Stop by Parabolic SAR:
- The trailing stop is adjusted based on the Parabolic SAR (Stop and Reverse) indicator. The Parabolic SAR provides dynamic stop levels that follow the price trend. For long positions, the trailing stop follows the SAR below the price, while for short positions, it follows the SAR above the price, locking in profits while allowing for trend continuation.

