Adjustable Consecutive Fractals
- インディケータ
- Wayne Theo Botha
- バージョン: 1.0
- アクティベーション: 5
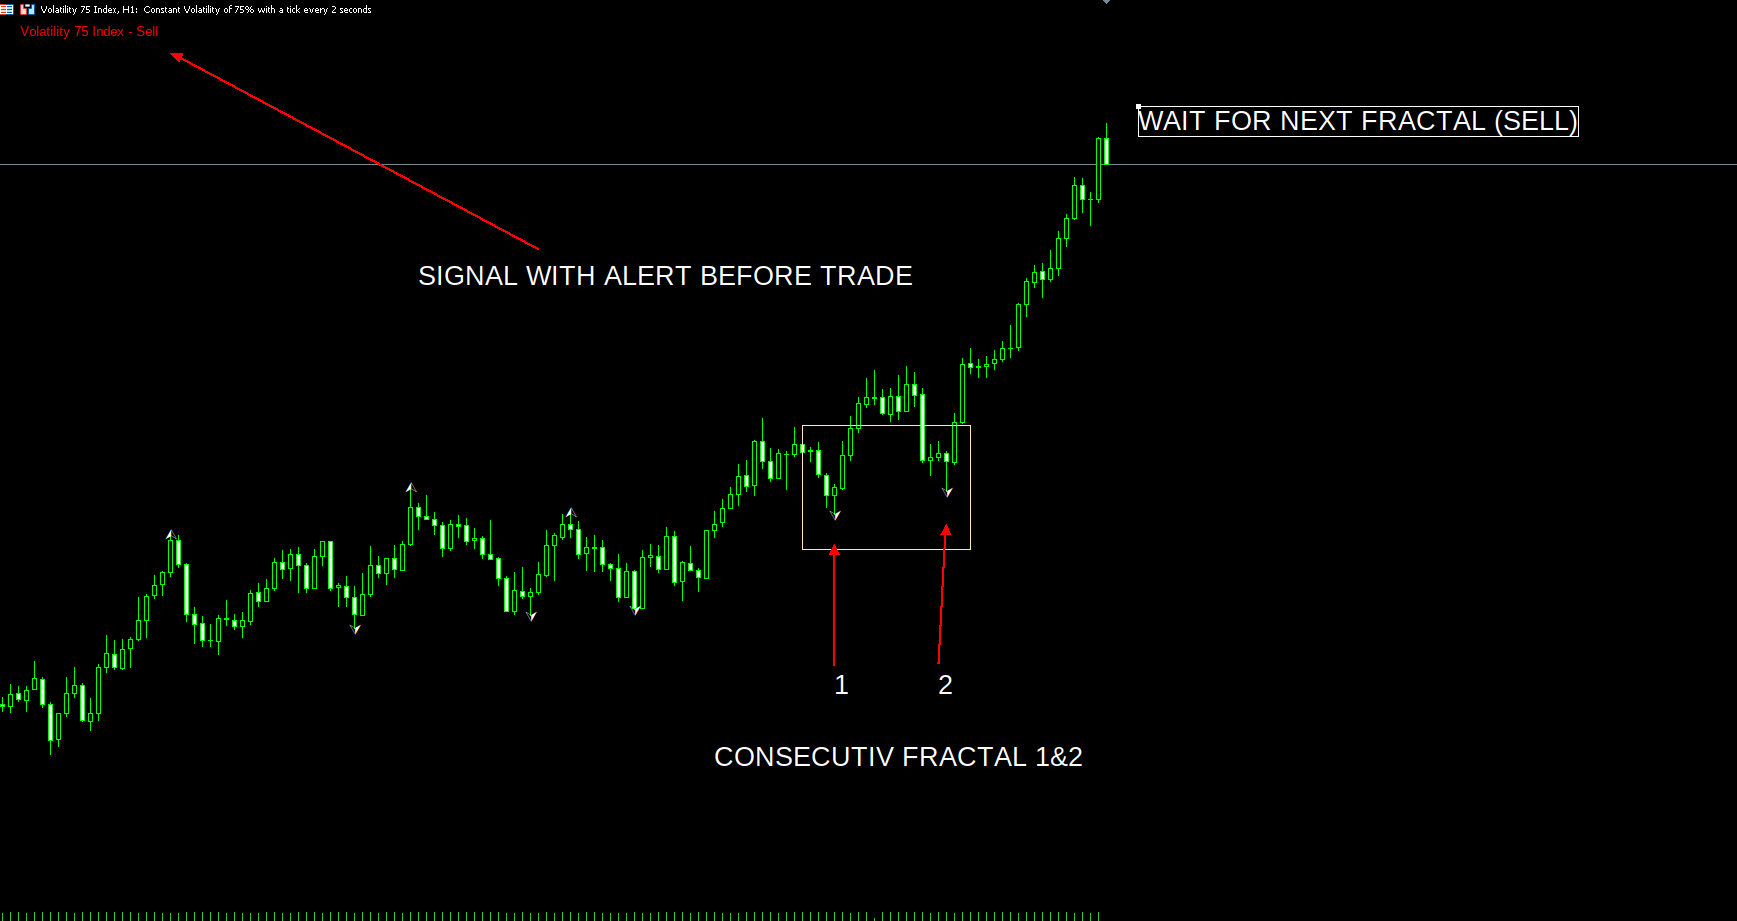
Adjustable Consecutive Fractals looks for 2 or more fractals in one direction and sends out a on screen alert, sound alert and push notification, for strong reversal points .
Adjustable Consecutive Fractals, shows the fractals on chart along with a color changing text for buy and sell signals when one or more fractals appear on one side of price.
Adjustable Consecutive Fractals is based Bill Williams Fractals . The standard Bill Williams fractals are set at a non adjustable 5 bars, BUT withe the My Adjustable Consecutive Fractals , the period of bars is adjustable in the settings to meet your needs , depending on the time frame you choose to trade.
This works on all time frames and has a high probable winning outcome.