Daily candle on lower time frame
- インディケータ
- Raman Kumar Gautam
- バージョン: 1.0
- アクティベーション: 5
無料ダウンロードは、当グループに参加してください。期間限定オファー!
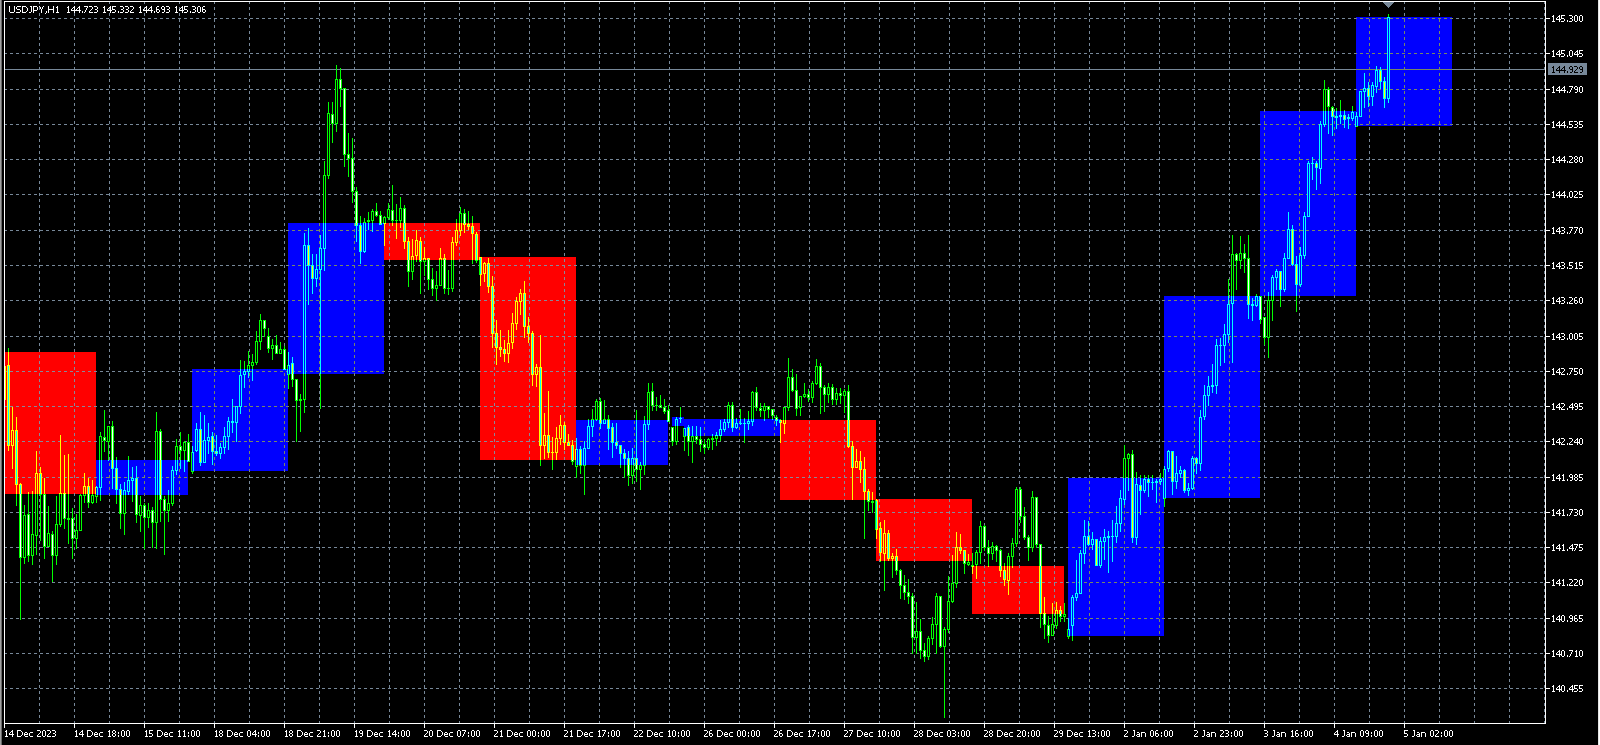
私たちの革新的なMQL5インディケーターを紹介します。これは、ロータイムフレームでの日足キャンドルの境界を明確に視覚的に表示することで、トレーディング体験を向上させるために設計されています。このツールは、日足キャンドルの進行状況を把握し、より良い意思決定と戦略実行を確実にしたいトレーダーに最適です。
主な機能
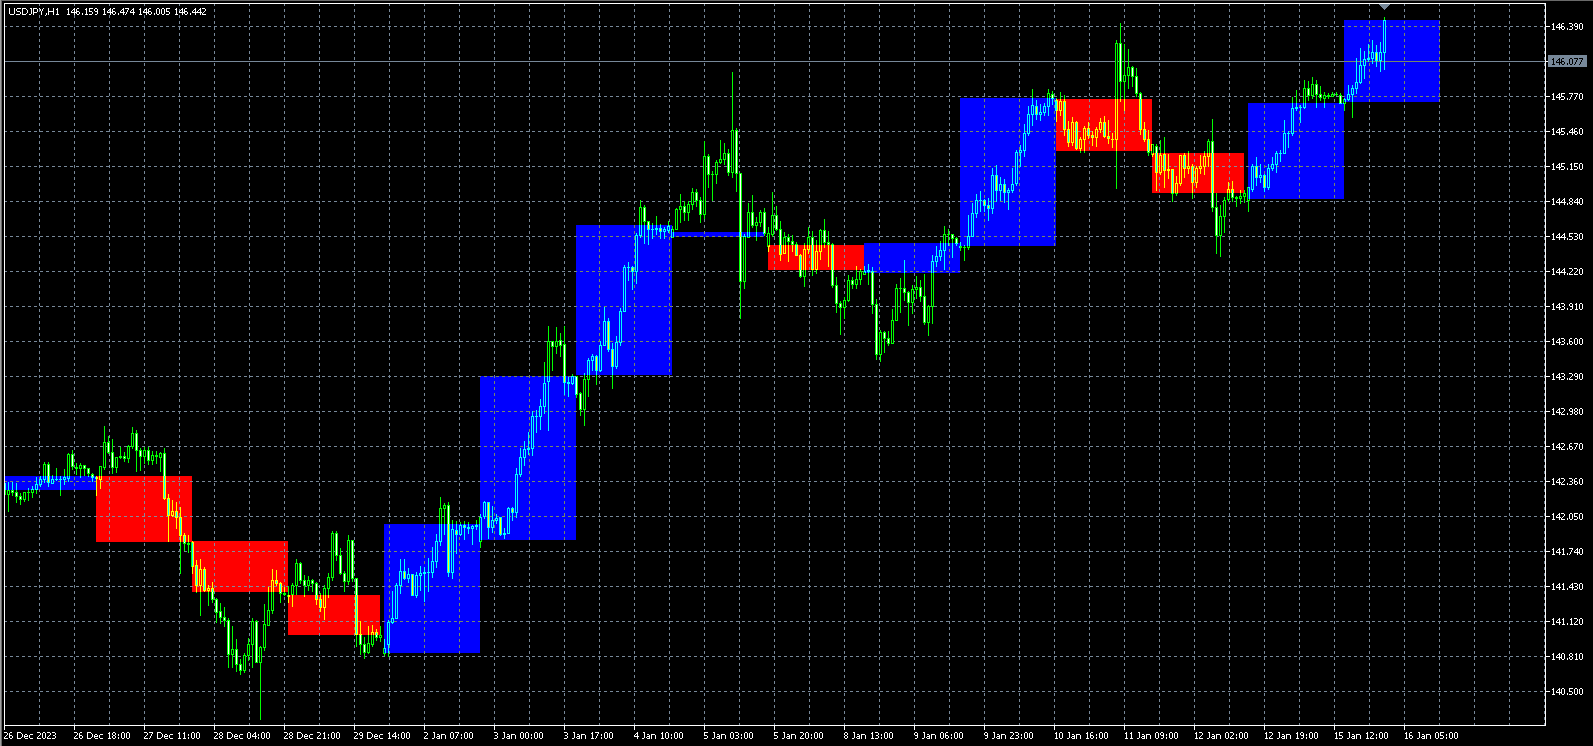
日足キャンドルボックスの視覚化:
- ロータイムフレームで日足キャンドルの開始から終了までの明確なボックスを描画します。
- 日足キャンドルの開始点と終了点を明確にハイライトし、日々の市場動向を追跡するための視覚的な参照を提供します。
チャートの明瞭さの向上:
- きれいで整理されたチャートビューを提供し、トレーダーが画面を乱雑にせずに日々の境界を迅速に識別するのに役立ちます。
- 日々の取引活動の文脈で市場のトレンドやパターンを分析する能力を向上させます。
シームレスな統合:
- 既存のMQL5プラットフォーム設定に簡単に統合され、迅速なインストールと即時使用が可能です。
- M1、M5、M15、M30、H1などの様々なロータイムフレームと互換性があります。
カスタマイズオプション:
- チャートの好みに合わせて調整可能なボックスの色やスタイル、視認性を向上させます。
- 特定のトレーディングニーズに合わせてインディケーターを調整するための設定が可能です。
利点
市場分析の向上:
- 日々の高値、安値、および日中の価格動向を明確に把握することで、市場の動きをよりよく理解できます。
- 日々の境界の視覚的な表現を活用して、より賢明なトレードの意思決定を行います。
時間を節約するツール:
- 手動チャート分析の時間を節約し、トレーディング戦略の実行に集中できます。
- 市場の状況を迅速に評価し、日々の価格動向に基づいてトレードを調整します。
強化されたトレーディング戦略:
- 日足キャンドルボックスをリファレンスとして、ストップロス、テイクプロフィット、およびエントリーポイントを設定します。
- 日々の市場トレンドをより明確に理解することで、トレーディング戦略を開発し、洗練させます。
理想的な対象:
- 日々の市場動向に合わせてトレードを行いたいデイトレーダー。
- 市場のエントリーポイントとエグジットポイントを向上させたいスイングトレーダー。
- チャート分析とトレード効率を向上させたいすべてのトレーダー。
結論
私たちのMQL5日足キャンドルボックスインディケーターでトレードを変革しましょう。より明瞭なチャート、より良い市場インサイト、強化されたトレーディング戦略を体験してください。今すぐダウンロードして、トレードを次のレベルに引き上げましょう!